How can I help you?
Axis Customization in Blazor 3D Chart Component
10 Nov 202510 minutes to read
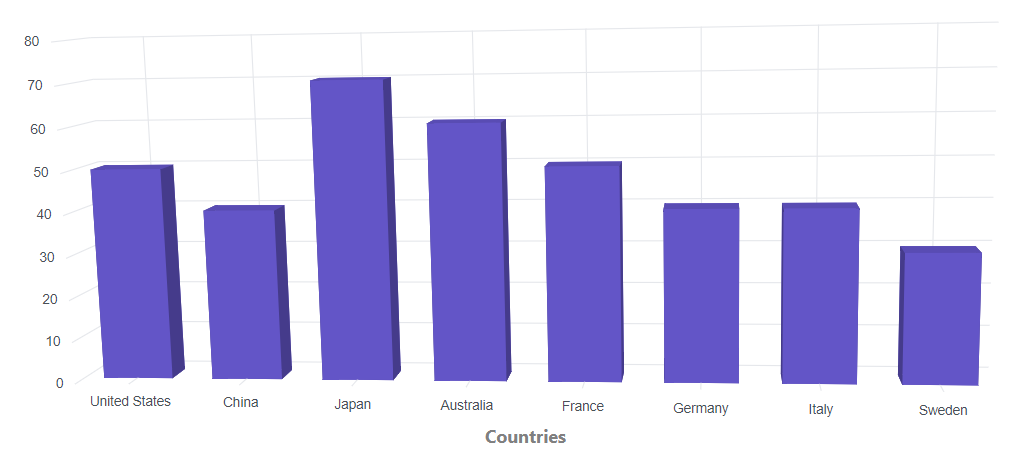
Title
The title for the axis can be added by using the Title property. It helps to provide quick information to the user about the data plotted in the axis. Title style can be customized using Chart3DAxisTitleStyle property of the axis.
@using Syncfusion.Blazor.Chart3D

<SfChart3D WallColor="transparent" EnableRotation="true" RotationAngle="7" TiltAngle="10" Depth="100">
    <Chart3DPrimaryXAxis Title="Countries" ValueType="Syncfusion.Blazor.Chart3D.ValueType.Category">
        <Chart3DAxisTitleStyle FontSize="16px" Color="grey" FontFamily="Segoe UI" FontWeight="bold">
        </Chart3DAxisTitleStyle>
    </Chart3DPrimaryXAxis>

    <Chart3DSeriesCollection>
        <Chart3DSeries DataSource="@MedalDetails" XName="Country" YName="Gold" Type="Chart3DSeriesType.Column">
        </Chart3DSeries>
    </Chart3DSeriesCollection>
</SfChart3D>

@code{
    public class Chart3DData
    {
        public string Country { get; set; }
        public double Gold { get; set; }
    }

    public List<Chart3DData> MedalDetails = new List<Chart3DData>
	{
		new Chart3DData { Country = "United States", Gold = 50 },
		new Chart3DData { Country = "China", Gold = 40 },
		new Chart3DData { Country = "Japan", Gold = 70 },
		new Chart3DData { Country = "Australia", Gold = 60 },
		new Chart3DData { Country = "France", Gold = 50 },
		new Chart3DData { Country = "Germany", Gold = 40 },
		new Chart3DData { Country = "Italy", Gold = 40 },
		new Chart3DData { Country = "Sweden", Gold = 30 }
    };
}
Title rotation
The title can be rotated from 0 to 360 degree by using the TitleRotationAngle property.
@using Syncfusion.Blazor.Chart3D

<SfChart3D WallColor="transparent" EnableRotation="true" RotationAngle="7" TiltAngle="10" Depth="100">
    <Chart3DPrimaryXAxis Title="Countries" TitleRotationAngle="90" ValueType="Syncfusion.Blazor.Chart3D.ValueType.Category">
        <Chart3DAxisTitleStyle FontSize="16px" Color="grey" FontFamily="Segoe UI" FontWeight="bold"></Chart3DAxisTitleStyle>
    </Chart3DPrimaryXAxis>

    <Chart3DSeriesCollection>
        <Chart3DSeries DataSource="@MedalDetails" XName="Country" YName="Gold" Type="Chart3DSeriesType.Column">
        </Chart3DSeries>
    </Chart3DSeriesCollection>
</SfChart3D>

@code{
    public class Chart3DData
    {
        public string Country { get; set; }
        public double Gold { get; set; }
    }

    public List<Chart3DData> MedalDetails = new List<Chart3DData>
	{
		new Chart3DData { Country = "United States", Gold = 50 },
		new Chart3DData { Country = "China", Gold = 40 },
		new Chart3DData { Country = "Japan", Gold = 70 },
		new Chart3DData { Country = "Australia", Gold = 60 },
		new Chart3DData { Country = "France", Gold = 50 },
		new Chart3DData { Country = "Germany", Gold = 40 },
		new Chart3DData { Country = "Italy", Gold = 40 },
		new Chart3DData { Country = "Sweden", Gold = 30 }
    };
}
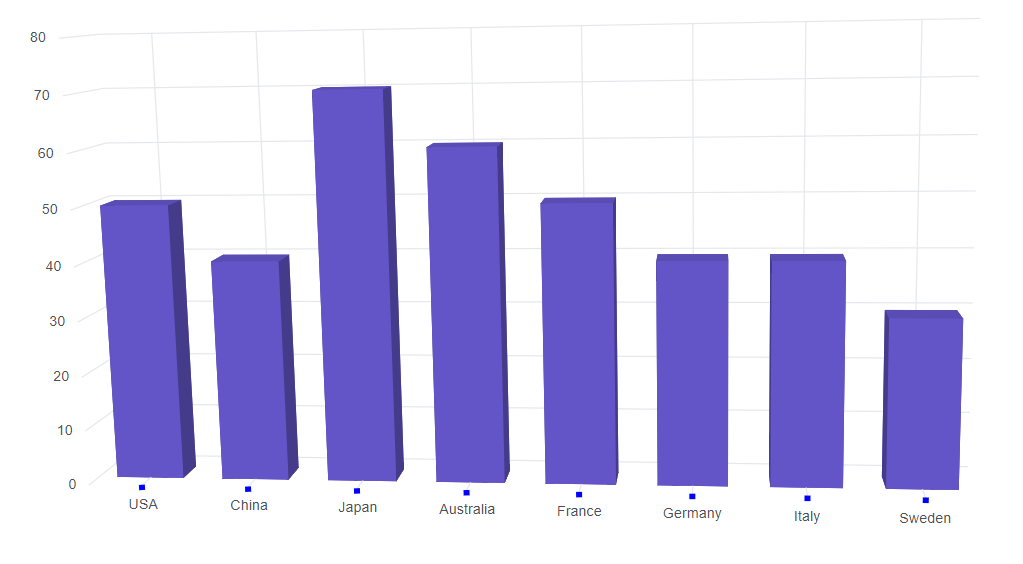
Tick lines customization
The width, color, and height of the minor and major tick lines can be customized using Chart3DMajorTickLines and Chart3DMinorTickLines properties in the axis.
@using Syncfusion.Blazor.Chart3D

<SfChart3D WallColor="transparent" EnableRotation="true" RotationAngle="7" TiltAngle="10" Depth="100">
    <Chart3DPrimaryXAxis ValueType="Syncfusion.Blazor.Chart3D.ValueType.Category">
       <Chart3DMajorTickLines Color="blue" Width="5"></Chart3DMajorTickLines>
    </Chart3DPrimaryXAxis>

    <Chart3DSeriesCollection>
        <Chart3DSeries DataSource="@MedalDetails" XName="Country" YName="Gold" Type="Chart3DSeriesType.Column" />
    </Chart3DSeriesCollection>
</SfChart3D>

@code{
    public class Chart3DData
    {
        public string Country { get; set; }
        public double Gold { get; set; }
    }

    public List<Chart3DData> MedalDetails = new List<Chart3DData>
    {
		new Chart3DData { Country = "United States", Gold = 50 },
		new Chart3DData { Country = "China", Gold = 40 },
		new Chart3DData { Country = "Japan", Gold = 70 },
		new Chart3DData { Country = "Australia", Gold = 60 },
		new Chart3DData { Country = "France", Gold = 50 },
		new Chart3DData { Country = "Germany", Gold = 40 },
		new Chart3DData { Country = "Italy", Gold = 40 },
		new Chart3DData { Country = "Sweden", Gold = 30 }
    };
}
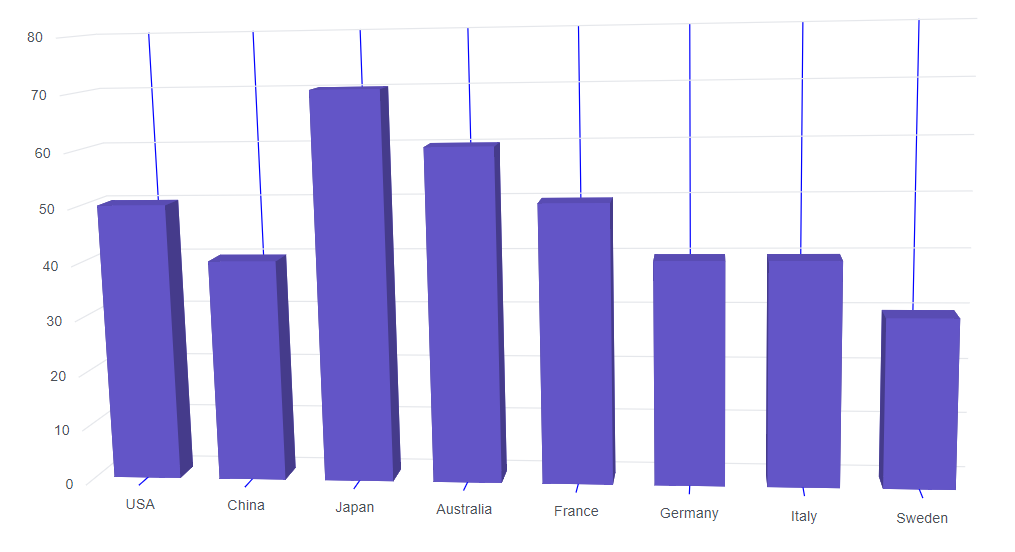
Grid lines customization
The width and color of the minor and major grid lines can be customized by using the Chart3DMajorGridLines and Chart3DMinorGridLines properties in the axis.
@using Syncfusion.Blazor.Chart3D

<SfChart3D WallColor="transparent" EnableRotation="true" RotationAngle="7" TiltAngle="10" Depth="100">
    <Chart3DPrimaryXAxis ValueType="Syncfusion.Blazor.Chart3D.ValueType.Category">
       <Chart3DMajorGridLines Color="blue" Width="1"></Chart3DMajorGridLines>
    </Chart3DPrimaryXAxis>

    <Chart3DSeriesCollection>
        <Chart3DSeries DataSource="@MedalDetails" XName="Country" YName="Gold" Type="Chart3DSeriesType.Column" />
    </Chart3DSeriesCollection>
</SfChart3D>

@code{
    public class Chart3DData
    {
        public string Country { get; set; }
        public double Gold { get; set; }
    }

    public List<Chart3DData> MedalDetails = new List<Chart3DData>
    {
		new Chart3DData { Country = "United States", Gold = 50 },
		new Chart3DData { Country = "China", Gold = 40 },
		new Chart3DData { Country = "Japan", Gold = 70 },
		new Chart3DData { Country = "Australia", Gold = 60 },
		new Chart3DData { Country = "France", Gold = 50 },
		new Chart3DData { Country = "Germany", Gold = 40 },
		new Chart3DData { Country = "Italy", Gold = 40 },
		new Chart3DData { Country = "Sweden", Gold = 30 }
    };
}
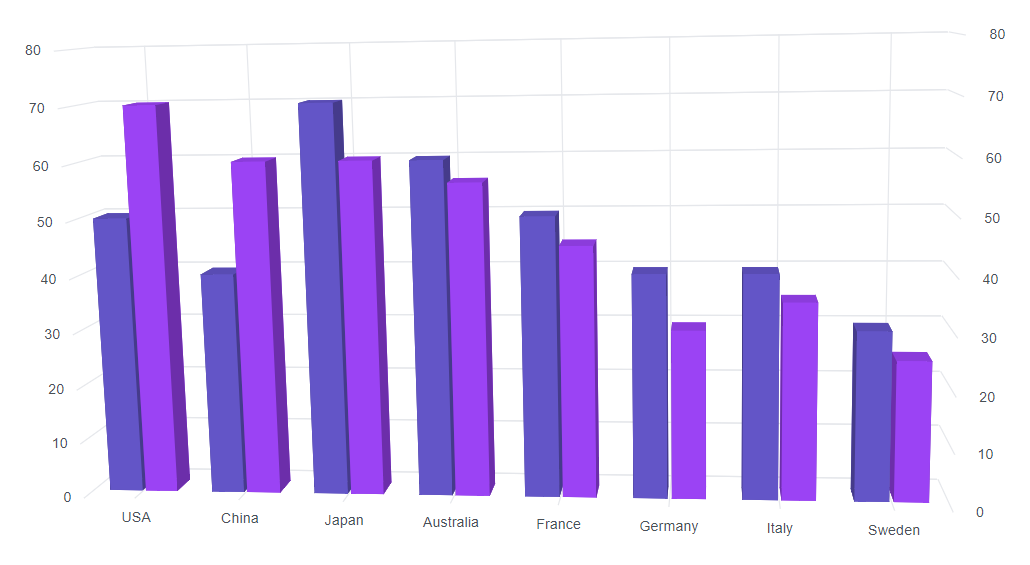
Multiple Axis
In addition to primary X and Y axis, n number of axis can be added to the chart. Series can be associated with this axis, by mapping with axis’s unique name.
@using Syncfusion.Blazor.Chart3D

<SfChart3D WallColor="transparent" EnableRotation="true" RotationAngle="7" TiltAngle="10" Depth="100">
    <Chart3DPrimaryXAxis ValueType="Syncfusion.Blazor.Chart3D.ValueType.Category">
    </Chart3DPrimaryXAxis>
    <Chart3DAxes>
        <Chart3DAxis Name="YAxis" OpposedPosition="true"/>
    </Chart3DAxes>
    <Chart3DSeriesCollection>
        <Chart3DSeries DataSource="@MedalDetails" XName="Country" YName="Gold" Type="Chart3DSeriesType.Column" />
        <Chart3DSeries DataSource="@MedalDetails" XName="Country" YName="Silver" Type="Chart3DSeriesType.Column" YAxisName="YAxis"/>
    </Chart3DSeriesCollection>
</SfChart3D>

@code{
    public class Chart3DData
    {
        public string Country { get; set; }
        public double Gold { get; set; }
        public double Silver { get; set; }
    }

    public List<Chart3DData> MedalDetails = new List<Chart3DData>
    {
		new Chart3DData { Country = "USA", Gold = 50, Silver = 70 },
		new Chart3DData { Country = "China", Gold = 40, Silver = 60 },
		new Chart3DData { Country = "Japan", Gold = 70, Silver = 60 },
		new Chart3DData { Country = "Australia", Gold = 60, Silver = 56 },
		new Chart3DData { Country = "France", Gold = 50, Silver = 45 },
		new Chart3DData { Country = "Germany", Gold = 40, Silver = 30 },
		new Chart3DData { Country = "Italy", Gold = 40, Silver = 35 },
		new Chart3DData { Country = "Sweden", Gold = 30, Silver = 25 }
    };
}
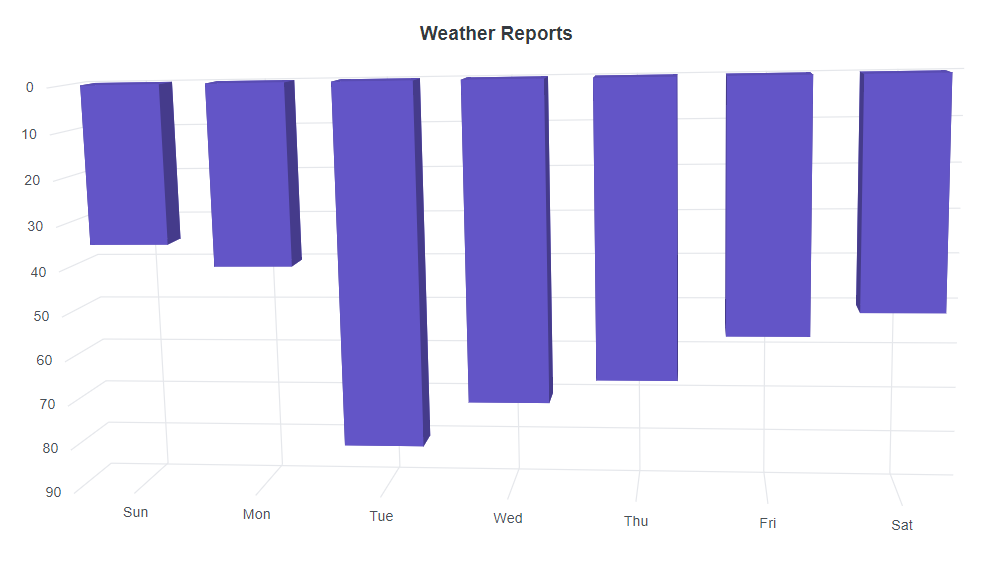
Inversed Axis
When an axis is inversed, highest value of the axis comes closer to origin and vice versa. To place an axis in inversed manner, set the IsInversed property to true.
@using Syncfusion.Blazor.Chart3D

<SfChart3D Title="Weather Reports" WallColor="transparent" EnableRotation="true" RotationAngle="7" TiltAngle="10" Depth="100">
    <Chart3DPrimaryXAxis ValueType="Syncfusion.Blazor.Chart3D.ValueType.Category" />

    <Chart3DPrimaryYAxis IsInversed="true" />

    <Chart3DSeriesCollection>
        <Chart3DSeries DataSource="@WeatherReports" XName="X" YName="Y" Type="Chart3DSeriesType.Column" />
    </Chart3DSeriesCollection>
</SfChart3D>

@code{
    public class Chart3DData
    {
        public string X { get; set; }
        public double Y { get; set; }
    }

    public List<Chart3DData> WeatherReports = new List<Chart3DData>
	{
        new Chart3DData { X = "Sun", Y = 35 },
        new Chart3DData { X = "Mon", Y = 40 },
        new Chart3DData { X = "Tue", Y = 80 },
        new Chart3DData { X = "Wed", Y = 70 },
        new Chart3DData { X = "Thu", Y = 65 },
        new Chart3DData { X = "Fri", Y = 55 },
        new Chart3DData { X = "Sat", Y = 50 }
    };
}
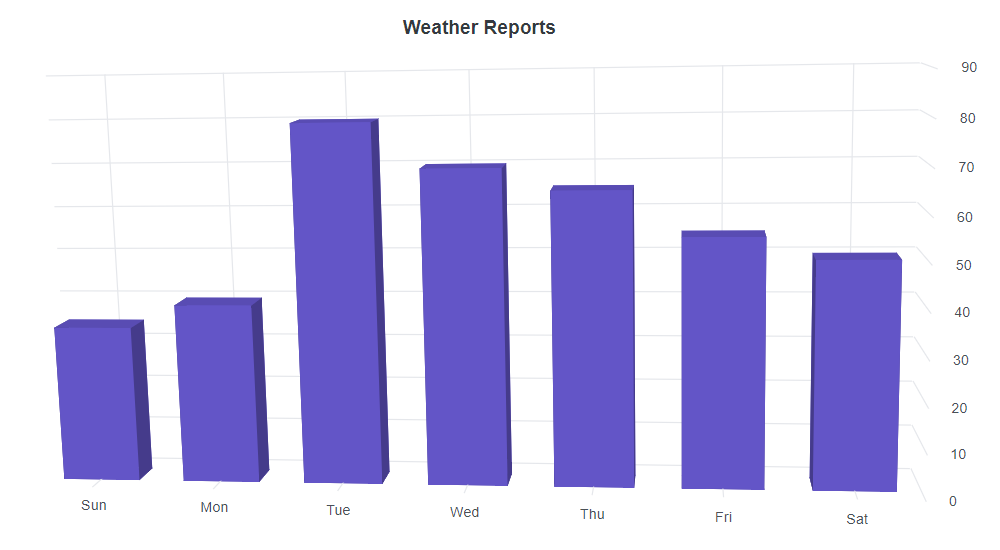
Opposed position
To place an axis opposite from its original position, set the OpposedPosition property to true.
@using Syncfusion.Blazor.Chart3D

<SfChart3D Title="Weather Reports" WallColor="transparent" EnableRotation="true" RotationAngle="7" TiltAngle="10" Depth="100">
    <Chart3DPrimaryXAxis ValueType="Syncfusion.Blazor.Chart3D.ValueType.Category" />

    <Chart3DPrimaryYAxis OpposedPosition="true" />

    <Chart3DSeriesCollection>
        <Chart3DSeries DataSource="@WeatherReports" XName="X" YName="Y" Type="Chart3DSeriesType.Column" />
    </Chart3DSeriesCollection>
</SfChart3D>

@code{
    public class Chart3DData
    {
        public string X { get; set; }
        public double Y { get; set; }
    }

    public List<Chart3DData> WeatherReports = new List<Chart3DData>
	{
        new Chart3DData { X = "Sun", Y = 35 },
        new Chart3DData { X = "Mon", Y = 40 },
        new Chart3DData { X = "Tue", Y = 80 },
        new Chart3DData { X = "Wed", Y = 70 },
        new Chart3DData { X = "Thu", Y = 65 },
        new Chart3DData { X = "Fri", Y = 55 },
        new Chart3DData { X = "Sat", Y = 50 }
    };
}