Axis Labels in Blazor 3D Chart Component
10 Nov 20258 minutes to read
Axis labels are the labels that are positioned adjacent to the y-axis and beneath the x-axis. It provides descriptive information about the axis.
Smart axis labels
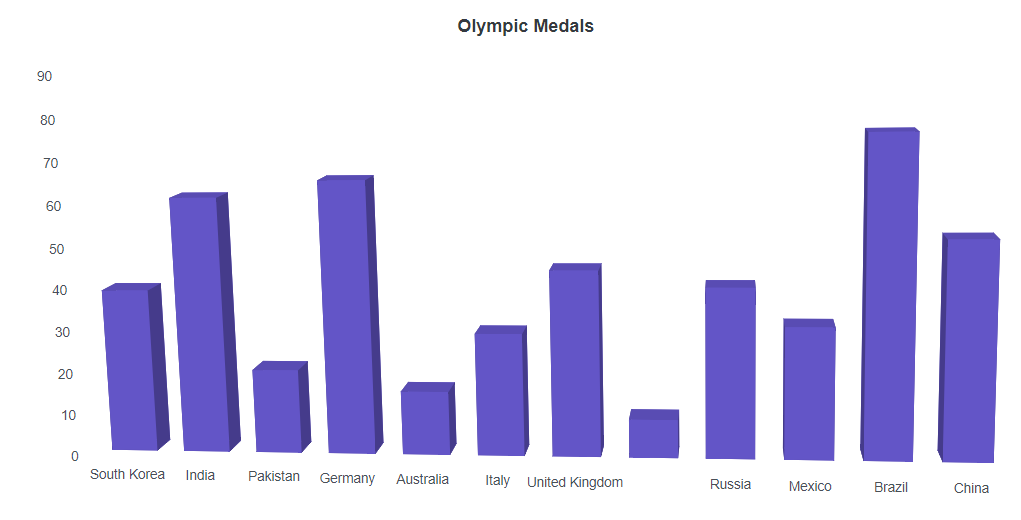
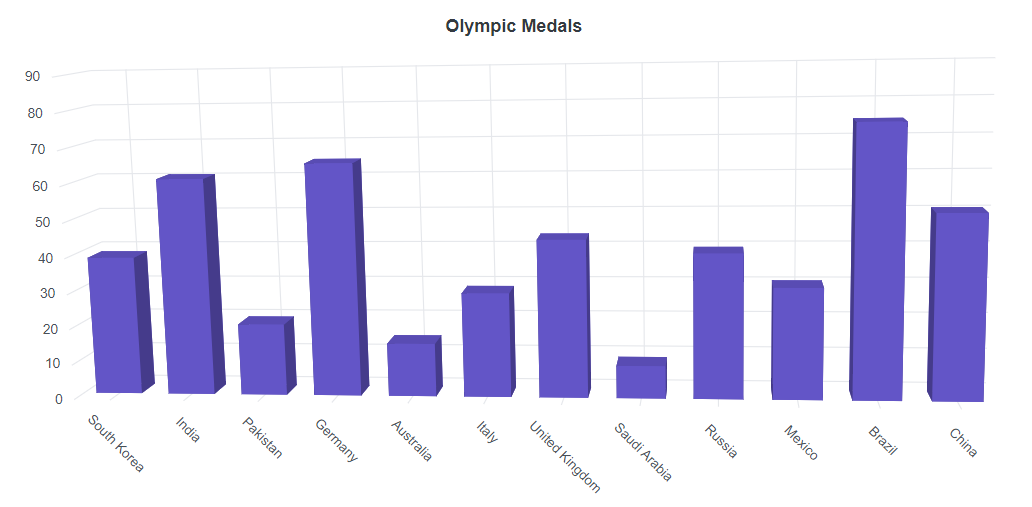
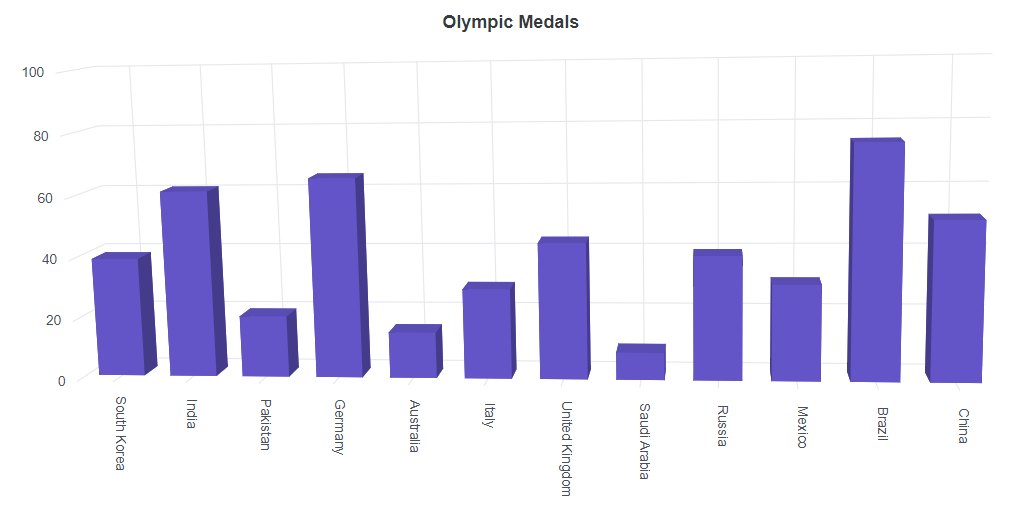
When the axis labels overlap with each other, LabelIntersectAction property in the axis can be used to place them smartly.
Case 1: When setting LabelIntersectAction as Hide.
@using Syncfusion.Blazor.Chart3D

<SfChart3D Title="Olympic Medals" WallColor="transparent" EnableRotation="true" RotationAngle="7" TiltAngle="10" Depth="100">
    <Chart3DPrimaryXAxis ValueType="Syncfusion.Blazor.Chart3D.ValueType.Category" LabelIntersectAction="Syncfusion.Blazor.Chart3D.LabelIntersectAction.Hide" />

    <Chart3DSeriesCollection>
        <Chart3DSeries DataSource="@MedalDetails" XName="X" YName="Y" Type="Chart3DSeriesType.Column" />
    </Chart3DSeriesCollection>
</SfChart3D>

@code{
    public class Chart3DData
    {
        public string X { get; set; }
        public double Y { get; set; }
    }

    public List<Chart3DData> MedalDetails = new List<Chart3DData>
    {
		new Chart3DData { X = "South Korea", Y = 39 },
		new Chart3DData { X = "India", Y = 61 },
		new Chart3DData { X = "Pakistan", Y = 20 },
		new Chart3DData { X = "Germany", Y = 65 },
		new Chart3DData { X = "Australia", Y = 15 },
		new Chart3DData { X = "Italy", Y = 29 },
		new Chart3DData { X = "United Kingdom", Y = 44 },
		new Chart3DData { X = "Saudi Arabia", Y = 9 },
		new Chart3DData { X = "Russia", Y = 40 },
		new Chart3DData { X = "Mexico", Y = 31 },
		new Chart3DData { X = "Brazil", Y = 75 },
		new Chart3DData { X = "China", Y = 51 }
    };
}
Case 2: When setting LabelIntersectAction as Rotate45.
@using Syncfusion.Blazor.Chart3D

<SfChart3D Title="Olympic Medals" WallColor="transparent" EnableRotation="true" RotationAngle="7" TiltAngle="10" Depth="100">
    <Chart3DPrimaryXAxis ValueType="Syncfusion.Blazor.Chart3D.ValueType.Category" LabelIntersectAction="Syncfusion.Blazor.Chart3D.LabelIntersectAction.Rotate45" />

    <Chart3DSeriesCollection>
        <Chart3DSeries DataSource="@MedalDetails" XName="X" YName="Y" Type="Chart3DSeriesType.Column" />
    </Chart3DSeriesCollection>
</SfChart3D>

@code{
    public class Chart3DData
    {
        public string X { get; set; }
        public double Y { get; set; }
    }

    public List<Chart3DData> MedalDetails = new List<Chart3DData>
    {
		new Chart3DData { X = "South Korea", Y = 39 },
		new Chart3DData { X = "India", Y = 61 },
		new Chart3DData { X = "Pakistan", Y = 20 },
		new Chart3DData { X = "Germany", Y = 65 },
		new Chart3DData { X = "Australia", Y = 15 },
		new Chart3DData { X = "Italy", Y = 29 },
		new Chart3DData { X = "United Kingdom", Y = 44 },
		new Chart3DData { X = "Saudi Arabia", Y = 9 },
		new Chart3DData { X = "Russia", Y = 40 },
		new Chart3DData { X = "Mexico", Y = 31 },
		new Chart3DData { X = "Brazil", Y = 75 },
		new Chart3DData { X = "China", Y = 51 }
    };
}
Case 3: When setting LabelIntersectAction as Rotate90.
@using Syncfusion.Blazor.Chart3D

<SfChart3D Title="Olympic Medals" WallColor="transparent" EnableRotation="true" RotationAngle="7" TiltAngle="10" Depth="100">
    <Chart3DPrimaryXAxis ValueType="Syncfusion.Blazor.Chart3D.ValueType.Category" LabelIntersectAction="Syncfusion.Blazor.Chart3D.LabelIntersectAction.Rotate90" />

    <Chart3DSeriesCollection>
        <Chart3DSeries DataSource="@MedalDetails" XName="X" YName="Y" Type="Chart3DSeriesType.Column" />
    </Chart3DSeriesCollection>
</SfChart3D>

@code{
    public class Chart3DData
    {
        public string X { get; set; }
        public double Y { get; set; }
    }

    public List<Chart3DData> MedalDetails = new List<Chart3DData>
    {
		new Chart3DData { X = "South Korea", Y = 39 },
		new Chart3DData { X = "India", Y = 61 },
		new Chart3DData { X = "Pakistan", Y = 20 },
		new Chart3DData { X = "Germany", Y = 65 },
		new Chart3DData { X = "Australia", Y = 15 },
		new Chart3DData { X = "Italy", Y = 29 },
		new Chart3DData { X = "United Kingdom", Y = 44 },
		new Chart3DData { X = "Saudi Arabia", Y = 9 },
		new Chart3DData { X = "Russia", Y = 40 },
		new Chart3DData { X = "Mexico", Y = 31 },
		new Chart3DData { X = "Brazil", Y = 75 },
		new Chart3DData { X = "China", Y = 51 }
    };
}
Edge label placement
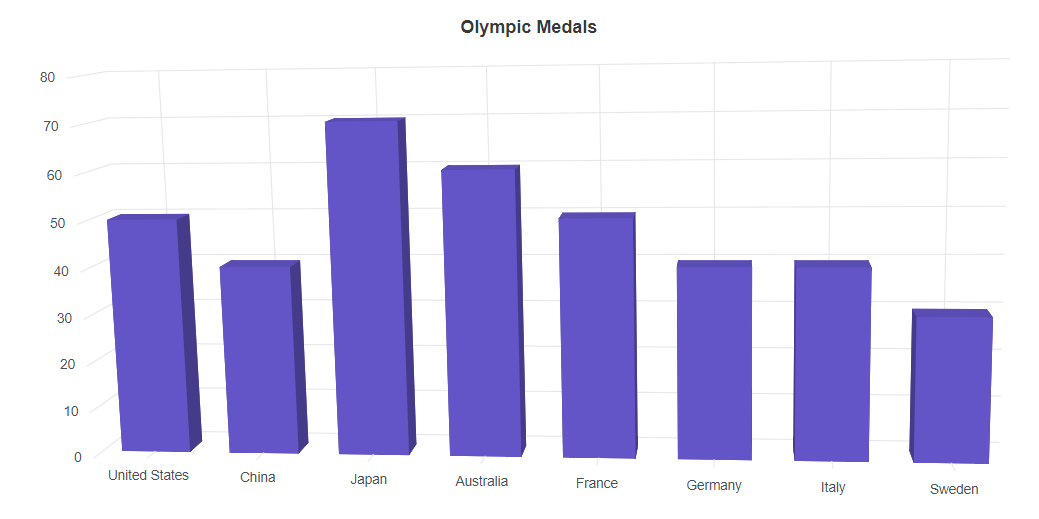
Labels with long text at the edges of an axis may appear partially in the 3D chart. To avoid this,
use the EdgeLabelPlacement property in axis, which moves the label inside the chart area for better appearance or hides it.
@using Syncfusion.Blazor.Chart3D

<SfChart3D Title="Olympic Medals" WallColor="transparent" EnableRotation="true" RotationAngle="7" TiltAngle="10" Depth="100">
    <Chart3DPrimaryXAxis EdgeLabelPlacement="Syncfusion.Blazor.Chart3D.EdgeLabelPlacement.Shift" ValueType="Syncfusion.Blazor.Chart3D.ValueType.Category">
    </Chart3DPrimaryXAxis>

    <Chart3DSeriesCollection>
        <Chart3DSeries DataSource="@MedalDetails" XName="Country" YName="Gold" Type="Chart3DSeriesType.Column">
        </Chart3DSeries>
    </Chart3DSeriesCollection>
</SfChart3D>

@code{
    public class Chart3DData
    {
        public string Country { get; set; }
        public double Gold { get; set; }
    }

    public List<Chart3DData> MedalDetails = new List<Chart3DData>
	{
		new Chart3DData { Country = "United States", Gold = 50 },
		new Chart3DData { Country = "China", Gold = 40 },
		new Chart3DData { Country = "Japan", Gold = 70 },
		new Chart3DData { Country = "Australia", Gold = 60 },
		new Chart3DData { Country = "France", Gold = 50 },
		new Chart3DData { Country = "Germany", Gold = 40 },
		new Chart3DData { Country = "Italy", Gold = 40 },
		new Chart3DData { Country = "Sweden", Gold = 30 }
    };
}
Maximum labels
The labels will be rendered based on the count in the MaximumLabels property per 100 pixel. If the range (minimum, maximum, interval) and MaximumLabels are set, then the priority goes to range. If the range is not set, then the priority goes to MaximumLabels property.
@using Syncfusion.Blazor.Chart3D

<SfChart3D Title="Product X" WallColor="transparent" EnableRotation="true" RotationAngle="7" TiltAngle="10" Depth="100">
    <Chart3DPrimaryXAxis EdgeLabelPlacement="EdgeLabelPlacement.Shift" MaximumLabels="1" ValueType="Syncfusion.Blazor.Chart3D.ValueType.Category">
    </Chart3DPrimaryXAxis>
    <Chart3DPrimaryYAxis Title="Profit ($)"></Chart3DPrimaryYAxis>
    <Chart3DSeriesCollection>
        <Chart3DSeries DataSource="@ChartPoints" XName="Period" YName="Price" Name="Product X" Type="Chart3DSeriesType.Column">
        </Chart3DSeries>
    </Chart3DSeriesCollection>
</SfChart3D>

@code
{
    private Random randomNum = new Random();
    private double PriceY = 80;
    public List<ChartData> ChartPoints { get; set; } = new List<ChartData>();
    protected override void OnInitialized()
    {
        GetChartPoints(50);
    }
    private void GetChartPoints(int value)
    {
        if (ChartPoints.Count > 0)
        {
            ChartPoints.Clear();
        }
        for (int i = 1; i < value; i++)
        {
            if (randomNum.NextDouble() > 0.5)
            {
                PriceY += randomNum.NextDouble();
            }
            else
            {
                PriceY -= randomNum.NextDouble();
            }
            ChartPoints.Add(new ChartData
                {
                    Period = i,
                    Price = Math.Round(PriceY)
                }
            );
        }
    }
    public class ChartData
    {
        public double Period { get; set; }
        public double Price { get; set; }
    }
}