How can I help you?
Data Labels in Blazor 3D Chart Component
19 May 202615 minutes to read
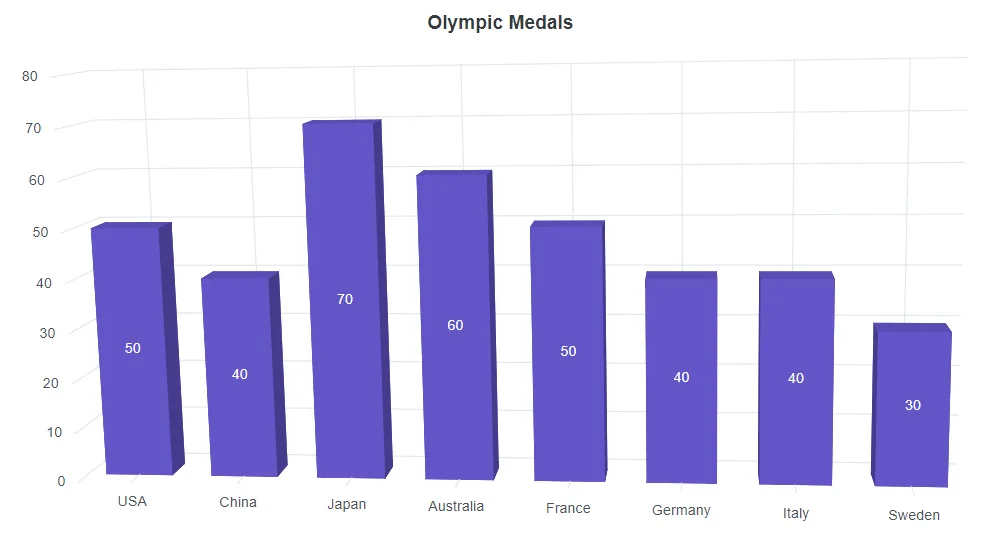
Data labels are fields that includes information about the sample point connected to an output. It can be added to a chart series by enabling the Visible property in the Chart3DDataLabel. By default, the labels will arrange smartly without overlapping.
@using Syncfusion.Blazor.Chart3D

<SfChart3D Title="Olympic Medals" WallColor="transparent" EnableRotation="true" RotationAngle="7" TiltAngle="10" Depth="100">
    <Chart3DPrimaryXAxis ValueType="Syncfusion.Blazor.Chart3D.ValueType.Category">
       </Chart3DPrimaryXAxis>

    <Chart3DSeriesCollection>
        <Chart3DSeries DataSource="@MedalDetails" XName="Country" YName="Gold" Type="Chart3DSeriesType.Column">
            <Chart3DDataLabel Visible="true"></Chart3DDataLabel>
        </Chart3DSeries>
    </Chart3DSeriesCollection>
</SfChart3D>

@code{
    public class Chart3DData
    {
        public string Country { get; set; }
        public double Gold { get; set; }
        public double Silver { get; set; }
    }

    public List<Chart3DData> MedalDetails = new List<Chart3DData>
    {
		new Chart3DData{ Country = "USA", Gold = 50, Silver = 70 },
		new Chart3DData{ Country = "China", Gold = 40, Silver = 60 },
		new Chart3DData{ Country = "Japan", Gold = 70, Silver = 60 },
		new Chart3DData{ Country = "Australia", Gold = 60, Silver = 56 },
		new Chart3DData{ Country = "France", Gold = 50, Silver = 45 },
		new Chart3DData{ Country = "Germany", Gold = 40, Silver = 30 },
		new Chart3DData{ Country = "Italy", Gold = 40, Silver = 35 },
		new Chart3DData{ Country = "Sweden", Gold = 30, Silver = 25 }
    };
}
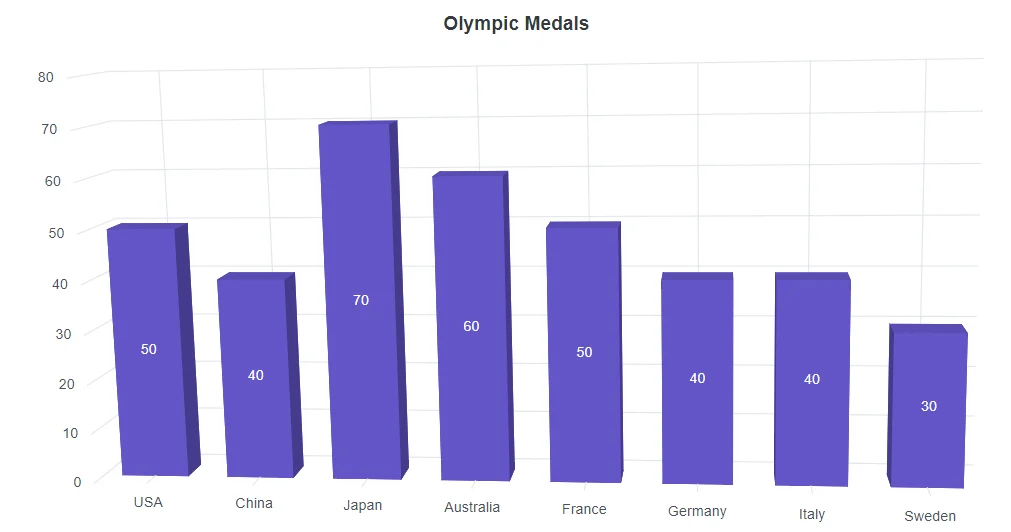
Position
The Position property is used to place the label either on Top, Middle, or Bottom.
@using Syncfusion.Blazor.Chart3D

<SfChart3D Title="Olympic Medals" WallColor="transparent" EnableRotation="true" RotationAngle="7" TiltAngle="10" Depth="100">
    <Chart3DPrimaryXAxis ValueType="Syncfusion.Blazor.Chart3D.ValueType.Category">
       </Chart3DPrimaryXAxis>

    <Chart3DSeriesCollection>
        <Chart3DSeries DataSource="@MedalDetails" XName="Country" YName="Gold" Type="Chart3DSeriesType.Column">
            <Chart3DDataLabel Visible="true" Position="Syncfusion.Blazor.Chart3D.Chart3DDataLabelPosition.Middle"></Chart3DDataLabel>
        </Chart3DSeries>
    </Chart3DSeriesCollection>
</SfChart3D>

@code{
    public class Chart3DData
    {
        public string Country { get; set; }
        public double Gold { get; set; }
        public double Silver { get; set; }
    }

    public List<Chart3DData> MedalDetails = new List<Chart3DData>
    {
		new Chart3DData{ Country = "USA", Gold = 50, Silver = 70 },
		new Chart3DData{ Country = "China", Gold = 40, Silver = 60 },
		new Chart3DData{ Country = "Japan", Gold = 70, Silver = 60 },
		new Chart3DData{ Country = "Australia", Gold = 60, Silver = 56 },
		new Chart3DData{ Country = "France", Gold = 50, Silver = 45 },
		new Chart3DData{ Country = "Germany", Gold = 40, Silver = 30 },
		new Chart3DData{ Country = "Italy", Gold = 40, Silver = 35 },
		new Chart3DData{ Country = "Sweden", Gold = 30, Silver = 25 }
    };
}
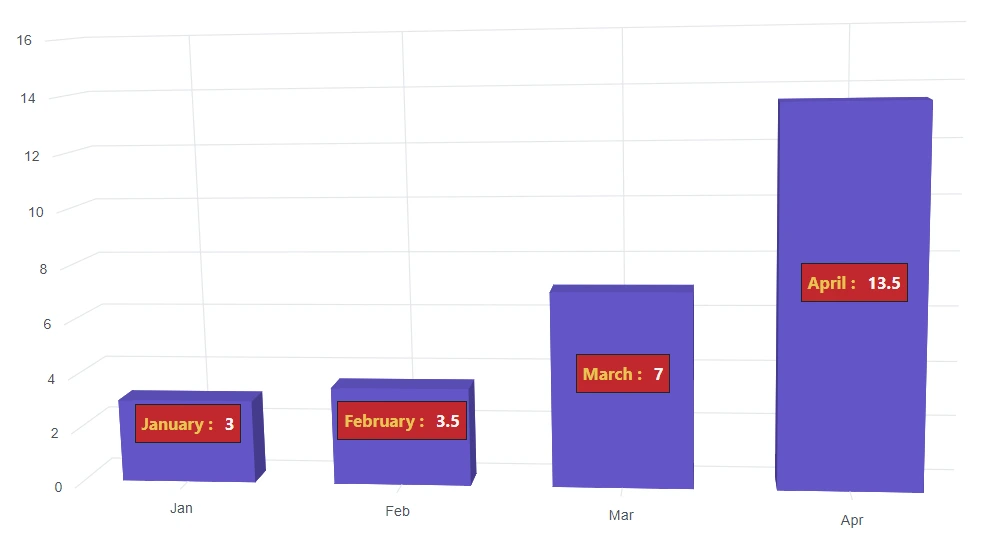
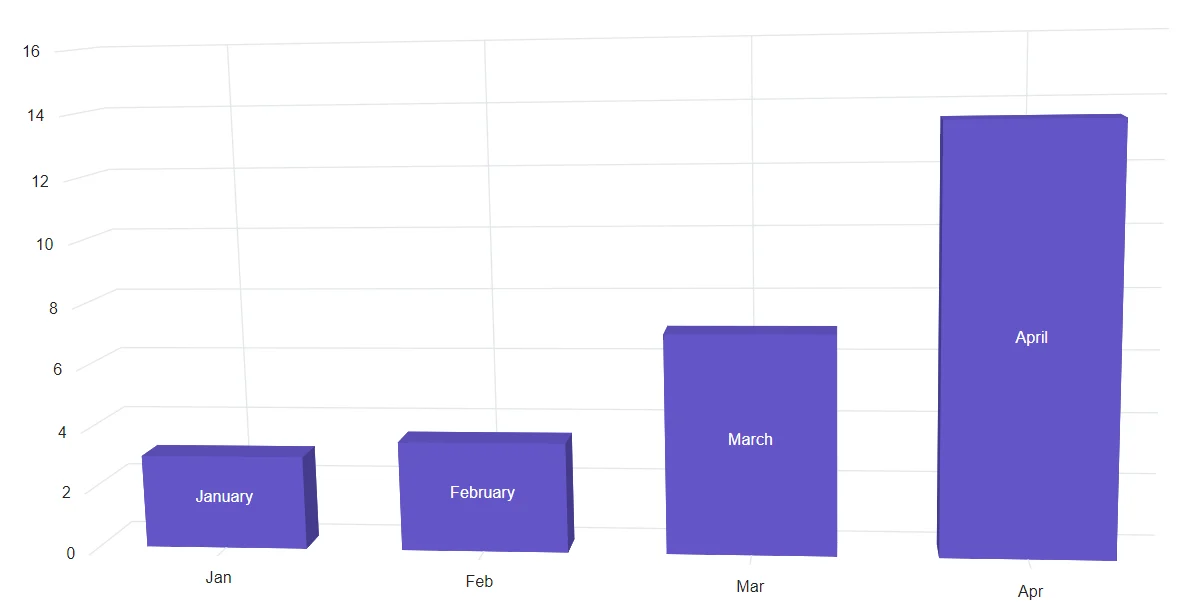
Template
Label content can be formatted by using the template option. Inside the template, the placeholder text ${point.x} and ${point.y} can be added to display corresponding data points x & y value. Using Chart3DDataLabelTemplate property, the data label template can be set.
@using Syncfusion.Blazor.Chart3D

<SfChart3D WallColor="transparent" EnableRotation="true" RotationAngle="7" TiltAngle="10" Depth="100">
    <Chart3DPrimaryXAxis ValueType="Syncfusion.Blazor.Chart3D.ValueType.Category" />

    <Chart3DSeriesCollection>
        <Chart3DSeries DataSource="@SalesReports" XName="X" YName="Y">
                <Chart3DDataLabel Visible="true" NameField="Text">
                    <Chart3DDataLabelTemplate>
                        @{
                            var data = context as Chart3DDataPointInfo;
                        }
                        <table>
                            <tr>
                                <td align="center" style="background-color: #C1272D; font-size: 14px; color: #E7C554; font-weight: bold; padding: 5px"> @data.PointText :</td>
                                <td align="center" style="background-color: #C1272D; font-size: 14px; color: whitesmoke; font-weight: bold; padding: 5px"> @data.Y</td>
                            </tr>
                        </table>
                    </Chart3DDataLabelTemplate>
                </Chart3DDataLabel>
        </Chart3DSeries>
    </Chart3DSeriesCollection>
</SfChart3D>

@code{
    public class Data
    {
        public string X { get; set; }
        public double Y { get; set; }
        public string Text { get; set; }
    }

    public List<Data> SalesReports = new List<Data>
	{
       new Data{ X= "Jan", Y= 3, Text= "January" },
       new Data{ X= "Feb", Y= 3.5, Text= "February" },
       new Data{ X= "Mar", Y= 7, Text= "March" },
       new Data{ X= "Apr", Y= 13.5, Text= "April" }
    };
}
Text mapping
Text from the data source can be mapped using the NameField property.
@using Syncfusion.Blazor.Chart3D

<SfChart3D WallColor="transparent" EnableRotation="true" RotationAngle="7" TiltAngle="10" Depth="100">
    <Chart3DPrimaryXAxis ValueType="Syncfusion.Blazor.Chart3D.ValueType.Category"></Chart3DPrimaryXAxis>

    <Chart3DSeriesCollection>
        <Chart3DSeries DataSource="@WeatherReports" XName="X" YName="Y" Type="Chart3DSeriesType.Column">
            <Chart3DDataLabel Visible="true" NameField="Text"></Chart3DDataLabel>
        </Chart3DSeries>
    </Chart3DSeriesCollection>
</SfChart3D>

@code{
    public class Data
    {
        public string X { get; set; }
        public double Y { get; set; }
        public string Text { get; set; }
    }

    public List<Data> WeatherReports = new List<Data>
	{
	   new Data{ X = "Jan", Y = 3, Text = "January" },
	   new Data{ X = "Feb", Y = 3.5, Text = "February" },
	   new Data{ X = "Mar", Y = 7, Text = "March" },
	   new Data{ X = "Apr", Y = 13.5, Text = "April" }
	};
}
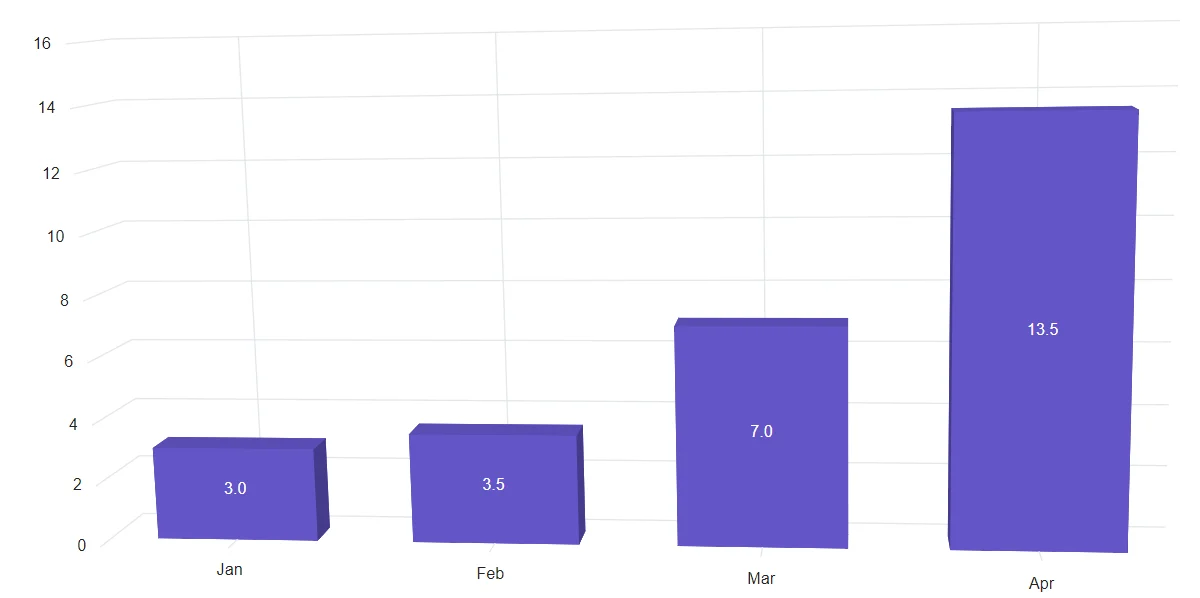
Format
Data label for the chart can be formatted using the Format property. The global formatting options can be used as ‘N1’, ‘P1’, and ‘C1’.
@using Syncfusion.Blazor.Chart3D

<SfChart3D WallColor="transparent" EnableRotation="true" RotationAngle="7" TiltAngle="10" Depth="100">
    <Chart3DPrimaryXAxis ValueType="Syncfusion.Blazor.Chart3D.ValueType.Category"></Chart3DPrimaryXAxis>

    <Chart3DSeriesCollection>
        <Chart3DSeries DataSource="@WeatherReports" XName="X" YName="Y" Type="Chart3DSeriesType.Column">
            <Chart3DDataLabel Visible="true" Format="N1"></Chart3DDataLabel>
        </Chart3DSeries>
    </Chart3DSeriesCollection>
</SfChart3D>

@code{
    public class Data
    {
        public string X { get; set; }
        public double Y { get; set; }
        public string Text { get; set; }
    }

    public List<Data> WeatherReports = new List<Data>
	{
	   new Data{ X = "Jan", Y = 3, Text = "January" },
	   new Data{ X = "Feb", Y = 3.5, Text = "February" },
	   new Data{ X = "Mar", Y = 7, Text = "March" },
	   new Data{ X = "Apr", Y = 13.5, Text = "April" }
	};
}
The table below shows the results of applying various commonly used label formats to numeric data.
| Value | Format | Resultant Value | Description |
|---|---|---|---|
| 1000 | n1 | 1000.0 | The number is rounded to 1 decimal place. |
| 1000 | n2 | 1000.00 | The number is rounded to 2 decimal places. |
| 1000 | n3 | 1000.000 | The number is rounded to 3 decimal place. |
| 0.01 | p1 | 1.0% | The number is converted to percentage with 1 decimal place. |
| 0.01 | p2 | 1.00% | The number is converted to percentage with 2 decimal place. |
| 0.01 | p3 | 1.000% | The number is converted to percentage with 3 decimal place. |
| 1000 | c1 | $1000.0 | The currency symbol is appended to number and number is rounded to 1 decimal place. |
| 1000 | c2 | $1000.00 | The currency symbol is appended to number and number is rounded to 2 decimal place. |
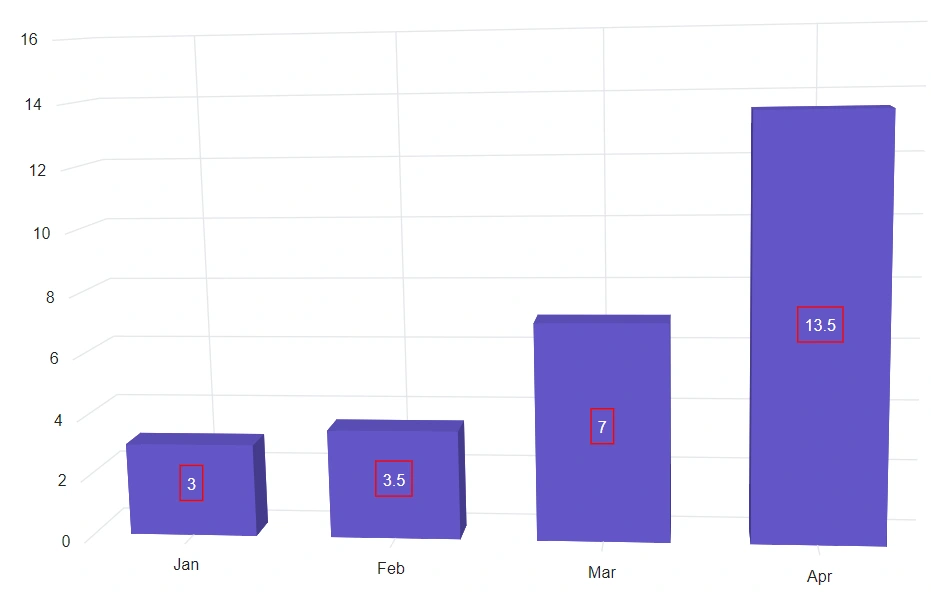
Margin
The Margin option can be applied to the data label to create space around the element.
@using Syncfusion.Blazor.Chart3D

<SfChart3D WallColor="transparent" EnableRotation="true" RotationAngle="7" TiltAngle="10" Depth="100">
    <Chart3DPrimaryXAxis ValueType="Syncfusion.Blazor.Chart3D.ValueType.Category"></Chart3DPrimaryXAxis>

    <Chart3DSeriesCollection>
        <Chart3DSeries DataSource="@WeatherReports" XName="X" YName="Y" Type="Chart3DSeriesType.Column">
            <Chart3DDataLabel Visible="true">
                <Chart3DDataLabelBorder Color="red" Width="1"></Chart3DDataLabelBorder>
                <Chart3DDataLabelMargin Bottom="5" Left="5" Right="5" Top="5"></Chart3DDataLabelMargin>
            </Chart3DDataLabel>
        </Chart3DSeries>
    </Chart3DSeriesCollection>
</SfChart3D>

@code{
    public class Data
    {
        public string X { get; set; }
        public double Y { get; set; }
        public string Text { get; set; }
    }

    public List<Data> WeatherReports = new List<Data>
	{
	   new Data{ X = "Jan", Y = 3, Text = "January" },
	   new Data{ X = "Feb", Y = 3.5, Text = "February" },
	   new Data{ X = "Mar", Y = 7, Text = "March" },
	   new Data{ X = "Apr", Y = 13.5, Text = "April" }
	};
}
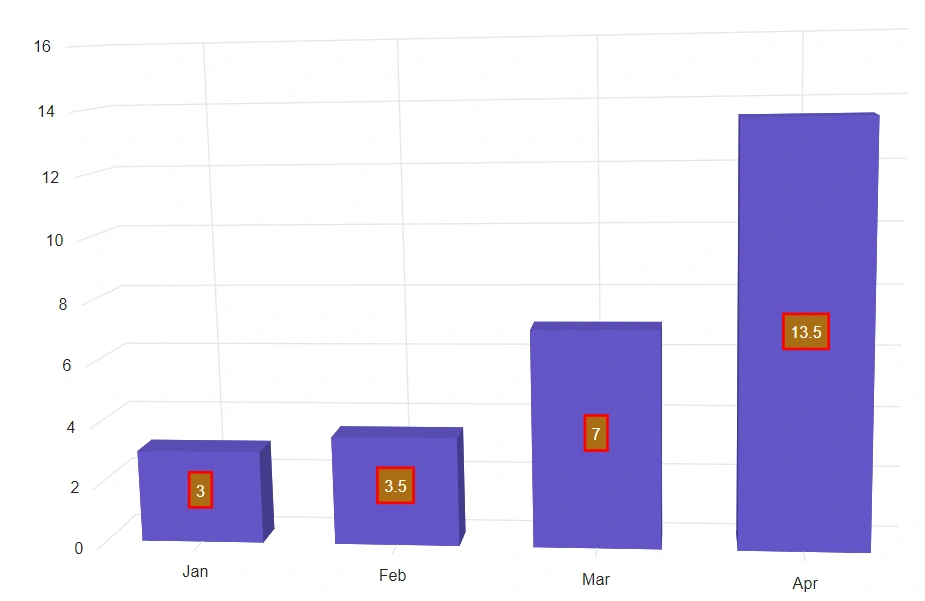
Customization
The stroke and border of data label can be customized using Fill and Chart3DDataLabelBorder properties.
@using Syncfusion.Blazor.Chart3D

<SfChart3D WallColor="transparent" EnableRotation="true" RotationAngle="7" TiltAngle="10" Depth="100">
    <Chart3DPrimaryXAxis ValueType="Syncfusion.Blazor.Chart3D.ValueType.Category"></Chart3DPrimaryXAxis>

    <Chart3DSeriesCollection>
        <Chart3DSeries DataSource="@WeatherReports" XName="X" YName="Y" Type="Chart3DSeriesType.Column">
            <Chart3DDataLabel Visible="true" Fill="#AB6E15">
                    <Chart3DDataLabelBorder Width="2" Color="red"></Chart3DDataLabelBorder>
            </Chart3DDataLabel>
        </Chart3DSeries>
    </Chart3DSeriesCollection>
</SfChart3D>

@code{
    public class Data
    {
        public string X { get; set; }
        public double Y { get; set; }
        public string Text { get; set; }
    }

    public List<Data> WeatherReports = new List<Data>
	{
	   new Data{ X = "Jan", Y = 3, Text = "January" },
	   new Data{ X = "Feb", Y = 3.5, Text = "February" },
	   new Data{ X = "Mar", Y = 7, Text = "March" },
	   new Data{ X = "Apr", Y = 13.5, Text = "April" }
	};
}
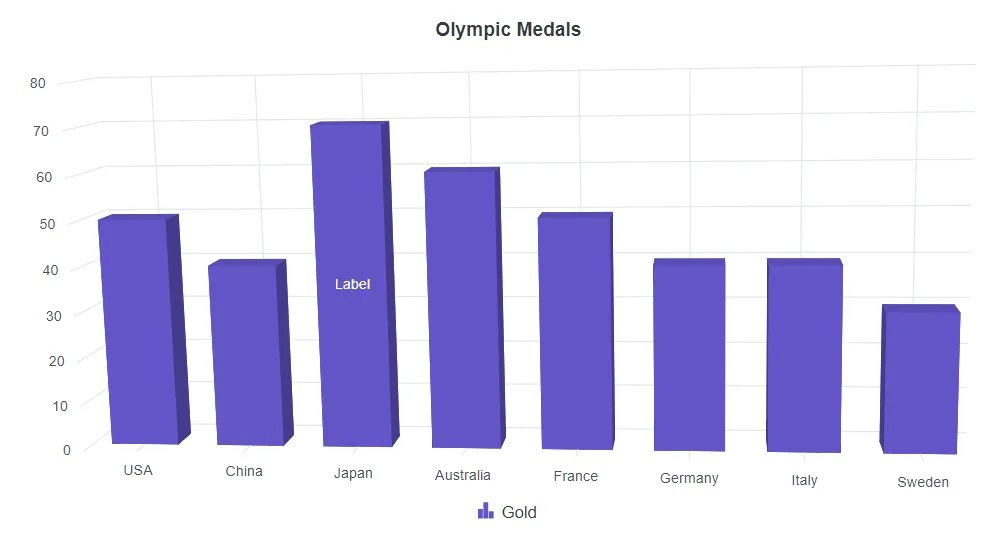
Customizing specific label
A specific label can be customized by using the TextRender event. The TextRender event allows you to change the label text for the point.
@using Syncfusion.Blazor.Chart3D

<SfChart3D Title="Olympic Medals" DataLabelRendering="TextRender" WallColor="transparent" EnableRotation="true" RotationAngle="7" TiltAngle="10" Depth="100">
    <Chart3DPrimaryXAxis ValueType="Syncfusion.Blazor.Chart3D.ValueType.Category"/>
    <Chart3DSeriesCollection>
        <Chart3DSeries DataSource="@MedalDetails" Name="Gold" XName="Country" Opacity="1" YName="Gold" Type="Chart3DSeriesType.Column">
            <Chart3DDataLabel Visible="true"></Chart3DDataLabel>
        </Chart3DSeries>
    </Chart3DSeriesCollection>

    <Chart3DLegendSettings Visible="true"></Chart3DLegendSettings>
</SfChart3D>

@code{

    public class Chart3DData
    {
        public string Country { get; set; }
        public double Gold { get; set; }
        public double Silver { get; set; }
        public double Bronze { get; set; }
    }

    public List<Chart3DData> MedalDetails = new List<Chart3DData>
	{
		new Chart3DData { Country = "USA", Gold = 50, Silver = 70, Bronze = 45 },
        new Chart3DData { Country = "China", Gold = 40, Silver = 60, Bronze = 55 },
        new Chart3DData { Country = "Japan", Gold = 70, Silver = 60, Bronze = 50 },
        new Chart3DData { Country = "Australia", Gold = 60, Silver = 56, Bronze = 40 },
        new Chart3DData { Country = "France", Gold = 50, Silver = 45, Bronze = 35 },
        new Chart3DData { Country = "Germany", Gold = 40, Silver = 30, Bronze = 22 },
        new Chart3DData { Country = "Italy", Gold = 40, Silver = 35, Bronze = 37 },
        new Chart3DData { Country = "Sweden", Gold = 30, Silver = 25, Bronze = 27 }
	};

    public void TextRender(Chart3DTextRenderEventArgs args)
    {
        if (args.Point.Index == 2)
        {
            args.Text = "Label";
        }
        else
        {
            args.Cancel = true;
        }
    }
}