How can I help you?
Legend in Blazor 3D Chart Component
10 Nov 202524 minutes to read
Legend provides information about the series rendered in the 3D chart.
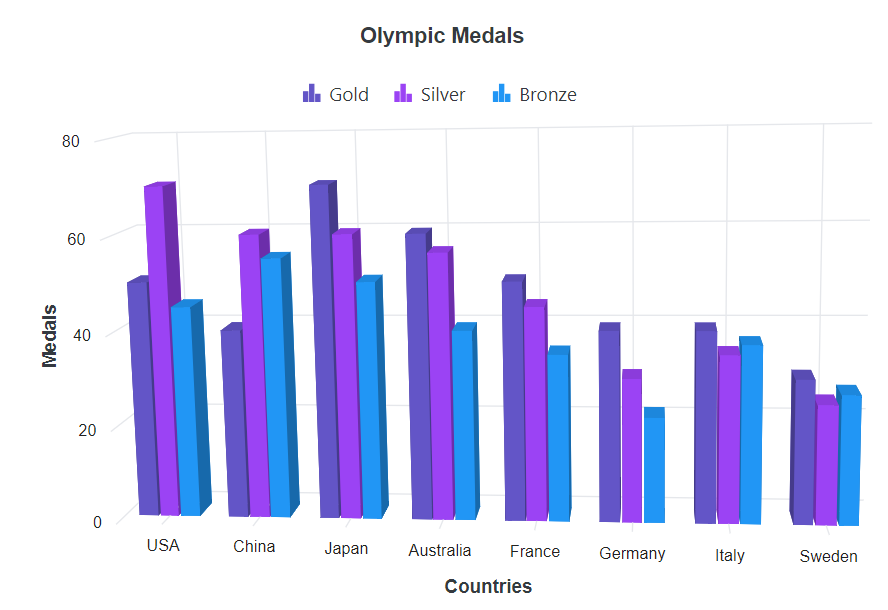
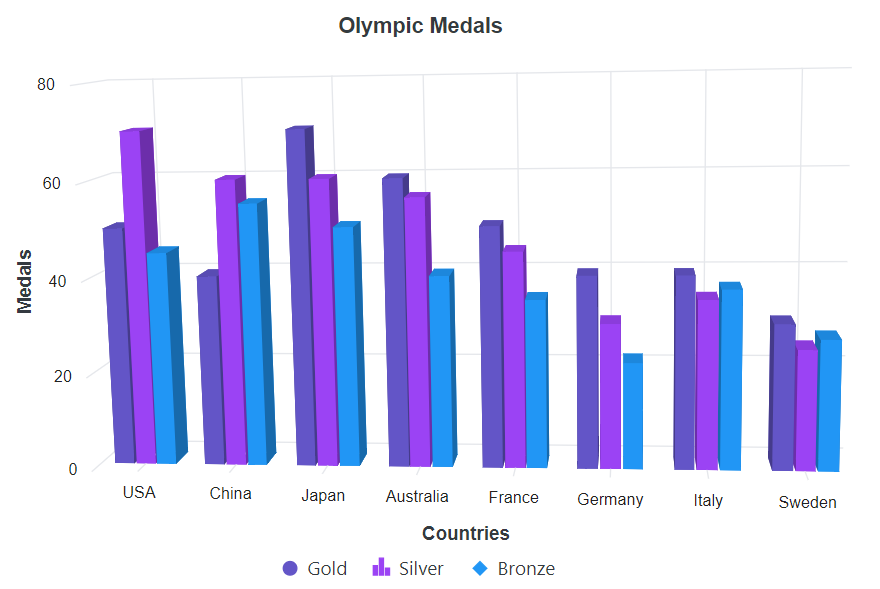
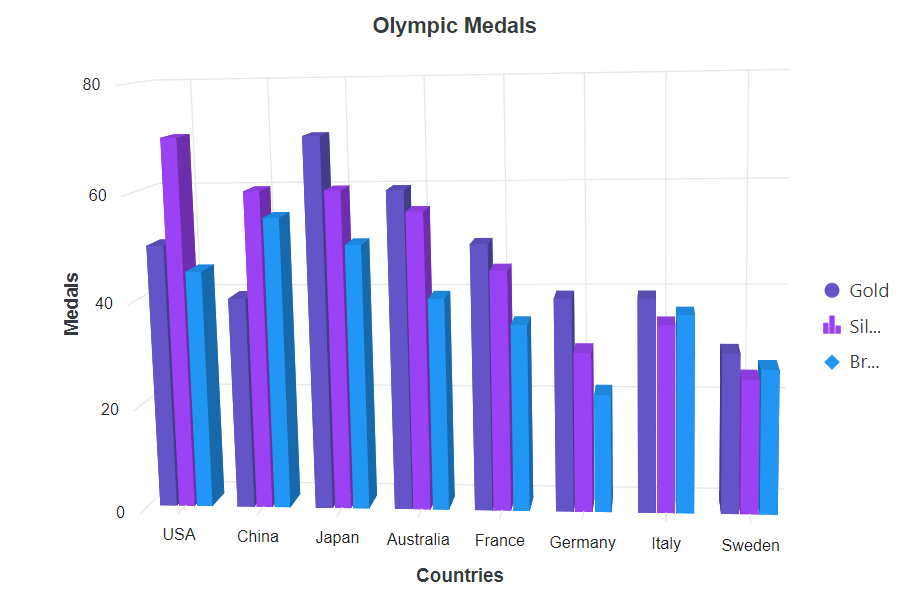
Position and alignment
By using the Position property, the legend can be positioned at left, right, top or bottom of the 3D chart. The legend is positioned at the bottom of the 3D chart, by default.
@using Syncfusion.Blazor.Chart3D

<SfChart3D Title="Olympic Medals" WallColor="transparent" EnableRotation="true" RotationAngle="7" TiltAngle="10" Depth="100">
    <Chart3DPrimaryXAxis ValueType="Syncfusion.Blazor.Chart3D.ValueType.Category" Title="Countries"/>
    <Chart3DPrimaryYAxis Title="Medals" Minimum="0" Maximum="80" Interval="20"></Chart3DPrimaryYAxis>

    <Chart3DSeriesCollection>
        <Chart3DSeries DataSource="@MedalDetails" Name="Gold" XName="Country" Opacity="1" YName="Gold" Type="Chart3DSeriesType.Column"/>
        <Chart3DSeries DataSource="@MedalDetails" Name="Silver" XName="Country" Opacity="1" YName="Silver" Type="Chart3DSeriesType.Column"/>
        <Chart3DSeries DataSource="@MedalDetails" Name="Bronze" XName="Country" Opacity="1" YName="Bronze" Type="Chart3DSeriesType.Column"/>
    </Chart3DSeriesCollection>

    <Chart3DLegendSettings Visible="true" Position="Syncfusion.Blazor.Chart3D.LegendPosition.Top"/>
</SfChart3D>

@code{

    public class Chart3DData
    {
        public string Country { get; set; }
        public double Gold { get; set; }
        public double Silver { get; set; }
        public double Bronze { get; set; }
    }

    public List<Chart3DData> MedalDetails = new List<Chart3DData>
	{
		new Chart3DData { Country = "USA", Gold = 50, Silver = 70, Bronze = 45 },
        new Chart3DData { Country = "China", Gold = 40, Silver = 60, Bronze = 55 },
        new Chart3DData { Country = "Japan", Gold = 70, Silver = 60, Bronze = 50 },
        new Chart3DData { Country = "Australia", Gold = 60, Silver = 56, Bronze = 40 },
        new Chart3DData { Country = "France", Gold = 50, Silver = 45, Bronze = 35 },
        new Chart3DData { Country = "Germany", Gold = 40, Silver = 30, Bronze = 22 },
        new Chart3DData { Country = "Italy", Gold = 40, Silver = 35, Bronze = 37 },
        new Chart3DData { Country = "Sweden", Gold = 30, Silver = 25, Bronze = 27 }
	};
}
The custom position helps you to position the legend anywhere in the 3D chart using x and y coordinates.
@using Syncfusion.Blazor.Chart3D

<SfChart3D Title="Olympic Medals" WallColor="transparent" EnableRotation="true" RotationAngle="7" TiltAngle="10" Depth="100">
    <Chart3DPrimaryXAxis ValueType="Syncfusion.Blazor.Chart3D.ValueType.Category" Title="Countries"/>
    <Chart3DPrimaryYAxis Title="Medals" Minimum="0" Maximum="80" Interval="20"></Chart3DPrimaryYAxis>

    <Chart3DSeriesCollection>
        <Chart3DSeries DataSource="@MedalDetails" Name="Gold" XName="Country" Opacity="1" YName="Gold" Type="Chart3DSeriesType.Column"/>
        <Chart3DSeries DataSource="@MedalDetails" Name="Silver" XName="Country" Opacity="1" YName="Silver" Type="Chart3DSeriesType.Column"/>
        <Chart3DSeries DataSource="@MedalDetails" Name="Bronze" XName="Country" Opacity="1" YName="Bronze" Type="Chart3DSeriesType.Column"/>
    </Chart3DSeriesCollection>

    <Chart3DLegendSettings Visible="true" Position="Syncfusion.Blazor.Chart3D.LegendPosition.Custom">
        <Chart3DLocation X="200" Y="20"/>
    </Chart3DLegendSettings>
</SfChart3D>

@code{

    public class Chart3DData
    {
        public string Country { get; set; }
        public double Gold { get; set; }
        public double Silver { get; set; }
        public double Bronze { get; set; }
    }

    public List<Chart3DData> MedalDetails = new List<Chart3DData>
	{
		new Chart3DData { Country = "USA", Gold = 50, Silver = 70, Bronze = 45 },
        new Chart3DData { Country = "China", Gold = 40, Silver = 60, Bronze = 55 },
        new Chart3DData { Country = "Japan", Gold = 70, Silver = 60, Bronze = 50 },
        new Chart3DData { Country = "Australia", Gold = 60, Silver = 56, Bronze = 40 },
        new Chart3DData { Country = "France", Gold = 50, Silver = 45, Bronze = 35 },
        new Chart3DData { Country = "Germany", Gold = 40, Silver = 30, Bronze = 22 },
        new Chart3DData { Country = "Italy", Gold = 40, Silver = 35, Bronze = 37 },
        new Chart3DData { Country = "Sweden", Gold = 30, Silver = 25, Bronze = 27 }
	};
}
Legend reverse
The order of the legend items can be reversed by using the Reverse property. By default, legend for the first series in the collection will be placed first.
@using Syncfusion.Blazor.Chart3D

<SfChart3D Title="Olympic Medals" WallColor="transparent" EnableRotation="true" RotationAngle="7" TiltAngle="10" Depth="100">
    <Chart3DPrimaryXAxis ValueType="Syncfusion.Blazor.Chart3D.ValueType.Category" Title="Countries"/>
    <Chart3DPrimaryYAxis Title="Medals" Minimum="0" Maximum="80" Interval="20"></Chart3DPrimaryYAxis>

    <Chart3DSeriesCollection>
        <Chart3DSeries DataSource="@MedalDetails" Name="Gold" XName="Country" Opacity="1" YName="Gold" Type="Chart3DSeriesType.Column"/>
        <Chart3DSeries DataSource="@MedalDetails" Name="Silver" XName="Country" Opacity="1" YName="Silver" Type="Chart3DSeriesType.Column"/>
        <Chart3DSeries DataSource="@MedalDetails" Name="Bronze" XName="Country" Opacity="1" YName="Bronze" Type="Chart3DSeriesType.Column"/>
    </Chart3DSeriesCollection>

    <Chart3DLegendSettings Visible="true" Reverse="true"></Chart3DLegendSettings>
</SfChart3D>

@code{

    public class Chart3DData
    {
        public string Country { get; set; }
        public double Gold { get; set; }
        public double Silver { get; set; }
        public double Bronze { get; set; }
    }

    public List<Chart3DData> MedalDetails = new List<Chart3DData>
	{
		new Chart3DData { Country = "USA", Gold = 50, Silver = 70, Bronze = 45 },
        new Chart3DData { Country = "China", Gold = 40, Silver = 60, Bronze = 55 },
        new Chart3DData { Country = "Japan", Gold = 70, Silver = 60, Bronze = 50 },
        new Chart3DData { Country = "Australia", Gold = 60, Silver = 56, Bronze = 40 },
        new Chart3DData { Country = "France", Gold = 50, Silver = 45, Bronze = 35 },
        new Chart3DData { Country = "Germany", Gold = 40, Silver = 30, Bronze = 22 },
        new Chart3DData { Country = "Italy", Gold = 40, Silver = 35, Bronze = 37 },
        new Chart3DData { Country = "Sweden", Gold = 30, Silver = 25, Bronze = 27 }
	};
}
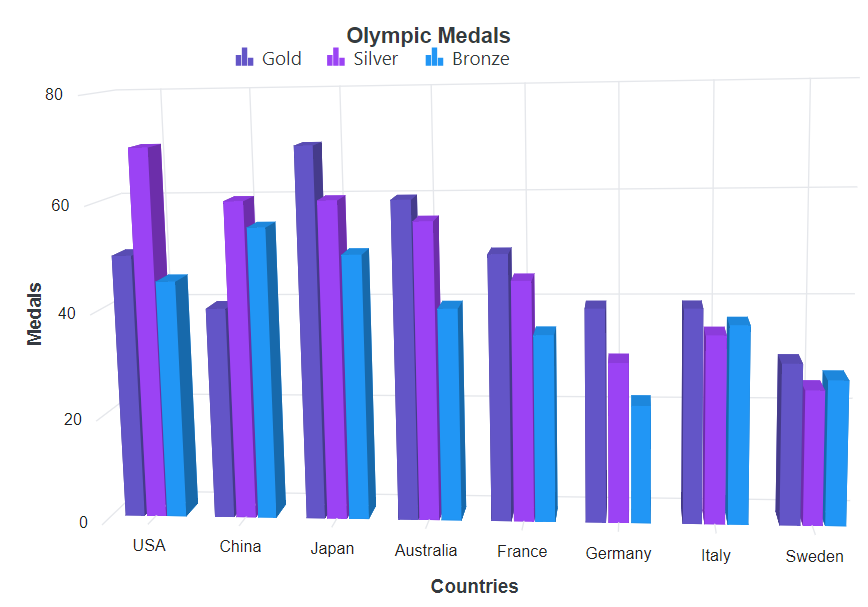
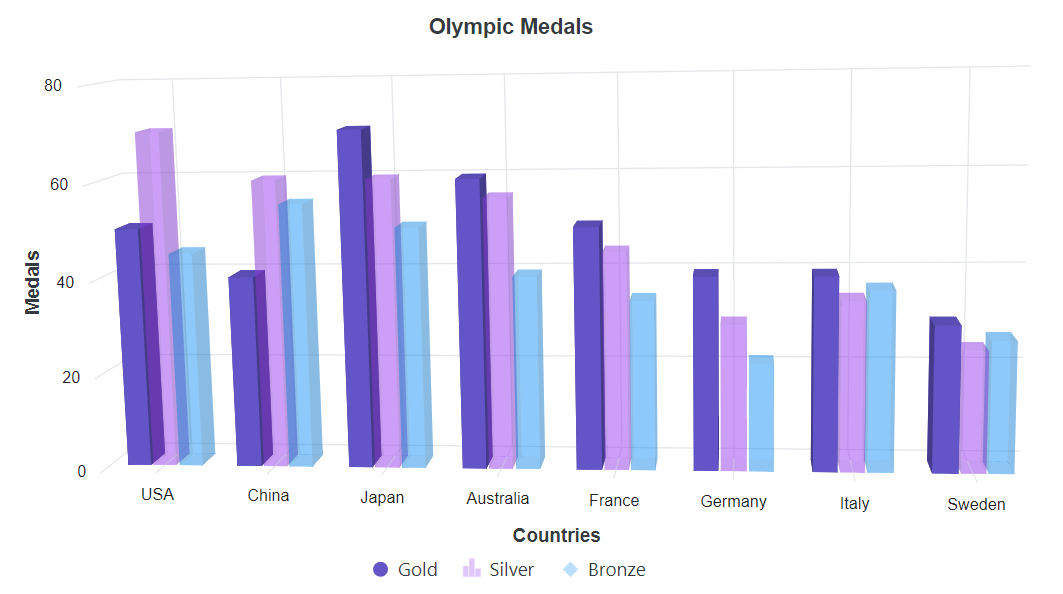
Legend alignment
The legend can be aligned at near, far or center to the 3D chart using the Alignment property.
@using Syncfusion.Blazor.Chart3D

<SfChart3D Title="Olympic Medals" WallColor="transparent" EnableRotation="true" RotationAngle="7" TiltAngle="10" Depth="100">
    <Chart3DPrimaryXAxis ValueType="Syncfusion.Blazor.Chart3D.ValueType.Category" Title="Countries"/>
    <Chart3DPrimaryYAxis Title="Medals" Minimum="0" Maximum="80" Interval="20"></Chart3DPrimaryYAxis>

    <Chart3DSeriesCollection>
        <Chart3DSeries DataSource="@MedalDetails" Name="Gold" XName="Country" Opacity="1" YName="Gold" Type="Chart3DSeriesType.Column"/>
        <Chart3DSeries DataSource="@MedalDetails" Name="Silver" XName="Country" Opacity="1" YName="Silver" Type="Chart3DSeriesType.Column"/>
        <Chart3DSeries DataSource="@MedalDetails" Name="Bronze" XName="Country" Opacity="1" YName="Bronze" Type="Chart3DSeriesType.Column"/>
    </Chart3DSeriesCollection>

    <Chart3DLegendSettings Visible="true" Alignment="Syncfusion.Blazor.Chart3D.Alignment.Far">
    </Chart3DLegendSettings>
</SfChart3D>

@code{

    public class Chart3DData
    {
        public string Country { get; set; }
        public double Gold { get; set; }
        public double Silver { get; set; }
        public double Bronze { get; set; }
    }

    public List<Chart3DData> MedalDetails = new List<Chart3DData>
	{
		new Chart3DData { Country = "USA", Gold = 50, Silver = 70, Bronze = 45 },
        new Chart3DData { Country = "China", Gold = 40, Silver = 60, Bronze = 55 },
        new Chart3DData { Country = "Japan", Gold = 70, Silver = 60, Bronze = 50 },
        new Chart3DData { Country = "Australia", Gold = 60, Silver = 56, Bronze = 40 },
        new Chart3DData { Country = "France", Gold = 50, Silver = 45, Bronze = 35 },
        new Chart3DData { Country = "Germany", Gold = 40, Silver = 30, Bronze = 22 },
        new Chart3DData { Country = "Italy", Gold = 40, Silver = 35, Bronze = 37 },
        new Chart3DData { Country = "Sweden", Gold = 30, Silver = 25, Bronze = 27 }
	};
}
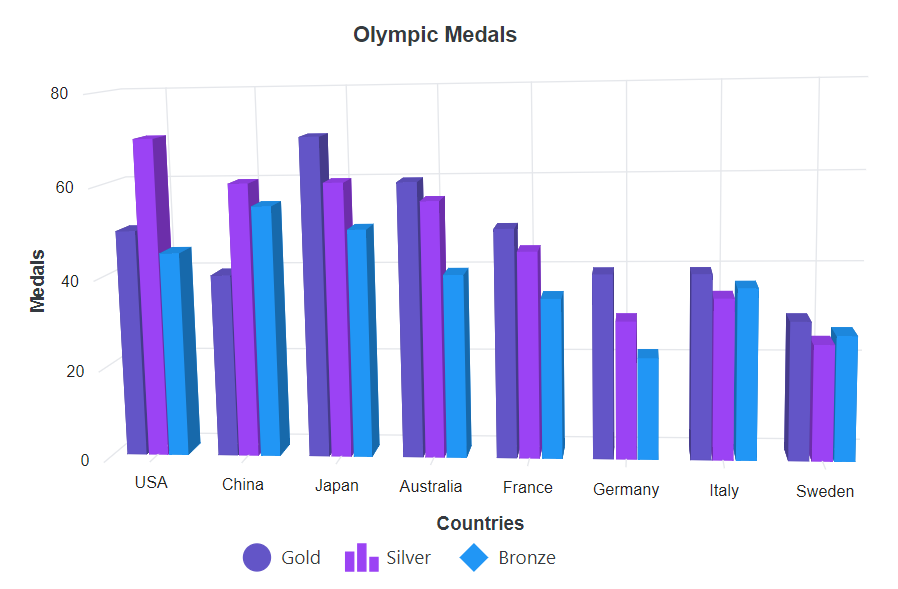
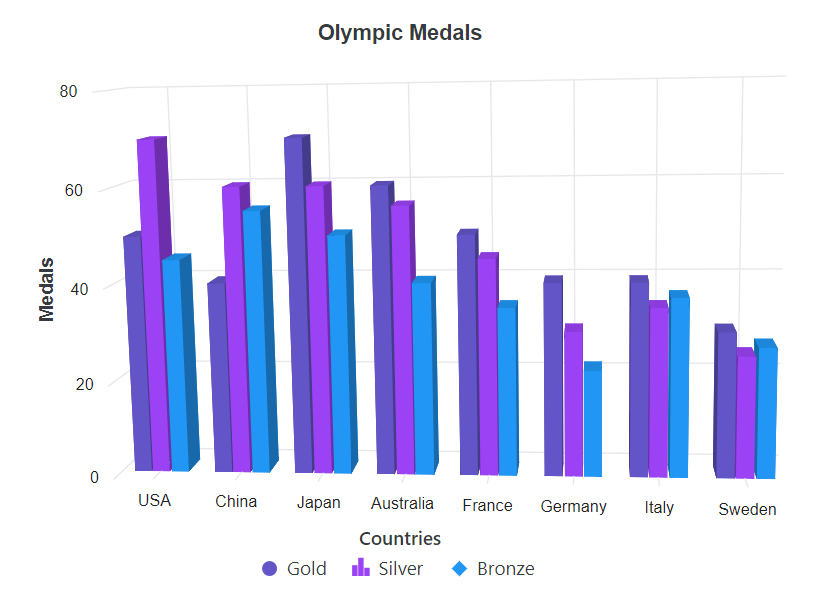
Legend customization
To change the legend icon shape, LegendShape property in the Series can be used. By default, the legend icon shape is SeriesType.
@using Syncfusion.Blazor.Chart3D

<SfChart3D Title="Olympic Medals" WallColor="transparent" EnableRotation="true" RotationAngle="7" TiltAngle="10" Depth="100">
    <Chart3DPrimaryXAxis ValueType="Syncfusion.Blazor.Chart3D.ValueType.Category" Title="Countries"/>
    <Chart3DPrimaryYAxis Title="Medals" Minimum="0" Maximum="80" Interval="20"></Chart3DPrimaryYAxis>

    <Chart3DSeriesCollection>
        <Chart3DSeries DataSource="@MedalDetails" Name="Gold" XName="Country" Opacity="1" YName="Gold" Type="Syncfusion.Blazor.Chart3D.Chart3DSeriesType.Column" LegendShape="LegendShape.Circle"/>
        <Chart3DSeries DataSource="@MedalDetails" Name="Silver" XName="Country" Opacity="1" YName="Silver" Type="Syncfusion.Blazor.Chart3D.Chart3DSeriesType.Column" LegendShape="LegendShape.SeriesType"/>
        <Chart3DSeries DataSource="@MedalDetails" Name="Bronze" XName="Country" Opacity="1" YName="Bronze" Type="Syncfusion.Blazor.Chart3D.Chart3DSeriesType.Column" LegendShape="LegendShape.Diamond"/>
    </Chart3DSeriesCollection>

    <Chart3DLegendSettings Visible="true"></Chart3DLegendSettings>
</SfChart3D>

@code{

    public class Chart3DData
    {
        public string Country { get; set; }
        public double Gold { get; set; }
        public double Silver { get; set; }
        public double Bronze { get; set; }
    }

    public List<Chart3DData> MedalDetails = new List<Chart3DData>
	{
		new Chart3DData { Country = "USA", Gold = 50, Silver = 70, Bronze = 45 },
        new Chart3DData { Country = "China", Gold = 40, Silver = 60, Bronze = 55 },
        new Chart3DData { Country = "Japan", Gold = 70, Silver = 60, Bronze = 50 },
        new Chart3DData { Country = "Australia", Gold = 60, Silver = 56, Bronze = 40 },
        new Chart3DData { Country = "France", Gold = 50, Silver = 45, Bronze = 35 },
        new Chart3DData { Country = "Germany", Gold = 40, Silver = 30, Bronze = 22 },
        new Chart3DData { Country = "Italy", Gold = 40, Silver = 35, Bronze = 37 },
        new Chart3DData { Country = "Sweden", Gold = 30, Silver = 25, Bronze = 27 }
	};
}
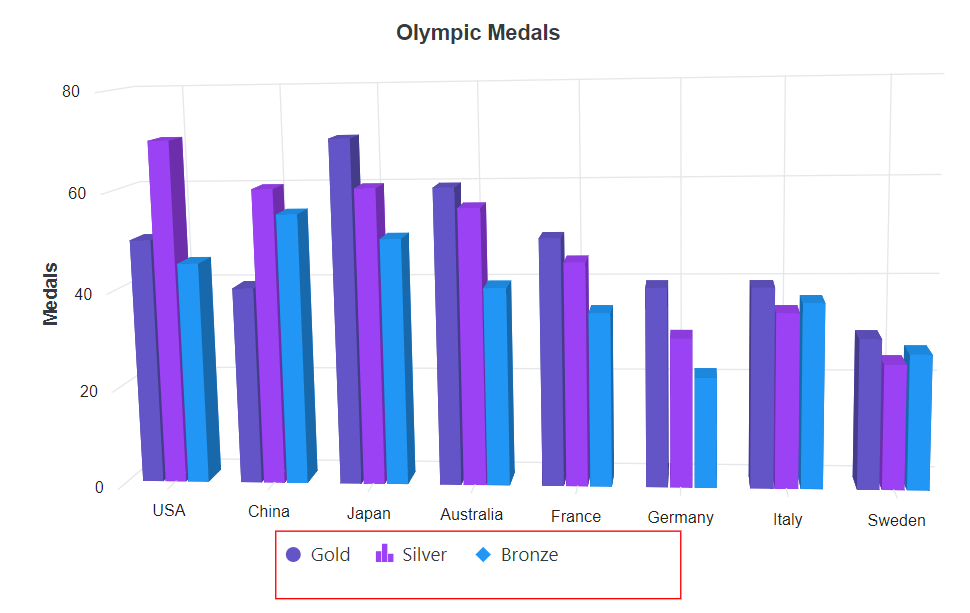
Legend size
By default, legend takes 20% - 25% of the 3D chart’s height horizontally, when it is placed on top or bottom position and 20% - 25% of the 3D chart’s width vertically, when it is placed on left or right position. You can change this default legend size by using the Height and Width properties of the LegendSettings.
@using Syncfusion.Blazor.Chart3D

<SfChart3D Title="Olympic Medals" WallColor="transparent" EnableRotation="true" RotationAngle="7" TiltAngle="10" Depth="100">
    <Chart3DPrimaryXAxis ValueType="Syncfusion.Blazor.Chart3D.ValueType.Category"/>
    <Chart3DPrimaryYAxis Title="Medals" Minimum="0" Maximum="80" Interval="20"></Chart3DPrimaryYAxis>

    <Chart3DSeriesCollection>
        <Chart3DSeries DataSource="@MedalDetails" Name="Gold" XName="Country" Opacity="1" YName="Gold" Type="Chart3DSeriesType.Column" LegendShape="Syncfusion.Blazor.Chart3D.LegendShape.Circle"/>
        <Chart3DSeries DataSource="@MedalDetails" Name="Silver" XName="Country" Opacity="1" YName="Silver" Type="Chart3DSeriesType.Column" LegendShape="Syncfusion.Blazor.Chart3D.LegendShape.SeriesType"/>
        <Chart3DSeries DataSource="@MedalDetails" Name="Bronze" XName="Country" Opacity="1" YName="Bronze" Type="Chart3DSeriesType.Column" LegendShape="Syncfusion.Blazor.Chart3D.LegendShape.Diamond"/>
    </Chart3DSeriesCollection>

    <Chart3DLegendSettings Visible="true" Height="50" Width="300">
        <Chart3DLegendBorder Color="red" Width="1"/>
    </Chart3DLegendSettings>
</SfChart3D>

@code{

    public class Chart3DData
    {
        public string Country { get; set; }
        public double Gold { get; set; }
        public double Silver { get; set; }
        public double Bronze { get; set; }
    }

    public List<Chart3DData> MedalDetails = new List<Chart3DData>
	{
		new Chart3DData { Country = "USA", Gold = 50, Silver = 70, Bronze = 45 },
        new Chart3DData { Country = "China", Gold = 40, Silver = 60, Bronze = 55 },
        new Chart3DData { Country = "Japan", Gold = 70, Silver = 60, Bronze = 50 },
        new Chart3DData { Country = "Australia", Gold = 60, Silver = 56, Bronze = 40 },
        new Chart3DData { Country = "France", Gold = 50, Silver = 45, Bronze = 35 },
        new Chart3DData { Country = "Germany", Gold = 40, Silver = 30, Bronze = 22 },
        new Chart3DData { Country = "Italy", Gold = 40, Silver = 35, Bronze = 37 },
        new Chart3DData { Country = "Sweden", Gold = 30, Silver = 25, Bronze = 27 }
	};
}
Legend item Size
The size of the legend items can be customized by using the ShapeHeight and ShapeWidth properties.
@using Syncfusion.Blazor.Chart3D

<SfChart3D Title="Olympic Medals" WallColor="transparent" EnableRotation="true" RotationAngle="7" TiltAngle="10" Depth="100">
    <Chart3DPrimaryXAxis ValueType="Syncfusion.Blazor.Chart3D.ValueType.Category" Title="Countries"/>
    <Chart3DPrimaryYAxis Title="Medals" Minimum="0" Maximum="80" Interval="20"></Chart3DPrimaryYAxis>

    <Chart3DSeriesCollection>
        <Chart3DSeries DataSource="@MedalDetails" Name="Gold" XName="Country" Opacity="1" YName="Gold" Type="Chart3DSeriesType.Column" LegendShape="Syncfusion.Blazor.Chart3D.LegendShape.Circle"/>
        <Chart3DSeries DataSource="@MedalDetails" Name="Silver" XName="Country" Opacity="1" YName="Silver" Type="Chart3DSeriesType.Column" LegendShape="Syncfusion.Blazor.Chart3D.LegendShape.SeriesType"/>
        <Chart3DSeries DataSource="@MedalDetails" Name="Bronze" XName="Country" Opacity="1" YName="Bronze" Type="Chart3DSeriesType.Column" LegendShape="Syncfusion.Blazor.Chart3D.LegendShape.Diamond"/>
    </Chart3DSeriesCollection>

    <Chart3DLegendSettings Visible="true" Height="50" Width="300" ShapeHeight="20" ShapeWidth="20">
    </Chart3DLegendSettings>
</SfChart3D>

@code{

    public class Chart3DData
    {
        public string Country { get; set; }
        public double Gold { get; set; }
        public double Silver { get; set; }
        public double Bronze { get; set; }
    }

    public List<Chart3DData> MedalDetails = new List<Chart3DData>
	{
		new Chart3DData { Country = "USA", Gold = 50, Silver = 70, Bronze = 45 },
        new Chart3DData { Country = "China", Gold = 40, Silver = 60, Bronze = 55 },
        new Chart3DData { Country = "Japan", Gold = 70, Silver = 60, Bronze = 50 },
        new Chart3DData { Country = "Australia", Gold = 60, Silver = 56, Bronze = 40 },
        new Chart3DData { Country = "France", Gold = 50, Silver = 45, Bronze = 35 },
        new Chart3DData { Country = "Germany", Gold = 40, Silver = 30, Bronze = 22 },
        new Chart3DData { Country = "Italy", Gold = 40, Silver = 35, Bronze = 37 },
        new Chart3DData { Country = "Sweden", Gold = 30, Silver = 25, Bronze = 27 }
	};
}
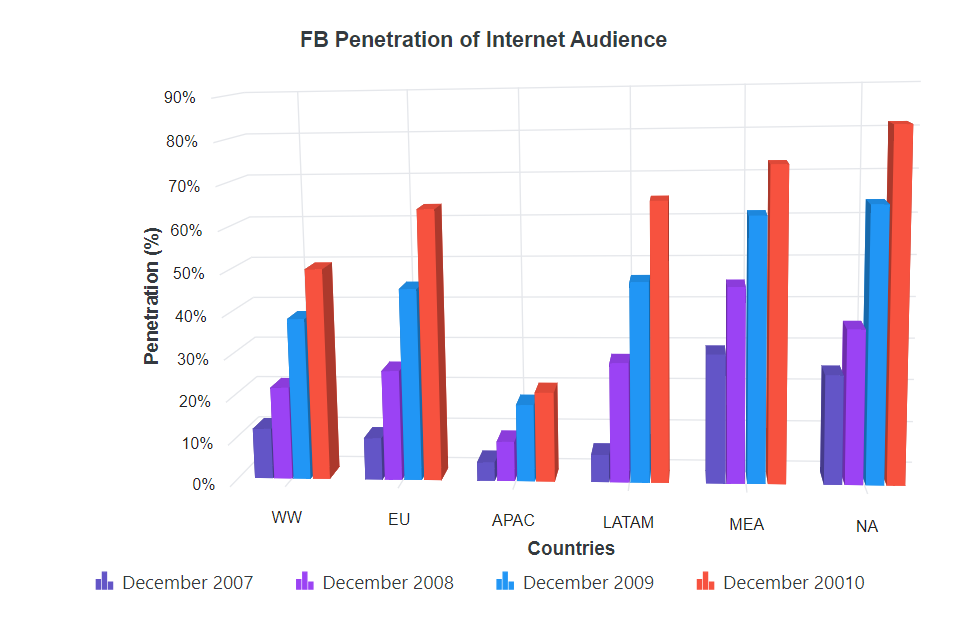
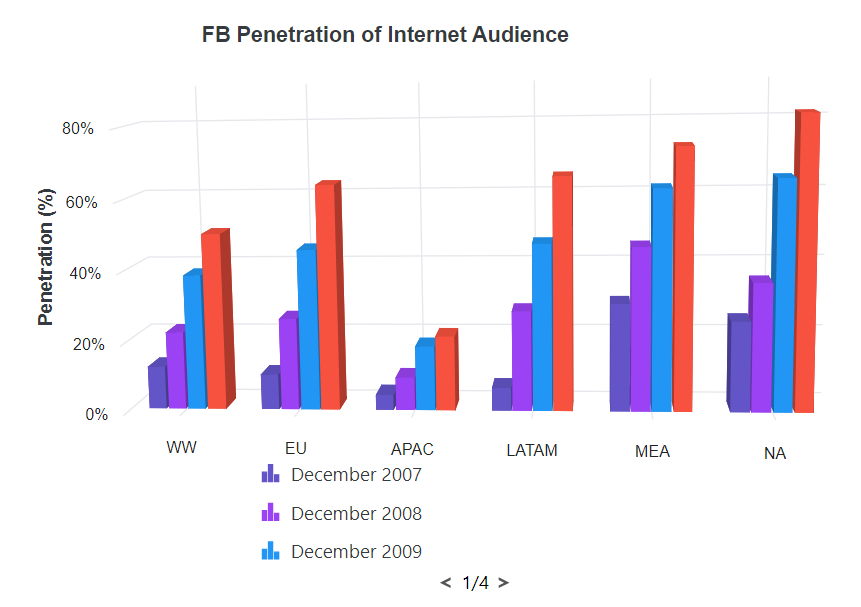
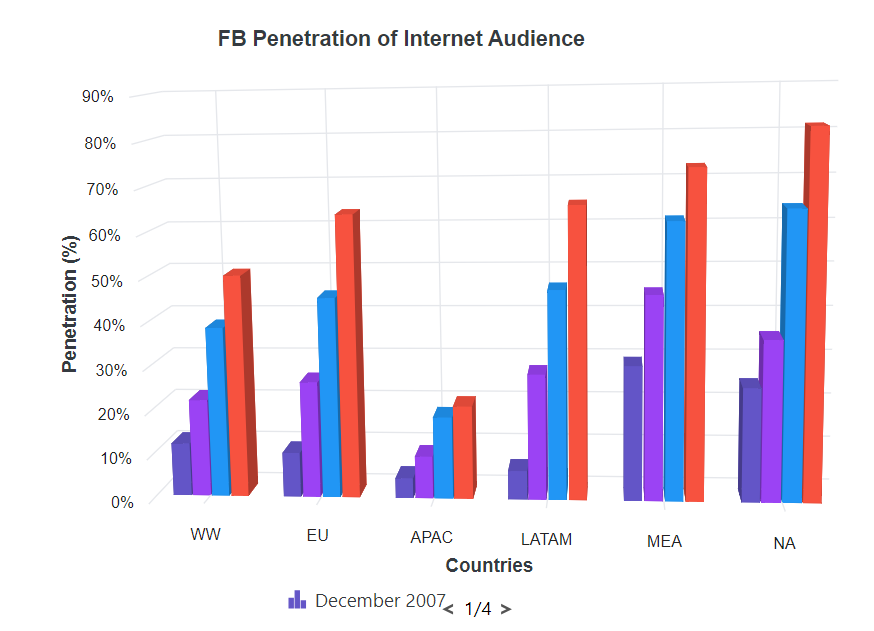
Paging for legend
Paging will be enabled by default, when the legend items exceeds the legend bounds. Each legend items can be viewed by navigating between the pages using navigation buttons.
@using Syncfusion.Blazor.Chart3D

<SfChart3D Title="FB Penetration of Internet Audience" WallColor="transparent" EnableRotation="true" RotationAngle="7" TiltAngle="10" Depth="100">
    <Chart3DPrimaryXAxis ValueType="Syncfusion.Blazor.Chart3D.ValueType.Category" Interval="1" LabelIntersectAction="Syncfusion.Blazor.Chart3D.LabelIntersectAction.Rotate45"/>
    <Chart3DPrimaryYAxis Title="Penetration (%)" LabelFormat="{value}%" Minimum="0" Maximum="90"></Chart3DPrimaryYAxis>

    <Chart3DSeriesCollection>
        <Chart3DSeries DataSource="@InternetDetails" Name="December 2007" XName="X" YName="Y" />
        <Chart3DSeries DataSource="@InternetDetails" Name="December 2008" XName="X" YName="Y1" />
        <Chart3DSeries DataSource="@InternetDetails" Name="December 2009" XName="X" YName="Y2" />
        <Chart3DSeries DataSource="@InternetDetails" Name="December 20010" XName="X" YName="Y3" />
    </Chart3DSeriesCollection>

    <Chart3DLegendSettings Visible="true" Padding="10" ShapePadding="10" Width="200">
    </Chart3DLegendSettings>
</SfChart3D>

@code {

    public class Chart3DData
    {
        public string X { get; set; }
        public double Y { get; set; }
        public double Y1 { get; set; }
        public double Y2 { get; set; }
        public double Y3 { get; set; }
    }

    public List<Chart3DData> InternetDetails = new List<Chart3DData>
    {
        new Chart3DData { X = "WW", Y = 12, Y1 = 22, Y2 = 38.3, Y3 = 50 },
        new Chart3DData { X = "EU", Y = 9.9, Y1 = 26, Y2 = 45.2, Y3 = 63.6 },
        new Chart3DData { X = "APAC", Y = 4.4, Y1 = 9.3, Y2 = 18.2, Y3 = 20.9 },
        new Chart3DData { X = "LATAM", Y = 6.4, Y1 = 28, Y2 = 46.7, Y3 = 65.1 },
        new Chart3DData { X = "MEA", Y = 30, Y1 = 45.7, Y2 = 61.5, Y3 = 73 },
        new Chart3DData { X = "NA", Y = 25.3, Y1 = 35.9, Y2 = 64, Y3 = 81.4 }
    };
}
Legend text wrap
When the legend text exceeds the container, the text can be wrapped by using the TextWrap property. End user can also wrap the legend text based on the MaximumLabelWidth property.
@using Syncfusion.Blazor.Chart3D

<SfChart3D Title="Olympic Medals" WallColor="transparent" EnableRotation="true" RotationAngle="7" TiltAngle="10" Depth="100">
    <Chart3DPrimaryXAxis ValueType="Syncfusion.Blazor.Chart3D.ValueType.Category" Title="Countries"/>
    <Chart3DPrimaryYAxis Title="Medals" Minimum="0" Maximum="80" Interval="20"></Chart3DPrimaryYAxis>

    <Chart3DSeriesCollection>
        <Chart3DSeries DataSource="@MedalDetails" Name="Gold" XName="Country" Opacity="1" YName="Gold" Type="Chart3DSeriesType.Column" LegendShape="Syncfusion.Blazor.Chart3D.LegendShape.Circle"/>
        <Chart3DSeries DataSource="@MedalDetails" Name="Silver" XName="Country" Opacity="1" YName="Silver" Type="Chart3DSeriesType.Column" LegendShape="Syncfusion.Blazor.Chart3D.LegendShape.SeriesType"/>
        <Chart3DSeries DataSource="@MedalDetails" Name="Bronze" XName="Country" Opacity="1" YName="Bronze" Type="Chart3DSeriesType.Column" LegendShape="Syncfusion.Blazor.Chart3D.LegendShape.Diamond"/>
    </Chart3DSeriesCollection>

    <Chart3DLegendSettings Visible="true" Position="Syncfusion.Blazor.Chart3D.LegendPosition.Right" TextWrap="@Syncfusion.Blazor.TextWrap.Wrap" MaximumLabelWidth="20">
    </Chart3DLegendSettings>
</SfChart3D>

@code{

    public class Chart3DData
    {
        public string Country { get; set; }
        public double Gold { get; set; }
        public double Silver { get; set; }
        public double Bronze { get; set; }
    }

    public List<Chart3DData> MedalDetails = new List<Chart3DData>
	{
		new Chart3DData { Country = "USA", Gold = 50, Silver = 70, Bronze = 45 },
        new Chart3DData { Country = "China", Gold = 40, Silver = 60, Bronze = 55 },
        new Chart3DData { Country = "Japan", Gold = 70, Silver = 60, Bronze = 50 },
        new Chart3DData { Country = "Australia", Gold = 60, Silver = 56, Bronze = 40 },
        new Chart3DData { Country = "France", Gold = 50, Silver = 45, Bronze = 35 },
        new Chart3DData { Country = "Germany", Gold = 40, Silver = 30, Bronze = 22 },
        new Chart3DData { Country = "Italy", Gold = 40, Silver = 35, Bronze = 37 },
        new Chart3DData { Country = "Sweden", Gold = 30, Silver = 25, Bronze = 27 }
	};
}
Series selection through legend
By default, you can collapse the series visibility by clicking the legend. On the other hand, turn off the ToggleVisibility property if you must use a legend click to choose a series.
@using Syncfusion.Blazor.Chart3D

<SfChart3D Title="Olympic Medals" WallColor="transparent" EnableRotation="true" RotationAngle="7" TiltAngle="10" Depth="100" SelectionMode="Syncfusion.Blazor.Chart3D.SelectionMode.Series">
    <Chart3DPrimaryXAxis ValueType="Syncfusion.Blazor.Chart3D.ValueType.Category" Title="Countries"/>
    <Chart3DPrimaryYAxis Title="Medals" Minimum="0" Maximum="80" Interval="20"></Chart3DPrimaryYAxis>

    <Chart3DSeriesCollection>
        <Chart3DSeries DataSource="@MedalDetails" Name="Gold" XName="Country" Opacity="1" YName="Gold" Type="Chart3DSeriesType.Column" LegendShape="Syncfusion.Blazor.Chart3D.LegendShape.Circle"/>
        <Chart3DSeries DataSource="@MedalDetails" Name="Silver" XName="Country" Opacity="1" YName="Silver" Type="Chart3DSeriesType.Column" LegendShape="Syncfusion.Blazor.Chart3D.LegendShape.SeriesType"/>
        <Chart3DSeries DataSource="@MedalDetails" Name="Bronze" XName="Country" Opacity="1" YName="Bronze" Type="Chart3DSeriesType.Column" LegendShape="Syncfusion.Blazor.Chart3D.LegendShape.Diamond"/>
    </Chart3DSeriesCollection>

    <Chart3DLegendSettings Visible="true" ToggleVisibility="false">
    </Chart3DLegendSettings>
</SfChart3D>

@code{

    public class Chart3DData
    {
        public string Country { get; set; }
        public double Gold { get; set; }
        public double Silver { get; set; }
        public double Bronze { get; set; }
    }

    public List<Chart3DData> MedalDetails = new List<Chart3DData>
	{
		new Chart3DData { Country = "USA", Gold = 50, Silver = 70, Bronze = 45 },
        new Chart3DData { Country = "China", Gold = 40, Silver = 60, Bronze = 55 },
        new Chart3DData { Country = "Japan", Gold = 70, Silver = 60, Bronze = 50 },
        new Chart3DData { Country = "Australia", Gold = 60, Silver = 56, Bronze = 40 },
        new Chart3DData { Country = "France", Gold = 50, Silver = 45, Bronze = 35 },
        new Chart3DData { Country = "Germany", Gold = 40, Silver = 30, Bronze = 22 },
        new Chart3DData { Country = "Italy", Gold = 40, Silver = 35, Bronze = 37 },
        new Chart3DData { Country = "Sweden", Gold = 30, Silver = 25, Bronze = 27 }
	};
}
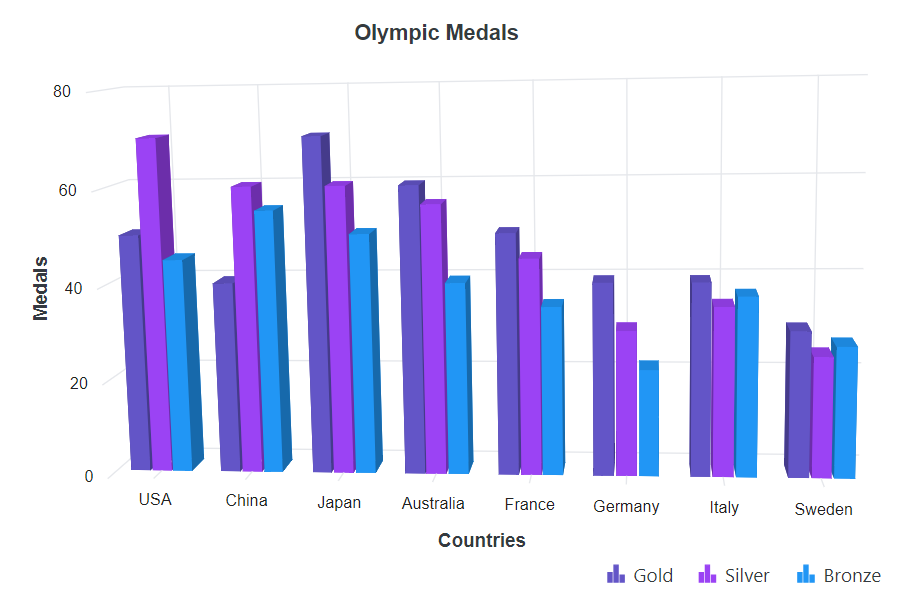
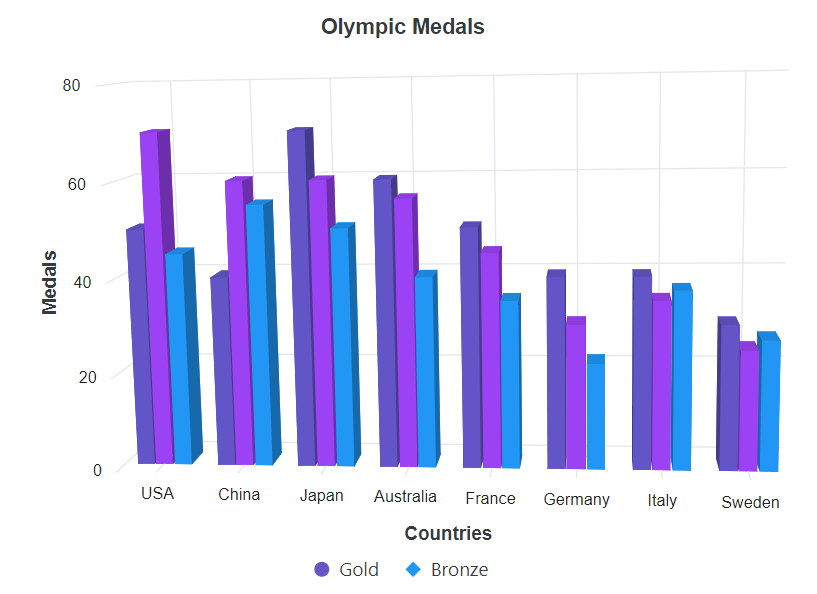
Collapsing legend item
By default, series Name will be displayed as legend. To skip the legend for a particular series, you can give empty string to the series Name.
@using Syncfusion.Blazor.Chart3D

<SfChart3D Title="Olympic Medals" WallColor="transparent" EnableRotation="true" RotationAngle="7" TiltAngle="10" Depth="100">
    <Chart3DPrimaryXAxis ValueType="Syncfusion.Blazor.Chart3D.ValueType.Category" Title="Countries"/>
    <Chart3DPrimaryYAxis Title="Medals" Minimum="0" Maximum="80" Interval="20"></Chart3DPrimaryYAxis>

    <Chart3DSeriesCollection>
        <Chart3DSeries DataSource="@MedalDetails" Name="Gold" XName="Country" LegendShape="Syncfusion.Blazor.Chart3D.LegendShape.Circle" Opacity="1" YName="Gold" Type="Syncfusion.Blazor.Chart3D.Chart3DSeriesType.Column"></Chart3DSeries>
        <Chart3DSeries DataSource="@MedalDetails" Name="" XName="Country" LegendShape="Syncfusion.Blazor.Chart3D.LegendShape.SeriesType" Opacity="1" YName="Silver" Type="Syncfusion.Blazor.Chart3D.Chart3DSeriesType.Column"></Chart3DSeries>
        <Chart3DSeries DataSource="@MedalDetails" Name="Bronze" XName="Country" LegendShape="Syncfusion.Blazor.Chart3D.LegendShape.Diamond" Opacity="1" YName="Bronze" Type="Syncfusion.Blazor.Chart3D.Chart3DSeriesType.Column"></Chart3DSeries>
    </Chart3DSeriesCollection>

    <Chart3DLegendSettings Visible="true" ToggleVisibility="true">
    </Chart3DLegendSettings>
</SfChart3D>
@code{

    public class Chart3DData
    {
        public string Country { get; set; }
        public double Gold { get; set; }
        public double Silver { get; set; }
        public double Bronze { get; set; }
    }

    public List<Chart3DData> MedalDetails = new List<Chart3DData>
	{
		new Chart3DData { Country = "USA", Gold = 50, Silver = 70, Bronze = 45 },
        new Chart3DData { Country = "China", Gold = 40, Silver = 60, Bronze = 55 },
        new Chart3DData { Country = "Japan", Gold = 70, Silver = 60, Bronze = 50 },
        new Chart3DData { Country = "Australia", Gold = 60, Silver = 56, Bronze = 40 },
        new Chart3DData { Country = "France", Gold = 50, Silver = 45, Bronze = 35 },
        new Chart3DData { Country = "Germany", Gold = 40, Silver = 30, Bronze = 22 },
        new Chart3DData { Country = "Italy", Gold = 40, Silver = 35, Bronze = 37 },
        new Chart3DData { Country = "Sweden", Gold = 30, Silver = 25, Bronze = 27 }
	};
}
Legend title
You can set title for legend using Title property in LegendSettings. The Size, Color, Opacity,FontStyle, FontWeight, FontFamily, TextAlignment, and TextOverflow of legend title can be customized by using the TitleStyle property in LegendSettings. The TitlePosition is used to set the legend position in Top, Left and Right position. The MaximumTitleWidth is used to set the width of the legend title. By default, it will be 100px.
@using Syncfusion.Blazor.Chart3D

<SfChart3D Title="Olympic Medals" WallColor="transparent" EnableRotation="true" RotationAngle="7" TiltAngle="10" Depth="100">
    <Chart3DPrimaryXAxis ValueType="Syncfusion.Blazor.Chart3D.ValueType.Category"/>
    <Chart3DPrimaryYAxis Title="Medals" Minimum="0" Maximum="80" Interval="20"></Chart3DPrimaryYAxis>

    <Chart3DSeriesCollection>
        <Chart3DSeries DataSource="@MedalDetails" Name="Gold" XName="Country" Opacity="1" YName="Gold" Type="Chart3DSeriesType.Column" LegendShape="Syncfusion.Blazor.Chart3D.LegendShape.Circle"/>
        <Chart3DSeries DataSource="@MedalDetails" Name="Silver" XName="Country" Opacity="1" YName="Silver" Type="Chart3DSeriesType.Column" LegendShape="Syncfusion.Blazor.Chart3D.LegendShape.SeriesType"/>
        <Chart3DSeries DataSource="@MedalDetails" Name="Bronze" XName="Country" Opacity="1" YName="Bronze" Type="Chart3DSeriesType.Column" LegendShape="Syncfusion.Blazor.Chart3D.LegendShape.Diamond"/>
    </Chart3DSeriesCollection>

    <Chart3DLegendSettings Visible="true" Title="Countries"></Chart3DLegendSettings>
</SfChart3D>

@code{

    public class Chart3DData
    {
        public string Country { get; set; }
        public double Gold { get; set; }
        public double Silver { get; set; }
        public double Bronze { get; set; }
    }

    public List<Chart3DData> MedalDetails = new List<Chart3DData>
	{
		new Chart3DData { Country = "USA", Gold = 50, Silver = 70, Bronze = 45 },
        new Chart3DData { Country = "China", Gold = 40, Silver = 60, Bronze = 55 },
        new Chart3DData { Country = "Japan", Gold = 70, Silver = 60, Bronze = 50 },
        new Chart3DData { Country = "Australia", Gold = 60, Silver = 56, Bronze = 40 },
        new Chart3DData { Country = "France", Gold = 50, Silver = 45, Bronze = 35 },
        new Chart3DData { Country = "Germany", Gold = 40, Silver = 30, Bronze = 22 },
        new Chart3DData { Country = "Italy", Gold = 40, Silver = 35, Bronze = 37 },
        new Chart3DData { Country = "Sweden", Gold = 30, Silver = 25, Bronze = 27 }
	};
}
Arrow page navigation
The page number will always be visible while using legend paging. It is now possible to disable the page number and enable page navigation with the left and right arrows. The AllowPaging property needs to be set to false in order to render the arrow page navigation.
@using Syncfusion.Blazor.Chart3D

<SfChart3D Title="FB Penetration of Internet Audience" WallColor="transparent" EnableRotation="true" RotationAngle="7" TiltAngle="10" Depth="100">
    <Chart3DPrimaryXAxis ValueType="Syncfusion.Blazor.Chart3D.ValueType.Category" Title="Countries" Interval="1" LabelIntersectAction="Syncfusion.Blazor.Chart3D.LabelIntersectAction.Rotate45"/>
    <Chart3DPrimaryYAxis Title="Penetration (%)" LabelFormat="{value}%" Minimum="0" Maximum="90"></Chart3DPrimaryYAxis>

    <Chart3DSeriesCollection>
        <Chart3DSeries DataSource="@InternetDetails" Name="December 2007" XName="X" YName="Y" />
        <Chart3DSeries DataSource="@InternetDetails" Name="December 2008" XName="X" YName="Y1" />
        <Chart3DSeries DataSource="@InternetDetails" Name="December 2009" XName="X" YName="Y2" />
        <Chart3DSeries DataSource="@InternetDetails" Name="December 20010" XName="X" YName="Y3" />
    </Chart3DSeriesCollection>

    <Chart3DLegendSettings Visible="true" Width="180" Height="20" AllowPaging="true">
    </Chart3DLegendSettings>
</SfChart3D>

@code {

    public class Chart3DData
    {
        public string X { get; set; }
        public double Y { get; set; }
        public double Y1 { get; set; }
        public double Y2 { get; set; }
        public double Y3 { get; set; }
    }

    public List<Chart3DData> InternetDetails = new List<Chart3DData>
    {
        new Chart3DData { X = "WW", Y = 12, Y1 = 22, Y2 = 38.3, Y3 = 50 },
        new Chart3DData { X = "EU", Y = 9.9, Y1 = 26, Y2 = 45.2, Y3 = 63.6 },
        new Chart3DData { X = "APAC", Y = 4.4, Y1 = 9.3, Y2 = 18.2, Y3 = 20.9 },
        new Chart3DData { X = "LATAM", Y = 6.4, Y1 = 28, Y2 = 46.7, Y3 = 65.1 },
        new Chart3DData { X = "MEA", Y = 30, Y1 = 45.7, Y2 = 61.5, Y3 = 73 },
        new Chart3DData { X = "NA", Y = 25.3, Y1 = 35.9, Y2 = 64, Y3 = 81.4 }
    };
}
Legend Item Padding
The ItemPadding property can be used to adjust the space between the legend items.
@using Syncfusion.Blazor.Chart3D

<SfChart3D Title="FB Penetration of Internet Audience" WallColor="transparent" EnableRotation="true" RotationAngle="7" TiltAngle="10" Depth="100">
    <Chart3DPrimaryXAxis ValueType="Syncfusion.Blazor.Chart3D.ValueType.Category" Title="Countries" Interval="1" LabelIntersectAction="Syncfusion.Blazor.Chart3D.LabelIntersectAction.Rotate45"/>
    <Chart3DPrimaryYAxis Title="Penetration (%)" LabelFormat="{value}%" Minimum="0" Maximum="90"></Chart3DPrimaryYAxis>

    <Chart3DSeriesCollection>
        <Chart3DSeries DataSource="@InternetDetails" Name="December 2007" XName="X" YName="Y" />
        <Chart3DSeries DataSource="@InternetDetails" Name="December 2008" XName="X" YName="Y1" />
        <Chart3DSeries DataSource="@InternetDetails" Name="December 2009" XName="X" YName="Y2" />
        <Chart3DSeries DataSource="@InternetDetails" Name="December 20010" XName="X" YName="Y3" />
    </Chart3DSeriesCollection>

    <Chart3DLegendSettings Visible="true" ItemPadding="30" AllowPaging="false">
    </Chart3DLegendSettings>
</SfChart3D>

@code {

    public class Chart3DData
    {
        public string X { get; set; }
        public double Y { get; set; }
        public double Y1 { get; set; }
        public double Y2 { get; set; }
        public double Y3 { get; set; }
    }

    public List<Chart3DData> InternetDetails = new List<Chart3DData>
    {
        new Chart3DData { X = "WW", Y = 12, Y1 = 22, Y2 = 38.3, Y3 = 50 },
        new Chart3DData { X = "EU", Y = 9.9, Y1 = 26, Y2 = 45.2, Y3 = 63.6 },
        new Chart3DData { X = "APAC", Y = 4.4, Y1 = 9.3, Y2 = 18.2, Y3 = 20.9 },
        new Chart3DData { X = "LATAM", Y = 6.4, Y1 = 28, Y2 = 46.7, Y3 = 65.1 },
        new Chart3DData { X = "MEA", Y = 30, Y1 = 45.7, Y2 = 61.5, Y3 = 73 },
        new Chart3DData { X = "NA", Y = 25.3, Y1 = 35.9, Y2 = 64, Y3 = 81.4 }
    };
}