Multiple Panes in Blazor 3D Chart Component
10 Nov 20259 minutes to read
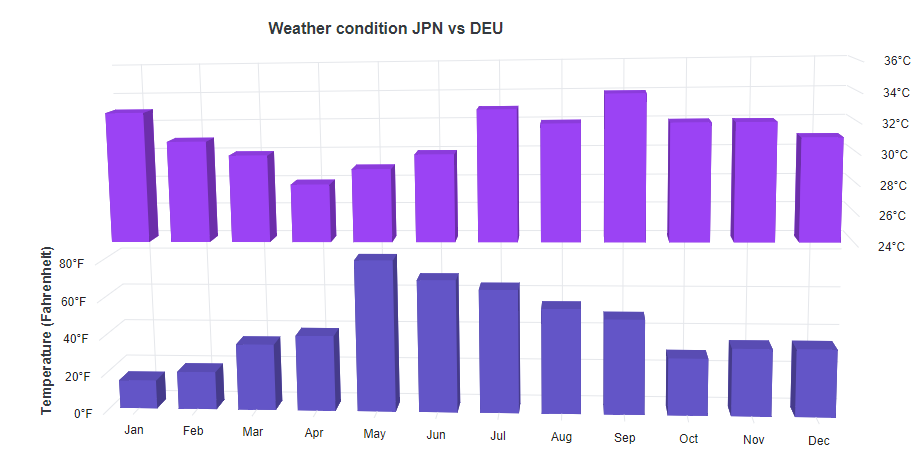
The chart area can be divided into multiple panes using Rows and Columns.
Rows
To split the chart area vertically into number of rows, use Rows property of the 3D chart.
- The space for each row can be allocated by using the
Heightproperty. The value can be either in percentage or in pixel. - To associate a vertical axis to a particular row, specify its index to
RowIndexproperty of the axis.
@using Syncfusion.Blazor.Chart3D

<SfChart3D Title="Weather condition JPN vs DEU" WallColor="transparent" EnableRotation="true" RotationAngle="7" TiltAngle="10" Depth="100">
    <Chart3DPrimaryXAxis ValueType="Syncfusion.Blazor.Chart3D.ValueType.Category"/>
    <Chart3DPrimaryYAxis Title="Temperature (Fahrenheit)" LabelFormat="{value}°F" Minimum="0" Maximum="90" Interval="20"/>
    <Chart3DRows>
        <Chart3DRow Height="50%"/>
        <Chart3DRow Height="50%"/>
    </Chart3DRows>
    <Chart3DAxes>
        <Chart3DAxis Minimum="24" Maximum="36" Interval="2" OpposedPosition="true" RowIndex="1" Name="YAxis" LabelFormat="{value}°C"/>
    </Chart3DAxes>
    <Chart3DSeriesCollection>
        <Chart3DSeries DataSource="@WeatherReports" XName="X" YName="Y" Type="Chart3DSeriesType.Column"/>
        <Chart3DSeries DataSource="@WeatherReports" XName="X" YName="Y1" YAxisName="YAxis"/>
    </Chart3DSeriesCollection>
</SfChart3D>

@code{
    public class Chart3DData
    {
        public string X { get; set; }
        public double Y { get; set; }
        public double Y1 { get; set; }
    }

	public List<Chart3DData> WeatherReports = new List<Chart3DData>
	{
		new Chart3DData { X = "Jan", Y = 15, Y1 = 33 },
		new Chart3DData { X = "Feb", Y = 20, Y1 = 31 },
		new Chart3DData { X = "Mar", Y = 35, Y1 = 30 },
		new Chart3DData { X = "Apr", Y = 40, Y1 = 28 },
		new Chart3DData { X = "May", Y = 80, Y1 = 29 },
		new Chart3DData { X = "Jun", Y = 70, Y1 = 30 },
		new Chart3DData { X = "Jul", Y = 65, Y1 = 33 },
		new Chart3DData { X = "Aug", Y = 55, Y1 = 32 },
		new Chart3DData { X = "Sep", Y = 50, Y1 = 34 },
		new Chart3DData { X = "Oct", Y = 30, Y1 = 32 },
		new Chart3DData { X = "Nov", Y = 35, Y1 = 32 },
		new Chart3DData { X = "Dec", Y = 35, Y1 = 31 }
	};
}
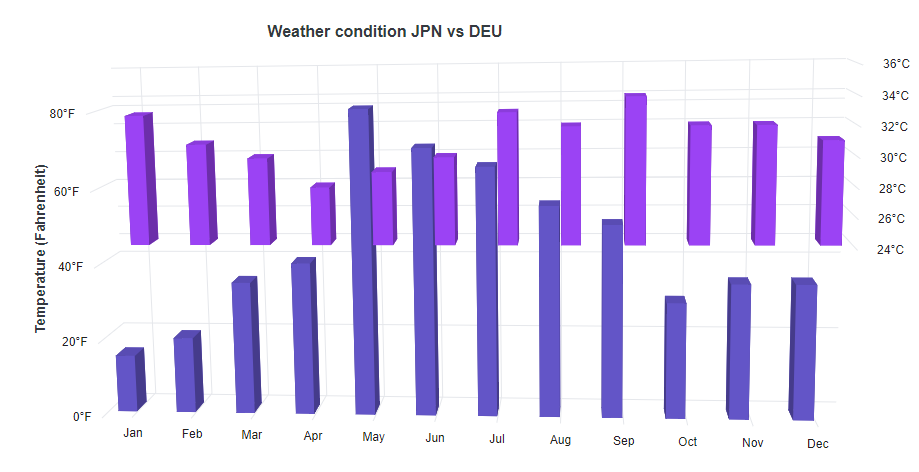
For spanning the vertical axis along multiple rows, use Span property of an axis.
@using Syncfusion.Blazor.Chart3D

<SfChart3D Title="Weather condition JPN vs DEU" WallColor="transparent" EnableRotation="true" RotationAngle="7" TiltAngle="10" Depth="100">
    <Chart3DPrimaryXAxis ValueType="Syncfusion.Blazor.Chart3D.ValueType.Category"/>
    <Chart3DPrimaryYAxis Span="2" Title="Temperature (Fahrenheit)" LabelFormat="{value}°F" Minimum="0" Maximum="90" Interval="20"/>    <Chart3DRows>
        <Chart3DRow Height="50%"/>
        <Chart3DRow Height="50%"/>
    </Chart3DRows>
    <Chart3DAxes>
        <Chart3DAxis Minimum="24" Maximum="36" Interval="2" OpposedPosition="true" RowIndex="1" Name="YAxis" LabelFormat="{value}°C"/>
    </Chart3DAxes>
    <Chart3DSeriesCollection>
        <Chart3DSeries DataSource="@WeatherReports" XName="X" YName="Y" Type="Chart3DSeriesType.Column"/>
        <Chart3DSeries DataSource="@WeatherReports" XName="X" YName="Y1" YAxisName="YAxis"/>
    </Chart3DSeriesCollection>
</SfChart3D>

@code{
    public class Chart3DData
    {
        public string X { get; set; }
        public double Y { get; set; }
        public double Y1 { get; set; }
    }

	public List<Chart3DData> WeatherReports = new List<Chart3DData>
	{
		new Chart3DData { X = "Jan", Y = 15, Y1 = 33 },
		new Chart3DData { X = "Feb", Y = 20, Y1 = 31 },
		new Chart3DData { X = "Mar", Y = 35, Y1 = 30 },
		new Chart3DData { X = "Apr", Y = 40, Y1 = 28 },
		new Chart3DData { X = "May", Y = 80, Y1 = 29 },
		new Chart3DData { X = "Jun", Y = 70, Y1 = 30 },
		new Chart3DData { X = "Jul", Y = 65, Y1 = 33 },
		new Chart3DData { X = "Aug", Y = 55, Y1 = 32 },
		new Chart3DData { X = "Sep", Y = 50, Y1 = 34 },
		new Chart3DData { X = "Oct", Y = 30, Y1 = 32 },
		new Chart3DData { X = "Nov", Y = 35, Y1 = 32 },
		new Chart3DData { X = "Dec", Y = 35, Y1 = 31 }
	};
}
Columns
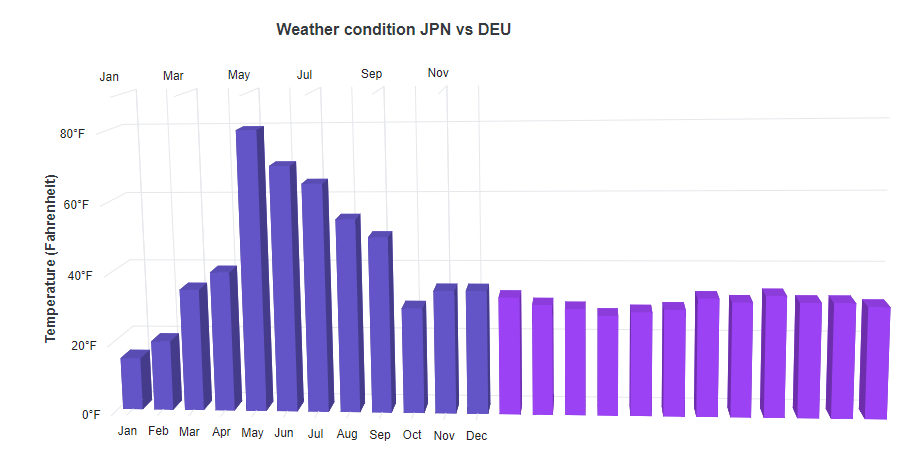
To split the chart area horizontally into number of columns, use Columns property of the 3D chart.
- The space for each column can be allocated by using the
Widthproperty. The given width can be either in percentage or in pixel. - To associate a horizontal axis to a particular column, specify its index to
ColumnIndexproperty of the axis.
@using Syncfusion.Blazor.Chart3D

<SfChart3D Title="Weather condition JPN vs DEU" WallColor="transparent" EnableRotation="true" RotationAngle="7" TiltAngle="10" Depth="100">
    <Chart3DPrimaryXAxis ValueType="Syncfusion.Blazor.Chart3D.ValueType.Category"/>
    <Chart3DPrimaryYAxis Title="Temperature (Fahrenheit)" LabelFormat="{value}°F" Minimum="0" Maximum="90" Interval="20"/>
    <Chart3DColumns>
        <Chart3DColumn Width="50%"/>
        <Chart3DColumn Width="50%"/>
    </Chart3DColumns>
    <Chart3DAxes>
        <Chart3DAxis Interval="2" OpposedPosition="true" ColumnIndex="1" Name="XAxis" ValueType="Syncfusion.Blazor.Chart3D.ValueType.Category"/>
    </Chart3DAxes>
    <Chart3DSeriesCollection>
        <Chart3DSeries DataSource="@WeatherReports" XName="X" YName="Y" Type="Chart3DSeriesType.Column"/>
        <Chart3DSeries DataSource="@WeatherReports" XName="X" YName="Y1" XAxisName="XAxis" />
    </Chart3DSeriesCollection>
</SfChart3D>

@code{
    public class Chart3DData
    {
        public string X { get; set; }
        public double Y { get; set; }
        public double Y1 { get; set; }
    }

	public List<Chart3DData> WeatherReports = new List<Chart3DData>
	{
		new Chart3DData { X = "Jan", Y = 15, Y1 = 33 },
		new Chart3DData { X = "Feb", Y = 20, Y1 = 31 },
		new Chart3DData { X = "Mar", Y = 35, Y1 = 30 },
		new Chart3DData { X = "Apr", Y = 40, Y1 = 28 },
		new Chart3DData { X = "May", Y = 80, Y1 = 29 },
		new Chart3DData { X = "Jun", Y = 70, Y1 = 30 },
		new Chart3DData { X = "Jul", Y = 65, Y1 = 33 },
		new Chart3DData { X = "Aug", Y = 55, Y1 = 32 },
		new Chart3DData { X = "Sep", Y = 50, Y1 = 34 },
		new Chart3DData { X = "Oct", Y = 30, Y1 = 32 },
		new Chart3DData { X = "Nov", Y = 35, Y1 = 32 },
		new Chart3DData { X = "Dec", Y = 35, Y1 = 31 }
	};
}
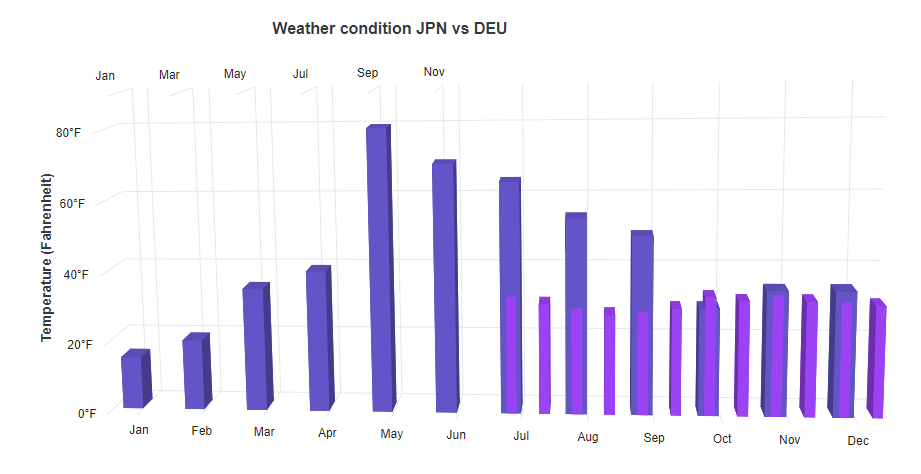
The Span property of the axis can be used to span the horizontal axis across multiple column.
@using Syncfusion.Blazor.Chart3D

<SfChart3D Title="Weather condition JPN vs DEU" WallColor="transparent" EnableRotation="true" RotationAngle="7" TiltAngle="10" Depth="100">
   <Chart3DPrimaryXAxis Span="2" ValueType="Syncfusion.Blazor.Chart3D.ValueType.Category"/>
   <Chart3DPrimaryYAxis Title="Temperature (Fahrenheit)" LabelFormat="{value}°F" Minimum="0" Maximum="90" Interval="20"/>
   <Chart3DColumns>
        <Chart3DColumn Width="50%"/>
        <Chart3DColumn Width="50%"/>
    </Chart3DColumns>
    <Chart3DAxes>
        <Chart3DAxis Interval="2" OpposedPosition="true" ColumnIndex="1" Name="XAxis" ValueType="Syncfusion.Blazor.Chart3D.ValueType.Category"/>
    </Chart3DAxes>
    <Chart3DSeriesCollection>
        <Chart3DSeries DataSource="@WeatherReports" XName="X" YName="Y" Type="Chart3DSeriesType.Column"/>
        <Chart3DSeries DataSource="@WeatherReports" XName="X" YName="Y1" XAxisName="XAxis" />
    </Chart3DSeriesCollection>
</SfChart3D>

@code{
    public class Chart3DData
    {
        public string X { get; set; }
        public double Y { get; set; }
        public double Y1 { get; set; }
    }

	public List<Chart3DData> WeatherReports = new List<Chart3DData>
	{
		new Chart3DData { X = "Jan", Y = 15, Y1 = 33 },
		new Chart3DData { X = "Feb", Y = 20, Y1 = 31 },
		new Chart3DData { X = "Mar", Y = 35, Y1 = 30 },
		new Chart3DData { X = "Apr", Y = 40, Y1 = 28 },
		new Chart3DData { X = "May", Y = 80, Y1 = 29 },
		new Chart3DData { X = "Jun", Y = 70, Y1 = 30 },
		new Chart3DData { X = "Jul", Y = 65, Y1 = 33 },
		new Chart3DData { X = "Aug", Y = 55, Y1 = 32 },
		new Chart3DData { X = "Sep", Y = 50, Y1 = 34 },
		new Chart3DData { X = "Oct", Y = 30, Y1 = 32 },
		new Chart3DData { X = "Nov", Y = 35, Y1 = 32 },
		new Chart3DData { X = "Dec", Y = 35, Y1 = 31 }
	};
}