How can I help you?
Working with Data in Blazor 3D Chart Component
23 Jan 202613 minutes to read
The 3D Chart uses SfDataManager, which supports both RESTful JSON data services binding and IEnumerable binding. The DataSource value can be set using either SfDataManager property values or a list of business objects.
It supports the following data binding methods:
- List binding
- Remote data
List binding
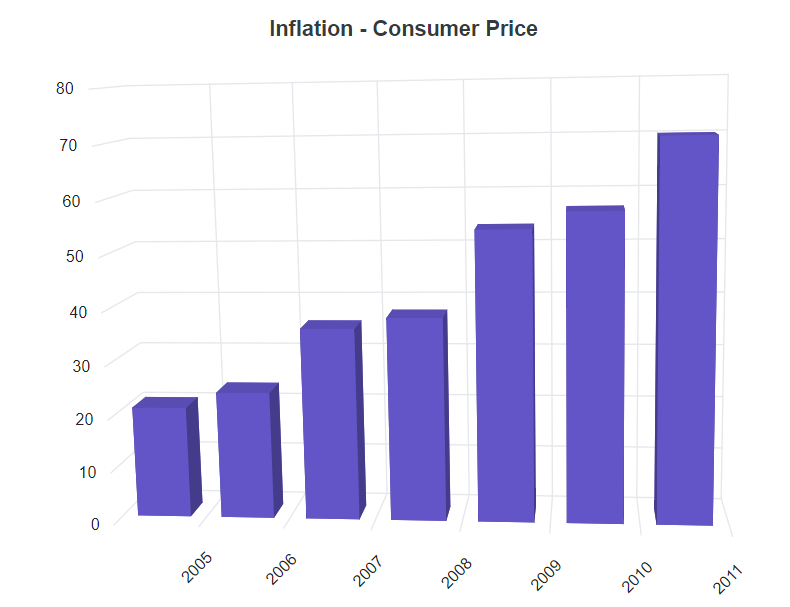
An IEnumerable object can be assigned to the DataSource property. The list data source can alternatively be given as an instance of SfDataManager or by using SfDataManager or as a component of the SfDataManager or by using SfDataManager. The data fields should now be mapped to the XName and YName properties.
@using Syncfusion.Blazor.Chart3D

<SfChart3D Title="Inflation - Consumer Price" Width="60%" WallColor="transparent" EnableRotation="true" RotationAngle="7" TiltAngle="10" Depth="100">
    <Chart3DPrimaryXAxis LabelFormat="yyyy" ValueType="Syncfusion.Blazor.Chart3D.ValueType.DateTime" LabelRotationAngle="-45" LabelPlacement="Syncfusion.Blazor.Chart3D.LabelPlacement.BetweenTicks">
    </Chart3DPrimaryXAxis>
	<Chart3DSeriesCollection>
        <Chart3DSeries DataSource="@ConsumerReports" XName="XValue" YName="YValue" Type="Chart3DSeriesType.Column">
        </Chart3DSeries>
    </Chart3DSeriesCollection>
</SfChart3D>

@code{
    public class Chart3DData
    {
        public DateTime XValue { get; set; }
        public double YValue { get; set; }
    }

    public List<Chart3DData> ConsumerReports = new List<Chart3DData>
    {
		new Chart3DData { XValue = new DateTime(2005, 01, 01), YValue = 21 },
		new Chart3DData { XValue = new DateTime(2006, 01, 01), YValue = 24 },
		new Chart3DData { XValue = new DateTime(2007, 01, 01), YValue = 36 },
		new Chart3DData { XValue = new DateTime(2008, 01, 01), YValue = 38 },
		new Chart3DData { XValue = new DateTime(2009, 01, 01), YValue = 54 },
		new Chart3DData { XValue = new DateTime(2010, 01, 01), YValue = 57 },
		new Chart3DData { XValue = new DateTime(2011, 01, 01), YValue = 70 },
	};
}
NOTE
By default, SfDataManager uses BlazorAdaptor for list data-binding.
ExpandoObject binding
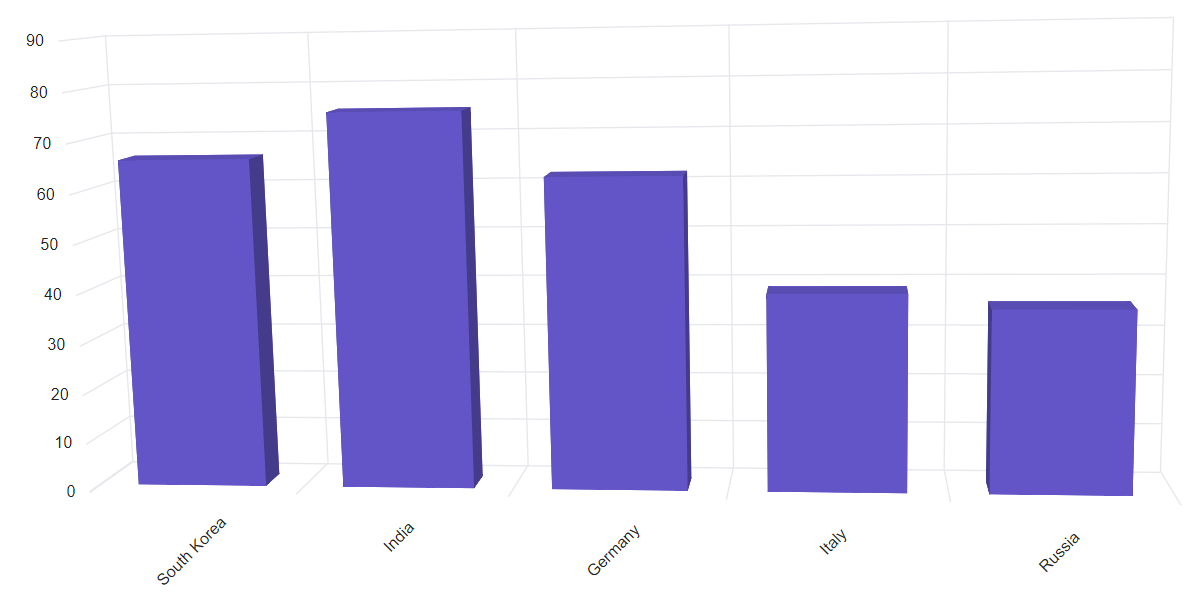
Blazor 3D Chart is a generic component which is strongly bound to a model type. There are cases when the model type is unknown during compile time. In such circumstances data can be bound to the chart as a list of ExpandoObjects. The ExpandoObject can be bound to 3D Chart by assigning to the DataSource property.
@using Syncfusion.Blazor.Chart3D
@using System.Dynamic

<SfChart3D WallColor="transparent" EnableRotation="true" RotationAngle="7" TiltAngle="10" Depth="100">
    <Chart3DPrimaryXAxis ValueType="Syncfusion.Blazor.Chart3D.ValueType.Category" LabelRotationAngle="-45" LabelPlacement="Syncfusion.Blazor.Chart3D.LabelPlacement.BetweenTicks"/>
    <Chart3DSeriesCollection>
        <Chart3DSeries DataSource="@MedalDetails" XName="X" YName="Y" Type="Chart3DSeriesType.Column">
        </Chart3DSeries>
    </Chart3DSeriesCollection>
</SfChart3D>

@code{
    private List<string> countries = new List<string> { "South Korea", "India", "Germany", "Italy", "Russia" };
    private Random randomNum = new Random();
    public List<ExpandoObject> MedalDetails { get; set; } = new List<ExpandoObject>();
    protected override void OnInitialized()
    {
        MedalDetails = Enumerable.Range(0, 5).Select((x) =>
        {
            dynamic d = new ExpandoObject();
            d.X = countries[x];
            d.Y = randomNum.Next(20, 80);
            return d;
        }).Cast<ExpandoObject>().ToList<ExpandoObject>();
    }
}
DynamicObject binding
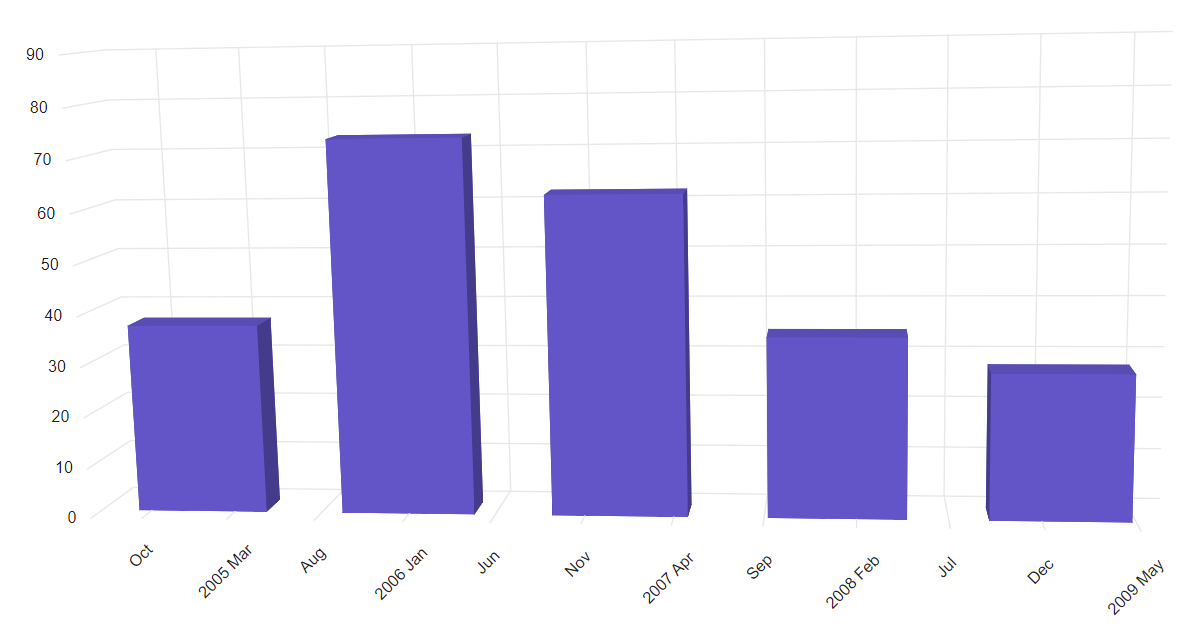
Blazor 3D Chart supports DynamicObject data source when the model type is unknown. The DynamicObject can be bound to chart by assigning to the DataSource property.
@using Syncfusion.Blazor.Chart3D
@using System.Dynamic

<SfChart3D WallColor="transparent" EnableRotation="true" RotationAngle="7" TiltAngle="10" Depth="100">
    <Chart3DPrimaryXAxis ValueType="Syncfusion.Blazor.Chart3D.ValueType.DateTime" LabelRotationAngle="-45" LabelPlacement="LabelPlacement.BetweenTicks"></Chart3DPrimaryXAxis>
    <Chart3DPrimaryYAxis></Chart3DPrimaryYAxis>
    <Chart3DSeriesCollection>
        <Chart3DSeries DataSource="MedalDetails" XName="X" YName="Y" Type="Chart3DSeriesType.Column"></Chart3DSeries>
    </Chart3DSeriesCollection>
</SfChart3D>

@code{
    private List<DateTime> Dates = new List<DateTime> { new DateTime(2005, 01, 01), new DateTime(2006, 01, 01),
        new DateTime(2007, 01, 01), new DateTime(2008, 01, 01), new DateTime(2009, 01, 01), new DateTime(2010, 01, 01), new DateTime(2011, 01, 01) };
    public DateTime[] Value = new DateTime[] { new DateTime(2006, 01, 01), new DateTime(2008, 01, 01) };
    private Random randomNum = new Random();
    public List<DynamicDictionary> MedalDetails = new List<DynamicDictionary>() { };
    protected override void OnInitialized()
    {
        MedalDetails = Enumerable.Range(0, 5).Select((x) =>
        {
            dynamic d = new DynamicDictionary();
            d.X = Dates[x];
            d.Y = randomNum.Next(20, 80);
            return d;
        }).Cast<DynamicDictionary>().ToList<DynamicDictionary>();
    }
    public class DynamicDictionary : DynamicObject
    {
        Dictionary<string, object> dictionary = new Dictionary<string, object>();

        public override bool TryGetMember(GetMemberBinder binder, out object result)
        {
            string name = binder.Name;
            return dictionary.TryGetValue(name, out result);
        }
        public override bool TrySetMember(SetMemberBinder binder, object value)
        {
            dictionary[binder.Name] = value;
            return true;
        }
        public override System.Collections.Generic.IEnumerable<string> GetDynamicMemberNames()
        {
            return this.dictionary?.Keys;
        }
    }
}
Remote data
The remote data can be bound to the 3D chart using the SfDataManager. The DataManager requires minimal information like web service URL, adaptor and cross domain to interact with service endpoint properly. Assign the instance of the DataManager to the DataSource property in series and map the fields of data to XName and YName properties.
@using Syncfusion.Blazor
@using Syncfusion.Blazor.Data
@using Syncfusion.Blazor.Chart3D
@using System.Dynamic

<SfChart3D WallColor="transparent" EnableRotation="true" RotationAngle="7" TiltAngle="10" Depth="100">
    <SfDataManager Url="https://blazor.syncfusion.com/services/production/api/chart" Adaptor="Adaptors.WebApiAdaptor"></SfDataManager>

    <Chart3DPrimaryXAxis ValueType="Syncfusion.Blazor.Chart3D.ValueType.Category" LabelRotationAngle="-45" LabelPlacement="LabelPlacement.BetweenTicks"></Chart3DPrimaryXAxis>

    <Chart3DSeriesCollection>
        <Chart3DSeries XName="FoodName" YName="Price" Type="Chart3DSeriesType.Column"></Chart3DSeries>
    </Chart3DSeriesCollection>
</SfChart3D>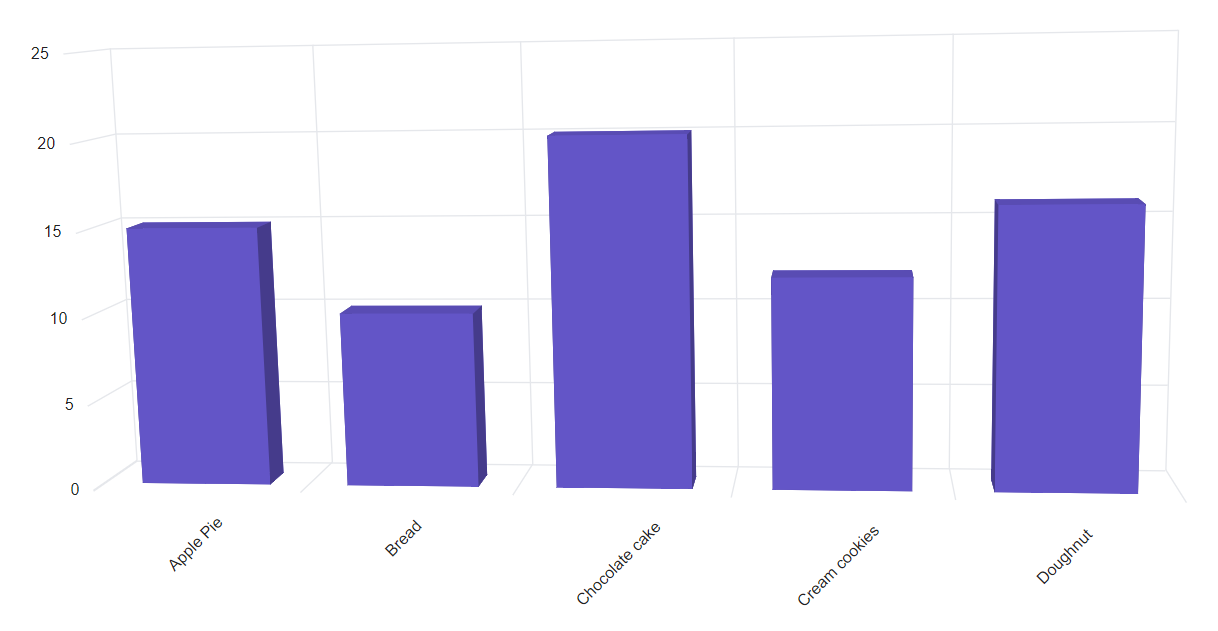
Binding with OData services
OData is a standardized data creation and consumption protocol. The SfDataManager can be used to retrieve data from an OData service. For remote data binding using the OData service, see the code below.
Binding with OData v4 services
The SfDataManager can retrieve and consume OData v4 services, which is an upgraded version of OData protocols. Refer to the OData documentation for additional information on OData v4 services. To bind an OData v4 service, use the ODataV4Adaptor.
@using Syncfusion.Blazor
@using Syncfusion.Blazor.Data
@using Syncfusion.Blazor.Chart3D
@using System.Dynamic

<SfChart3D WallColor="transparent" EnableRotation="true" RotationAngle="7" TiltAngle="10" Depth="100">
    <SfDataManager Url="https://services.odata.org/V4/Northwind/Northwind.svc/Orders" Adaptor="Adaptors.ODataV4Adaptor"></SfDataManager>

    <Chart3DPrimaryXAxis Title="Orders" ValueType="Syncfusion.Blazor.Chart3D.ValueType.Category" LabelRotationAngle="-45" LabelPlacement="Syncfusion.Blazor.Chart3D.LabelPlacement.BetweenTicks"></Chart3DPrimaryXAxis>

    <Chart3DSeriesCollection>
        <Chart3DSeries XName="OrderID" YName="Freight" Type="Chart3DSeriesType.Column"></Chart3DSeries>
    </Chart3DSeriesCollection>
</SfChart3D>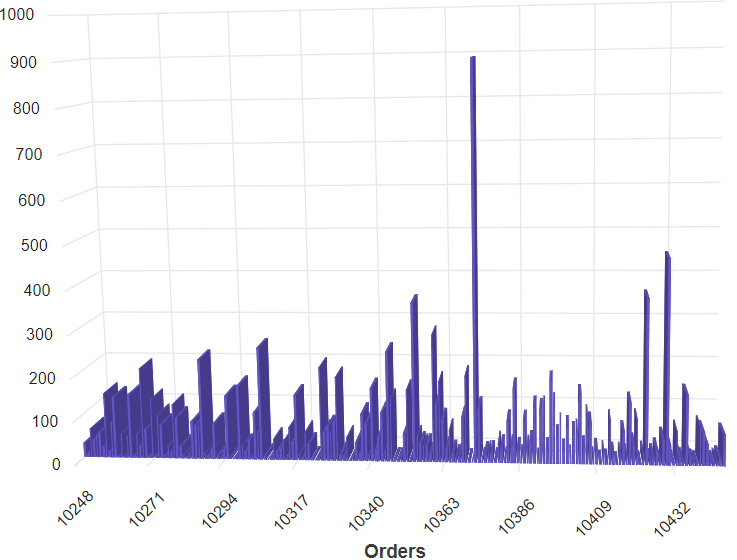
Web API
The WebApiAdaptor can be used to bind a chart to a Web API created using an OData endpoint.
@using Syncfusion.Blazor
@using Syncfusion.Blazor.Data
@using Syncfusion.Blazor.Chart3D

<SfChart3D WallColor="transparent" EnableRotation="true" RotationAngle="7" TiltAngle="10" Depth="100">
    <SfDataManager Url="https://blazor.syncfusion.com/services/production/api/Orders" Adaptor="Adaptors.WebApiAdaptor"></SfDataManager>

    <Chart3DPrimaryXAxis Title="Orders" ValueType="Syncfusion.Blazor.Chart3D.ValueType.Category" LabelRotationAngle="-45" LabelPlacement="Syncfusion.Blazor.Chart3D.LabelPlacement.BetweenTicks"></Chart3DPrimaryXAxis>

    <Chart3DSeriesCollection>
        <Chart3DSeries XName="OrderID" YName="Freight" Type="Chart3DSeriesType.Column"></Chart3DSeries>
    </Chart3DSeriesCollection>
</SfChart3D>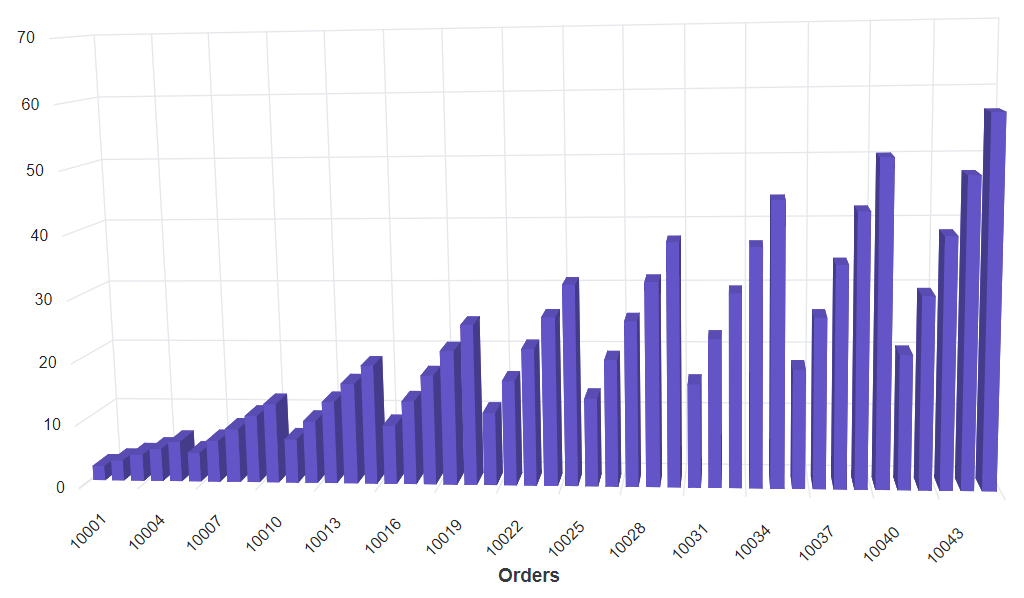
Sending additional parameters to the server
To create a data request with a custom parameter, add additional parameters to the Query object and assign it to the chart’s Query property.
The following sample code shows how to send parameters using the Query property in the series.
@using Syncfusion.Blazor.Data
@using Syncfusion.Blazor.Chart3D

<SfChart3D WallColor="transparent" EnableRotation="true" RotationAngle="7" TiltAngle="10" Depth="100">
    <SfDataManager Url="https://services.odata.org/V4/Northwind/Northwind.svc/Orders" Adaptor="Adaptors.ODataV4Adaptor"></SfDataManager>

    <Chart3DPrimaryXAxis Title="Orders" ValueType="Syncfusion.Blazor.Chart3D.ValueType.Category" LabelRotationAngle="-45" LabelPlacement="Syncfusion.Blazor.Chart3D.LabelPlacement.BetweenTicks"></Chart3DPrimaryXAxis>

    <Chart3DSeriesCollection>
        <Chart3DSeries Query="ChartQuery" XName="OrderID" YName="Freight" Type="Chart3DSeriesType.Column"></Chart3DSeries>
    </Chart3DSeriesCollection>
</SfChart3D>

@code {
    public Query ChartQuery { get; set; }

    protected override void OnInitialized()
    {
        ChartQuery = new Query().Take(10).Where("Freight", "GreaterThan", 300, false);
    }

}
Empty points
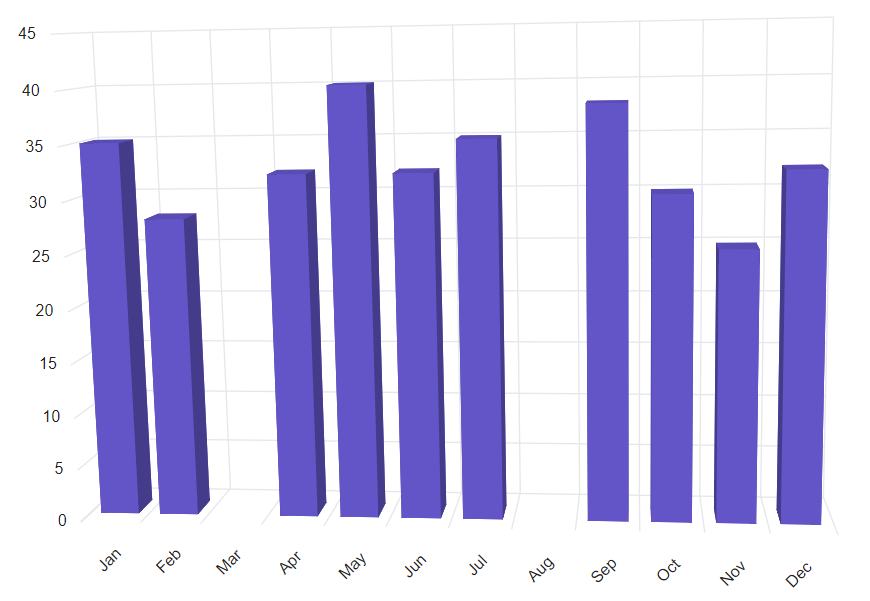
The data points that uses the null or undefined as value are considered as empty points. The empty data points are ignored and is not plotted in the chart. When the data is provided by using the points property, by using Chart3DEmptyPointSettings property in series, the empty can be customized. The default Mode of the empty point is Gap.
@using Syncfusion.Blazor.Chart3D

<SfChart3D WallColor="transparent" EnableRotation="true" RotationAngle="7" TiltAngle="10" Depth="100">
    <Chart3DPrimaryXAxis ValueType="Syncfusion.Blazor.Chart3D.ValueType.Category" LabelRotationAngle="-45" LabelPlacement="Syncfusion.Blazor.Chart3D.LabelPlacement.BetweenTicks">
    </Chart3DPrimaryXAxis>

    <Chart3DSeriesCollection>
        <Chart3DSeries DataSource="@SalesReports" XName="Month" YName="Sales" Type="Chart3DSeriesType.Column">
            <Chart3DEmptyPointSettings Fill="gray" Mode="Syncfusion.Blazor.Chart3D.EmptyPointMode.Gap">
            </Chart3DEmptyPointSettings>
        </Chart3DSeries>
    </Chart3DSeriesCollection>
</SfChart3D>

@code{
    public class Chart3DData
    {
        public string Month { get; set; }
        public Nullable<double> Sales { get; set; }
    }

    public List<Chart3DData> SalesReports = new List<Chart3DData>
    {
        new Chart3DData { Month = "Jan", Sales = 35 },
        new Chart3DData { Month = "Feb", Sales = 28 },
        new Chart3DData { Month = "Mar", Sales = double.NaN },
        new Chart3DData { Month = "Apr", Sales = 32 },
        new Chart3DData { Month = "May", Sales = 40 },
        new Chart3DData { Month = "Jun", Sales = 32 },
        new Chart3DData { Month = "Jul", Sales = 35 },
        new Chart3DData { Month = "Aug", Sales = double.NaN },
        new Chart3DData { Month = "Sep", Sales = 38 },
        new Chart3DData { Month = "Oct", Sales = 30 },
        new Chart3DData { Month = "Nov", Sales = 25 },
        new Chart3DData { Month = "Dec", Sales = 32 }
    };
}
Customizing empty point
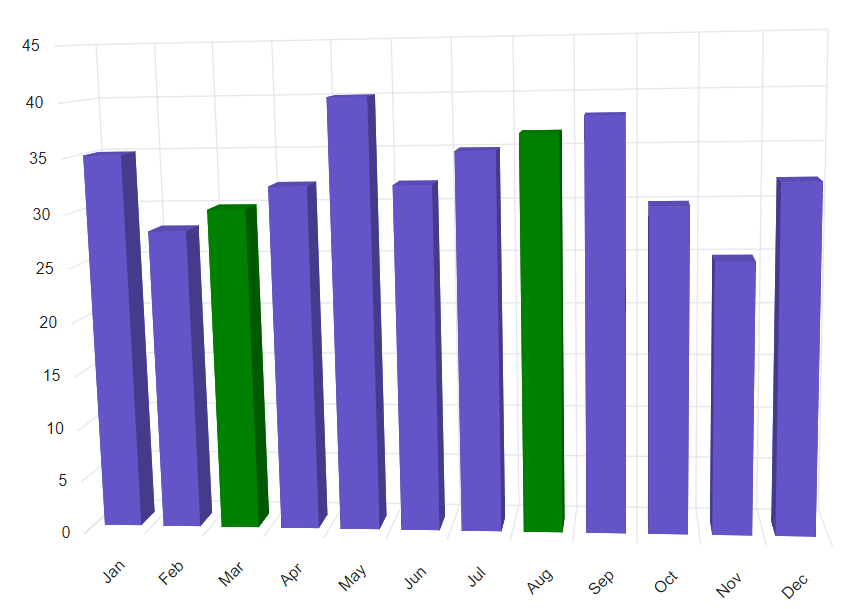
The specific color for empty point can be set by the Fill property in Chart3DEmptyPointSettings.
@using Syncfusion.Blazor.Chart3D

<SfChart3D WallColor="transparent" EnableRotation="true" RotationAngle="7" TiltAngle="10" Depth="100">
    <Chart3DPrimaryXAxis ValueType="Syncfusion.Blazor.Chart3D.ValueType.Category" LabelRotationAngle="-45" LabelPlacement="Syncfusion.Blazor.Chart3D.LabelPlacement.BetweenTicks">
    </Chart3DPrimaryXAxis>

    <Chart3DSeriesCollection>
        <Chart3DSeries DataSource="@SalesReports" XName="Month" YName="Sales" Type="Chart3DSeriesType.Column">
            <Chart3DEmptyPointSettings Mode="Syncfusion.Blazor.Chart3D.EmptyPointMode.Average" Fill="green">
            </Chart3DEmptyPointSettings>
        </Chart3DSeries>
    </Chart3DSeriesCollection>
</SfChart3D>

@code {
    public class Chart3DData
    {
        public string Month { get; set; }
        public Nullable<double> Sales { get; set; }
    }

    public List<Chart3DData> SalesReports = new List<Chart3DData>
    {
        new Chart3DData { Month = "Jan", Sales = 35 },
        new Chart3DData { Month = "Feb", Sales = 28 },
        new Chart3DData { Month = "Mar", Sales = double.NaN },
        new Chart3DData { Month = "Apr", Sales = 32 },
        new Chart3DData { Month = "May", Sales = 40 },
        new Chart3DData { Month = "Jun", Sales = 32 },
        new Chart3DData { Month = "Jul", Sales = 35 },
        new Chart3DData { Month = "Aug", Sales = double.NaN },
        new Chart3DData { Month = "Sep", Sales = 38 },
        new Chart3DData { Month = "Oct", Sales = 30 },
        new Chart3DData { Month = "Nov", Sales = 25 },
        new Chart3DData { Month = "Dec", Sales = 32 }
    };
}