Dynamic Points in Blazor Charts Component
18 Dec 20239 minutes to read
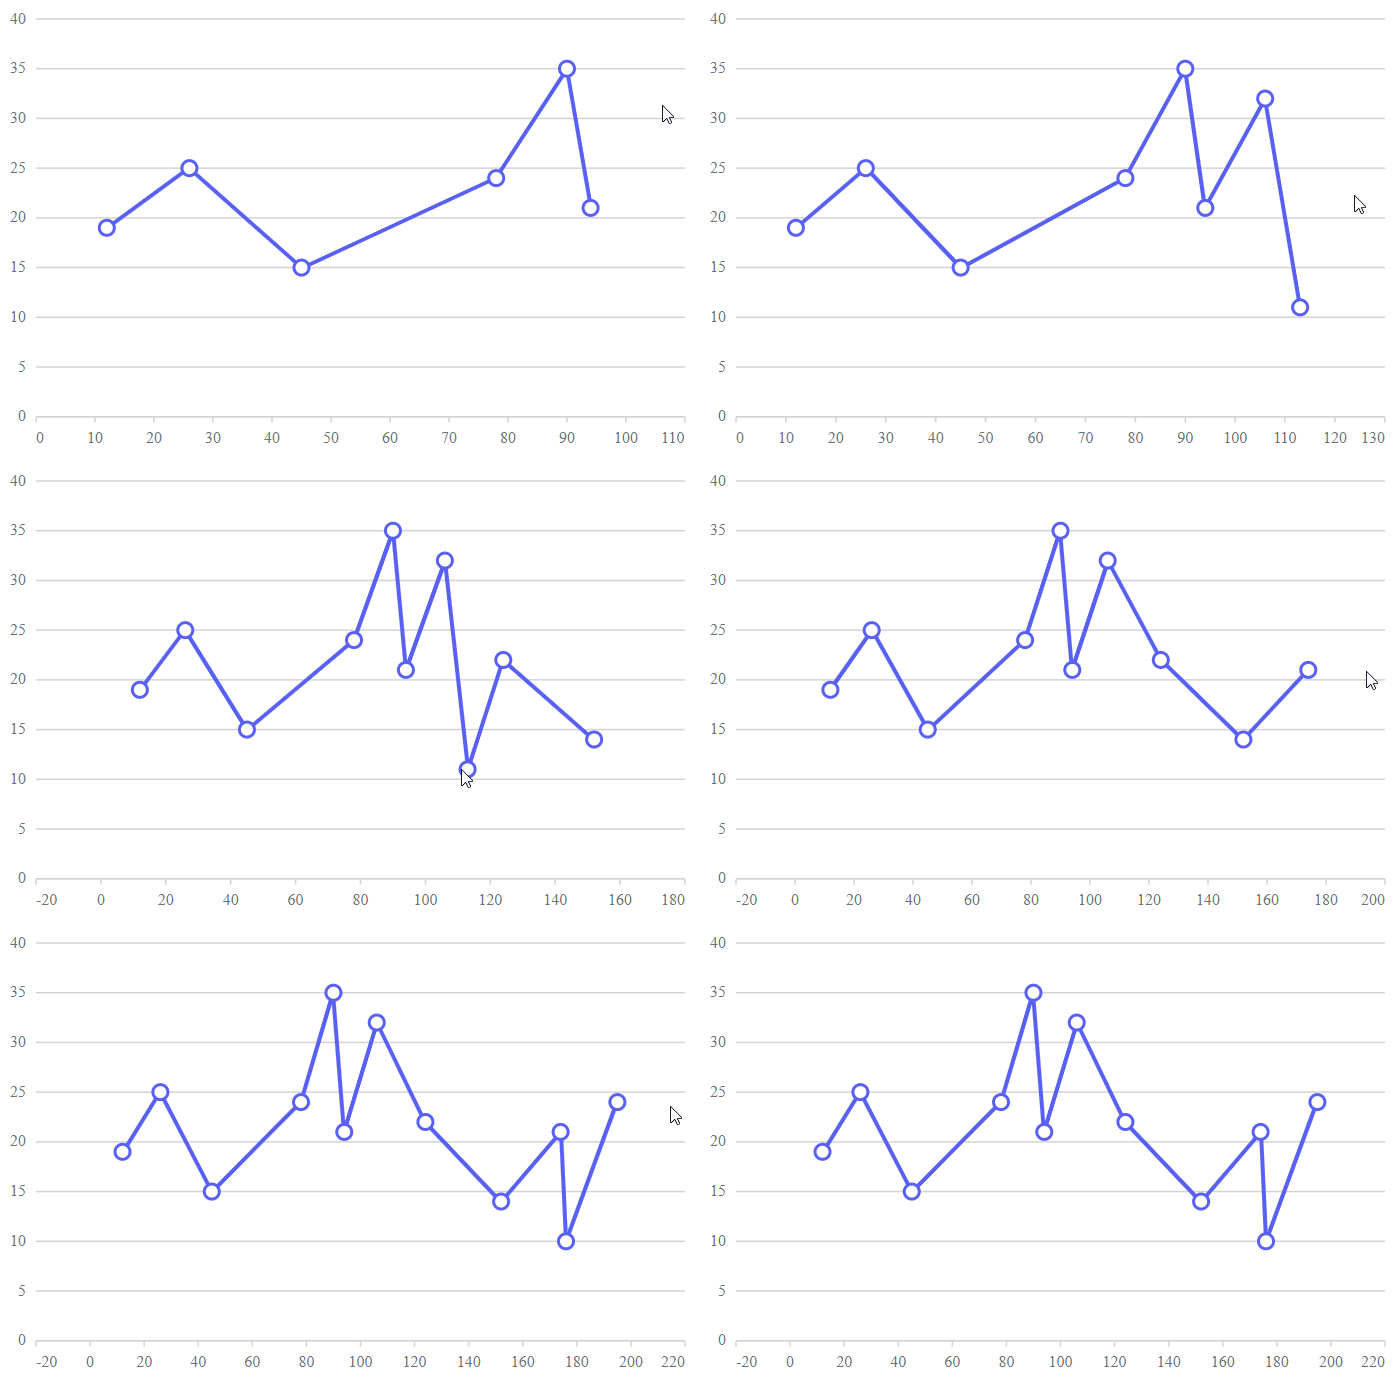
We can use chart mouse/touch events to dynamically add or remove points from an existing data source by clicking within the chart area. These events allow us to obtain the location of the current cursor as X and Y values in the event arguments. The point’s X and Y values can then be updated with new data from the existing data source. To achieve dynamic points, follow the steps outlined below.
Step 1
Add the ChartMouseClick event to the chart and add the event handler to that.
<SfChart>
<ChartEvents ChartMouseClick="MouseClick"></ChartEvents>
...
<SfChart>
@code{
    public void MouseClick(ChartMouseEventArgs args)
    {

    }
}
Step 2
Fetch the X-axis and Y-axis data of the currently clicked location from the ChartMouseClick event arguments, and then add points to the data source using the AddToDataSource method, as shown below.
public void MouseClick(ChartMouseEventArgs args)
{
    if (args.AxisData.Count > 0)
    {
        if (args.AxisData.TryGetValue("PrimaryXAxis", out object xValue) &&
            args.AxisData.TryGetValue("PrimaryYAxis", out object yValue))
        {
            xPoint = Math.Round(Convert.ToDouble(xValue, null));
            yPoint = Math.Round(Convert.ToDouble(yValue, null));
            AddToDataSource(xPoint, yPoint);
            StateHasChanged();
        }
    }
}
public void AddToDataSource(object xValue, object yValue)
{
    MouseClickPoints.Add(new PointData() { X = Convert.ToDouble(xValue, null), Y = Convert.ToDouble(yValue, null) });
}
Step 3
To remove a point from the existing chart data source, click on it. To do so, create a method IsSamePoint to check whether the point obtained from ChartMouseClick already exists in the data source. If the point exists in the data source, it should be removed.
    public void MouseClick(ChartMouseEventArgs args)
    {
        ...
                bool isSamePoint;
                if (MouseClickPoints.Count >= 1)
                {
                    index = -1;
                    isSamePoint = IsSamePoint();
                    if (isSamePoint && MouseClickPoints.Count >= 1)
                    {
                        MouseClickPoints.RemoveAt(index);
                    }
                    else if (!isSamePoint)
                    {
                        AddToDataSource(xPoint, yPoint);
                    }
                }
        ...
    }
    public bool IsSamePoint()
    {
        foreach (PointData item in MouseClickPoints)
        {
            index = index + 1;
            if (item.X == Convert.ToDouble(xPoint, null) &&
                item.Y == Convert.ToDouble(yPoint, null))
            {
                return true;
            }
        }
        return false;
    }
Action
The below code snippet illustrates a chart that allows users to add new data and update existing data source by clicking in the chart area. Additionally, clicking on an existing point will remove that data from the existing data source.
@using Syncfusion.Blazor
@using Syncfusion.Blazor.Charts

<SfChart @ref="Chart">
    <ChartEvents ChartMouseClick="MouseClick"></ChartEvents>
    <ChartArea><ChartAreaBorder Width="0"></ChartAreaBorder></ChartArea>
    <ChartPrimaryXAxis @ref="XAxis" ValueType="Syncfusion.Blazor.Charts.ValueType.Double" RangePadding="ChartRangePadding.Additional" EdgeLabelPlacement="EdgeLabelPlacement.Shift">
        <ChartAxisMajorGridLines Width="0"></ChartAxisMajorGridLines>
    </ChartPrimaryXAxis>
    <ChartPrimaryYAxis>
        <ChartAxisMajorTickLines Width="0"></ChartAxisMajorTickLines>
        <ChartAxisLineStyle Width="0"></ChartAxisLineStyle>
    </ChartPrimaryYAxis>
    <ChartTooltipSettings Enable="true" Format="${point.x} : <b>${point.y} </b>"></ChartTooltipSettings>
    <ChartSeriesCollection>
        <ChartSeries DataSource="@MouseClickPoints" XName="X" YName="Y" Opacity="1" Width="2" Type="ChartSeriesType.Line">
            <ChartMarker Visible="true" Height="10" Width="10" />
        </ChartSeries>
    </ChartSeriesCollection>
</SfChart>
@code {

    SfChart? Chart;
    ChartPrimaryXAxis? XAxis;
    Theme Theme { get; set; }
    public string Width { get; set; } = "90%";
    object xPoint, yPoint;
    int index;

    public void MouseClick(ChartMouseEventArgs args)
    {
        if (args.AxisData.Count > 0)
        {
            if (args.AxisData.TryGetValue("PrimaryXAxis", out object xValue) && args.AxisData.TryGetValue("PrimaryYAxis", out object yValue))
            {
                xPoint = Math.Round(Convert.ToDouble(xValue, null));
                yPoint = Math.Round(Convert.ToDouble(yValue, null));
                bool isSamePoint;
                if (MouseClickPoints.Count >= 1)
                {
                    index = -1;
                    isSamePoint = IsSamePoint();
                    if (isSamePoint && MouseClickPoints.Count >= 1)
                    {
                        MouseClickPoints.RemoveAt(index);
                    }
                    else if (!isSamePoint)
                    {
                        AddToDataSource(xPoint, yPoint);
                    }
                }
                else
                {
                    AddToDataSource(xPoint, yPoint);
                }
                StateHasChanged();
            }
        }
    }

    public bool IsSamePoint()
    {
        foreach (PointData item in MouseClickPoints)
        {
            index = index + 1;
            if (item.X == Convert.ToDouble(xPoint, null) && item.Y == Convert.ToDouble(yPoint, null))
            {
                return true;
            }
        }
        return false;
    }

    public void AddToDataSource(object xValue, object yValue)
    {
        MouseClickPoints.Add(new PointData() { X = Convert.ToDouble(xValue, null), Y = Convert.ToDouble(yValue, null) });
    }

    public class PointData
    {
        public Nullable<double> X { get; set; }
        public Nullable<double> Y { get; set; }
    }

    public List<PointData> MouseClickPoints = new List<PointData>
    {
        new PointData { X= 12, Y= 19 },
        new PointData { X= 26, Y= 25 },
        new PointData { X= 45, Y= 15 },
        new PointData { X= 78, Y= 24 },
        new PointData { X= 90, Y= 35 }
    };
}
NOTE
Refer to our Blazor Charts feature tour page for its groundbreaking feature representations and also explore our Blazor Chart Example to know various chart types and how to represent time-dependent data, showing trends at equal intervals.