How can I help you?
Organizational Chart in Diagram Component
2 Feb 202624 minutes to read
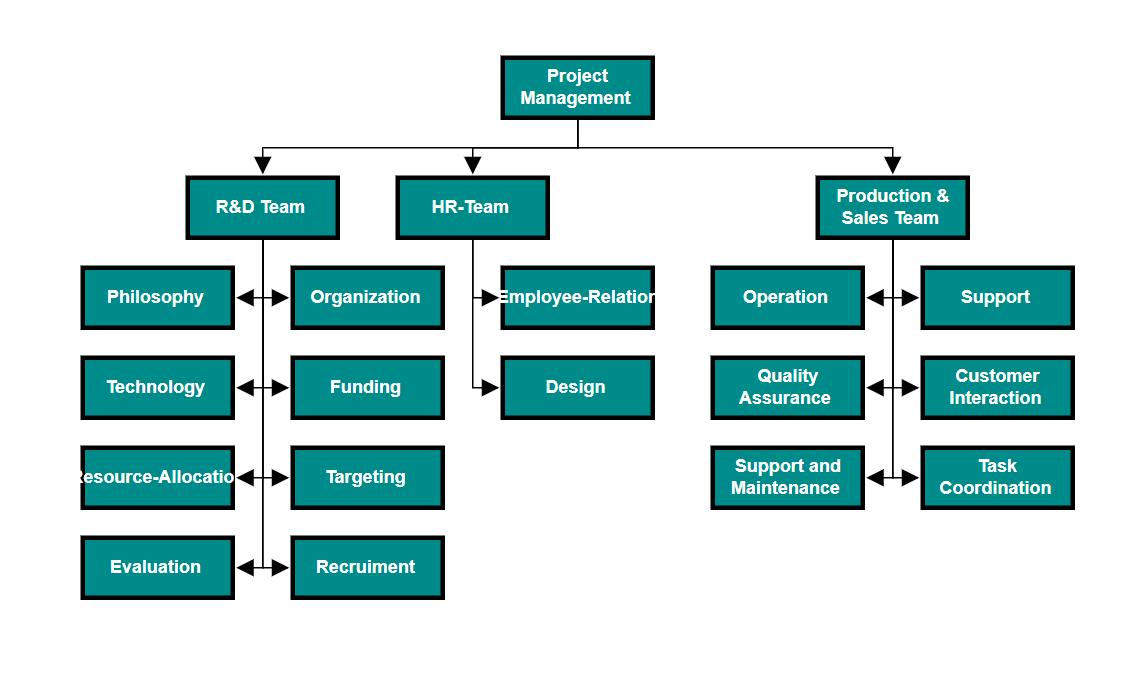
An OrganizationalChart is a diagram that displays the structure of an organization and the relationships. To create an organizational chart, set the layout Type to OrganizationalChart.
To create and position the Organizational Chart Using Blazor Diagram, you can check the video below.
The following code example illustrates how to create an organizational chart.
@using Syncfusion.Blazor.Diagram

<SfDiagramComponent Height="600px" Nodes="@_nodeCollection" Connectors="@_connectors" NodeCreating="@OnNodeCreating" ConnectorCreating="@OnConnectorCreating">
    <Layout Type="LayoutType.OrganizationalChart" @bind-HorizontalSpacing="@_horizontalSpacing" @bind-VerticalSpacing="@_verticalSpacing">
    </Layout>
</SfDiagramComponent>

@code
{
    //Defines diagram's connector collection.
    private DiagramObjectCollection<Connector> _connectors = new DiagramObjectCollection<Connector>();
    //Defines diagram's node collection.
    private DiagramObjectCollection<Node> _nodeCollection = new DiagramObjectCollection<Node>();

    private int _horizontalSpacing = 40;
    private int _verticalSpacing = 40;

    private void OnNodeCreating(IDiagramObject obj)
    {
        Node node = obj as Node;
        node.Height = 40;
        node.Width = 100;
        //Initializing the default node's shape style.
        node.Style = new ShapeStyle() { Fill = "darkcyan", StrokeWidth = 3, StrokeColor = "Black" };
        node.Annotations[0].Style = new TextStyle() { Color = "white", Bold = true };
    }

    private void OnConnectorCreating(IDiagramObject connector)
    {
        (connector as Connector).Type = ConnectorSegmentType.Orthogonal;
    }

    protected override void OnInitialized()
    {
        _nodeCollection = new DiagramObjectCollection<Node>()
        {
            new Node() { ID = "node1", Annotations = new DiagramObjectCollection<ShapeAnnotation>() { new ShapeAnnotation { Content = "Project Management" } } },
            new Node() { ID = "node2", Annotations = new DiagramObjectCollection<ShapeAnnotation>() { new ShapeAnnotation { Content = "R&D Team" } } },
            new Node() { ID = "node3", Annotations = new DiagramObjectCollection<ShapeAnnotation>() { new ShapeAnnotation { Content = "Philosophy" } } },
            new Node() { ID = "node4", Annotations = new DiagramObjectCollection<ShapeAnnotation>() { new ShapeAnnotation { Content = "Organization" } } },
            new Node() { ID = "node5", Annotations = new DiagramObjectCollection<ShapeAnnotation>() { new ShapeAnnotation { Content = "Technology" } } },
            new Node() { ID = "node6", Annotations = new DiagramObjectCollection<ShapeAnnotation>() { new ShapeAnnotation { Content = "Funding" } } },
            new Node() { ID = "node7", Annotations = new DiagramObjectCollection<ShapeAnnotation>() { new ShapeAnnotation { Content = "Resource-Allocation" } } },
            new Node() { ID = "node8", Annotations = new DiagramObjectCollection<ShapeAnnotation>() { new ShapeAnnotation { Content = "Targeting" } } },
            new Node() { ID = "node9", Annotations = new DiagramObjectCollection<ShapeAnnotation>() { new ShapeAnnotation { Content = "Evaluation" } } },
            new Node() { ID = "node10", Annotations = new DiagramObjectCollection<ShapeAnnotation>() { new ShapeAnnotation { Content = "HR-Team" } } },
            new Node() { ID = "node11", Annotations = new DiagramObjectCollection<ShapeAnnotation>() { new ShapeAnnotation { Content = "Recruitment" } } },
            new Node() { ID = "node12", Annotations = new DiagramObjectCollection<ShapeAnnotation>() { new ShapeAnnotation { Content = "Employee-Relation" } } },
            new Node() { ID = "node13", Annotations = new DiagramObjectCollection<ShapeAnnotation>() { new ShapeAnnotation { Content = "Production & Sales Team" } } },
            new Node() { ID = "node14", Annotations = new DiagramObjectCollection<ShapeAnnotation>() { new ShapeAnnotation { Content = "Design" } } },
            new Node() { ID = "node15", Annotations = new DiagramObjectCollection<ShapeAnnotation>() { new ShapeAnnotation { Content = "Operation" } } },
            new Node() { ID = "node16", Annotations = new DiagramObjectCollection<ShapeAnnotation>() { new ShapeAnnotation { Content = "Support" } } },
            new Node() { ID = "node17", Annotations = new DiagramObjectCollection<ShapeAnnotation>() { new ShapeAnnotation { Content = "Quality Assurance" } } },
            new Node() { ID = "node18", Annotations = new DiagramObjectCollection<ShapeAnnotation>() { new ShapeAnnotation { Content = "Customer Interaction" } } },
            new Node() { ID = "node19", Annotations = new DiagramObjectCollection<ShapeAnnotation>() { new ShapeAnnotation { Content = "Support and Maintenance" } } },
            new Node() { ID = "node20", Annotations = new DiagramObjectCollection<ShapeAnnotation>() { new ShapeAnnotation { Content = "Task Coordination" } } }
        };
        _connectors = new DiagramObjectCollection<Connector>()
        {
            new Connector() { ID = "connector1", SourceID = "node1", TargetID = "node2" },
            new Connector() { ID = "connector2", SourceID = "node1", TargetID = "node10" },
            new Connector() { ID = "connector3", SourceID = "node1", TargetID = "node13" },
            new Connector() { ID = "connector4", SourceID = "node2", TargetID = "node3" },
            new Connector() { ID = "connector5", SourceID = "node2", TargetID = "node4" },
            new Connector() { ID = "connector6", SourceID = "node2", TargetID = "node5" },
            new Connector() { ID = "connector7", SourceID = "node2", TargetID = "node6" },
            new Connector() { ID = "connector8", SourceID = "node2", TargetID = "node7" },
            new Connector() { ID = "connector9", SourceID = "node2", TargetID = "node8" },
            new Connector() { ID = "connector10", SourceID = "node2", TargetID = "node9" },
            new Connector() { ID = "connector11", SourceID = "node2", TargetID = "node11" },
            new Connector() { ID = "connector12", SourceID = "node10", TargetID = "node12" },
            new Connector() { ID = "connector13", SourceID = "node10", TargetID = "node14" },
            new Connector() { ID = "connector14", SourceID = "node13", TargetID = "node15" },
            new Connector() { ID = "connector15", SourceID = "node13", TargetID = "node16" },
            new Connector() { ID = "connector16", SourceID = "node13", TargetID = "node17" },
            new Connector() { ID = "connector17", SourceID = "node13", TargetID = "node18" },
            new Connector() { ID = "connector18", SourceID = "node13", TargetID = "node19" },
            new Connector() { ID = "connector19", SourceID = "node13", TargetID = "node20" }
        };
    }
}
A complete working sample can be downloaded from GitHub
Organizational chart layout starts parsing from the root and iterates through all its child elements. The GetLayoutInfo event callback method provides information about a node’s children and the way to arrange them (direction, orientation, offsets, etc.). The arrangements can be customized by overriding this function as explained below.
GetLayoutInfo configures chart orientations, chart types, and offset to be left between parent and child nodes. The GetLayoutInfo event callback method is called to configure every subtree of the organizational chart. It uses the following parameters and return value:
- IDiagramObject: Parent node to that options are to be customized.
- TreeInfo: Object to set customizable properties.
- TreeInfo: Returns an object value to be customized.
Note: In
DataSourceSettings, the types of theIDandParentIDproperties are string. The providedDataSourceshould have a parent-child relationship. At least one node must have an emptyParentIDto serve as the root.
How to Customize Layout
Orientation, spacing, and position of the layout can be customized with a set of properties.
To explore layout properties, refer to Layout Properties.
How to Update Layout Bounds
The layout can be aligned within any custom rectangular area. For more information about bounds, refer to Bounds.
How to Align Layout
The layout can be aligned anywhere within the layout bounds or viewport using the HorizontalAlignment and VerticalAlignment properties of the layout.
The following code illustrates how to align the layout at the bottom within the layout bounds.
<SfDiagramComponent @ref="_diagram" Width="900px" Height="800px">
    <Layout Type="LayoutType.OrganizationalChart" @bind-HorizontalSpacing="@_horizontalSpacing" @bind-VerticalSpacing="@_verticalSpacing" @bind-VerticalAlignment="@_verticalAlignment"></Layout>
</SfDiagramComponent>

private int _horizontalSpacing = 40;
private int _verticalSpacing = 40;
private VerticalAlignment _verticalAlignment = VerticalAlignment.Bottom;
The following table illustrates the different chart orientations and chart types.
| Orientation | Type | Description | Example |
|---|---|---|---|
| Horizontal | Left | Arranges the child nodes horizontally at the left side of the parent. | 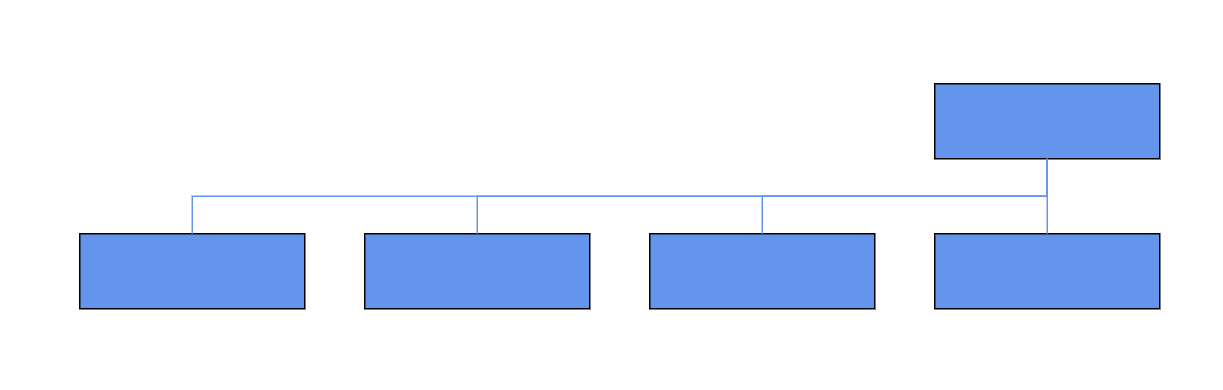 |
| Right | Arranges the child nodes horizontally at the right side of the parent. | 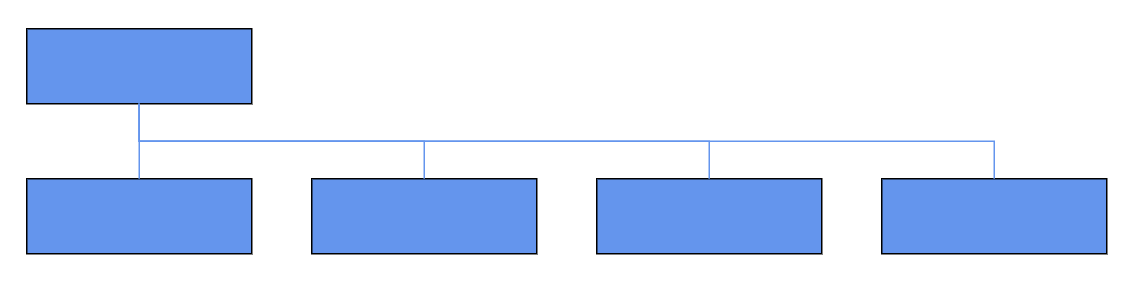 |
|
| Center | Arranges the children like standard tree layout orientation. | 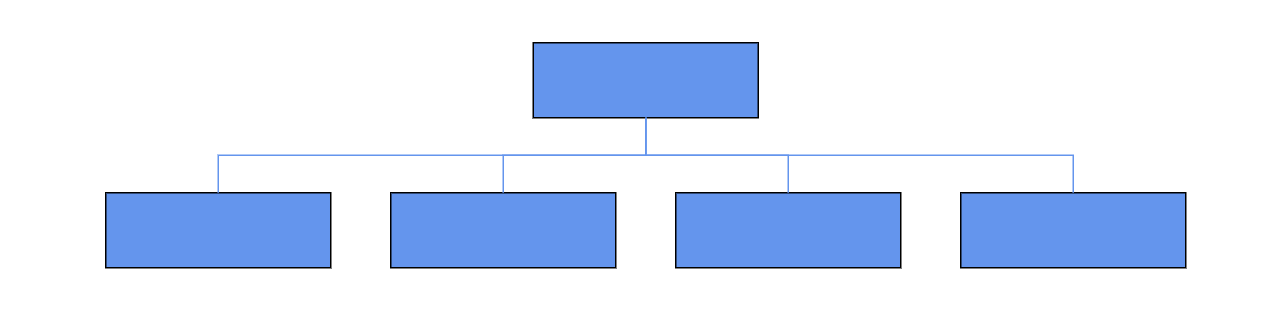 |
|
| Balanced | Arranges the leaf level child nodes in multiple rows. | 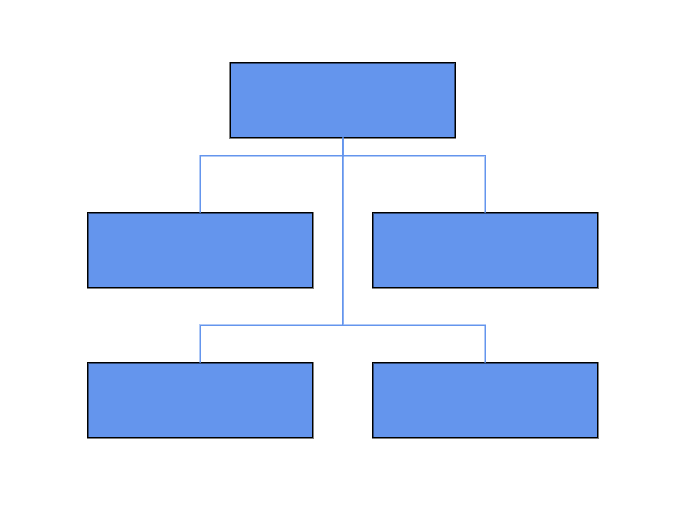 |
|
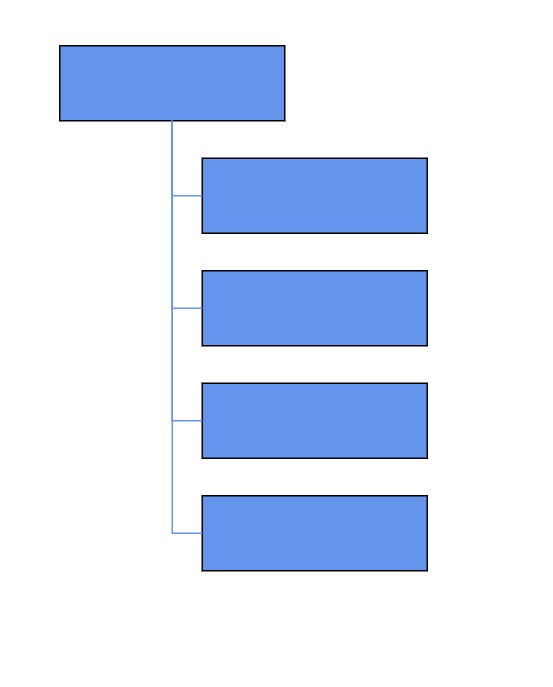
| Vertical | Left | Arranges the children vertically at the left side of the parent. | 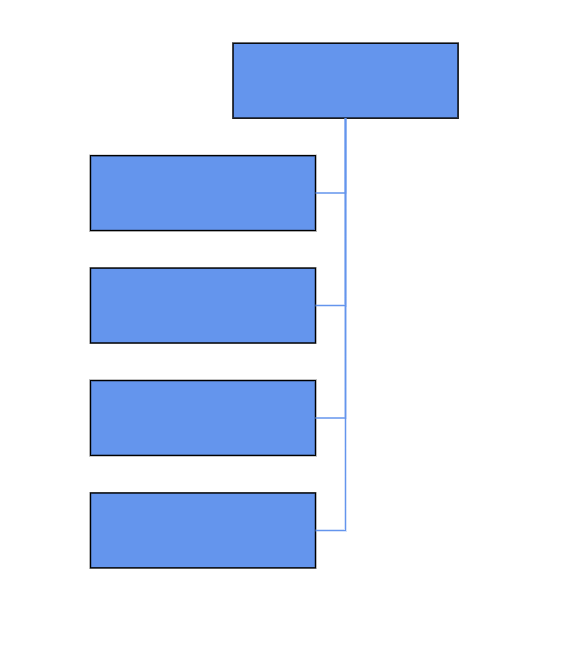 |
| Right | Arranges the children vertically at the right side of the parent. | 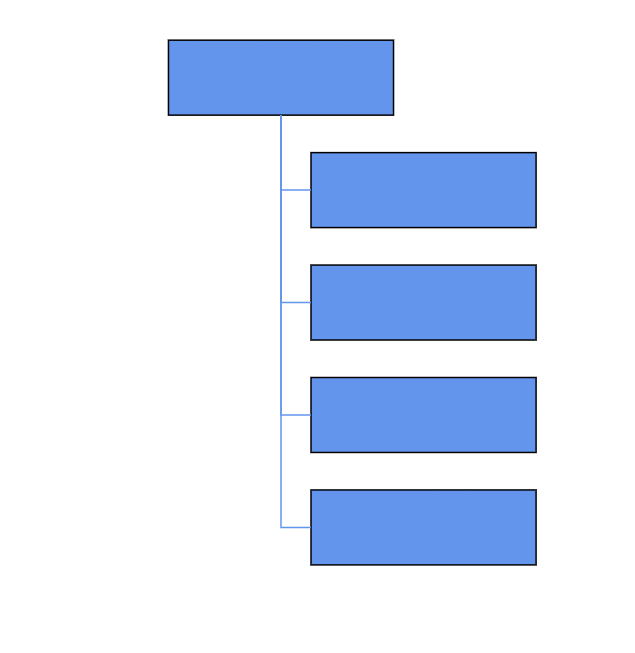 |
|
| Alternate | Arranges the children vertically at both left and right sides of the parent. | 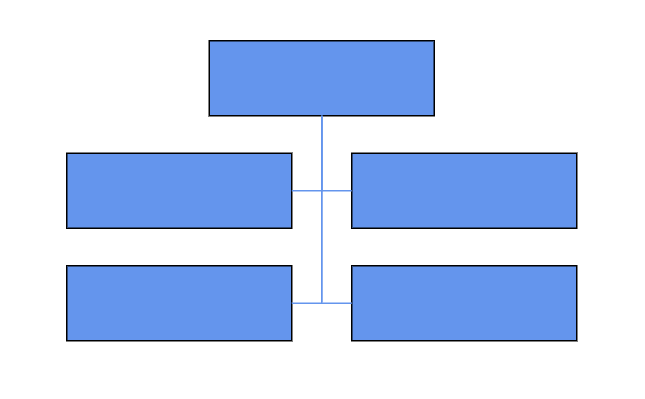 |
The following code example illustrates how to set the vertical right arrangement for leaf-level trees.
@using Syncfusion.Blazor.Inputs
@using Syncfusion.Blazor.Diagram

<SfDiagramComponent Height="600px" NodeCreating="@OnNodeCreating" ConnectorCreating="@OnConnectorCreating">
    <DataSourceSettings ID="Id" ParentID="Team" DataSource="@_dataSource"></DataSourceSettings>
    <SnapSettings>
        <HorizontalGridLines LineColor="white" LineDashArray="2,2">
        </HorizontalGridLines>
        <VerticalGridLines LineColor="white" LineDashArray="2,2">
        </VerticalGridLines>
    </SnapSettings>
    <Layout Type="LayoutType.OrganizationalChart" @bind-HorizontalSpacing="@_horizontalSpacing" @bind-VerticalSpacing="@_verticalSpacing" GetLayoutInfo="GetLayoutInfo">
    </Layout>
</SfDiagramComponent>

@code
{
    //Initializing layout.
    private int _horizontalSpacing = 40;
    private int _verticalSpacing = 50;

    //To configure every subtree of the organizational chart.
    private TreeInfo GetLayoutInfo(IDiagramObject obj, TreeInfo options)
    {
        options.AlignmentType = SubTreeAlignmentType.Right;
        options.Orientation = Orientation.Vertical;
        return options;
    }

    //Creates node with some default values.
    private void OnNodeCreating(IDiagramObject obj)
    {
        Node node = obj as Node;
        node.Height = 50;
        node.Width = 150;
        node.Style = new ShapeStyle() { Fill = "#6495ED", StrokeWidth = 1, StrokeColor = "Black" };
    }

    //Creates connectors with some default values.
    private void OnConnectorCreating(IDiagramObject connector)
    {
        Connector connectors = connector as Connector;
        connectors.Type = ConnectorSegmentType.Orthogonal;
        connectors.Style = new TextStyle() { StrokeColor = "#6495ED", StrokeWidth = 1 };
        connectors.TargetDecorator = new DecoratorSettings
        {
            Shape = DecoratorShape.None,
            Style = new ShapeStyle() { Fill = "#6495ED", StrokeColor = "#6495ED", }
        };
    }

    public class OrgChartDataModel
    {
        public string Id { get; set; }
        public string Team { get; set; }
        public string Role { get; set; }
    }
    private object _dataSource = new List<object>()
    {
        new OrgChartDataModel() { Id = "1", Role = "General Manager" },
        new OrgChartDataModel() { Id = "2", Role = "Human Resource Manager", Team = "1" },
        new OrgChartDataModel() { Id = "3", Role = "Design Manager", Team = "1" },
        new OrgChartDataModel() { Id = "4", Role = "Operation Manager", Team = "1" },
        new OrgChartDataModel() { Id = "5", Role = "Marketing Manager", Team = "1" }
    };
}
A complete working sample can be downloaded from GitHub
How to Update Layout Spacing
The layout supports adding space horizontally and vertically between nodes. Use HorizontalSpacing and VerticalSpacing properties of the layout allow you to set the space between nodes horizontally and vertically.
How to Update Layout Margin
The layout supports adding some blank space between the layout bounds (or viewport) and the layout. The Margin property of the layout allows you to set the blank space.
//Initialize the organizational chart layout with Margin.
<SfDiagramComponent @ref="_diagram" Width="900px" Height="800px" >
  <Layout Type="LayoutType.HierarchicalTree">
     <LayoutMargin Top="@_top" Left="@_left"></LayoutMargin>
  </Layout>
</SfDiagramComponent>
@code
{
    //Initializing the Margin Top and Left value.
    private int _left = 40;
    private int _top = 50;
}
How to Change Orientation
The layout supports customizing the Orientation. Set the desired orientation using LayoutOrientation.
The following code illustrates arranging nodes in a TopToBottom orientation.
//Initialize the layout with layout orientation as BottomToTop in page.
<SfDiagramComponent Height="600px" Width="500px" >
    <Layout Type="LayoutType.HierarchicalTree" @bind-Orientation="@_orientation"></Layout>
</SfDiagramComponent>
@code
{
    //Initializing the orientation value.
    private LayoutOrientation _orientation = LayoutOrientation.TopToBottom;
}
How to Set a Fixed Node Position
The layout supports arranging nodes with reference to the position of a fixed node and set it to the FixedNode of the layout property. This is helpful when you try to expand/collapse a node. It might be expected that the position of the double-clicked node should not be changed.
//Initialize the organizational chart layout with FixedNode.
<SfDiagramComponent Height="600px" Width="500px" >
    <Layout Type="LayoutType.OrganizationalChart" FixedNode="Node1" @bind-HorizontalSpacing="@_horizontalSpacing" @bind-VerticalSpacing="@_verticalSpacing" @bind-Orientation="@_orientation"></Layout>
</SfDiagramComponent>
@code
{
    //Initializing the orientation value.
    private LayoutOrientation _orientation = LayoutOrientation.TopToBottom;
    //Initializing the Horizontal and Vertical value.
    private int _horizontalSpacing = 40;
    private int _verticalSpacing = 50;
}
How to Add Assistant
Assistants are child items that use a different relationship with the parent node. They are laid out in a dedicated part of the tree. A node can be specified as an assistant of its parent by adding it to the assistants property of the argument Assistants.
Use the Root property, define the node set to be the parent of the assistant node. In the Assistant property, define the node set to be assistant for the parent node. Both properties should be defined in the LayoutInfo property.
The following code example illustrates how to add assistants to the layout.
@using Syncfusion.Blazor.Diagram
@using System.Collections.ObjectModel

<SfDiagramComponent @ref="_diagram" Width="900px" Height="800px" >
    <DataSourceSettings DataSource="@_dataSource" ID="Id" ParentID="Manager"></DataSourceSettings>
        <Layout @bind-Type="@_type" @bind-HorizontalSpacing="@_horizontalSpacing" @bind-FixedNode="@_fixedNode" @bind-Orientation="@_oreintation" @bind-VerticalSpacing="@_verticalSpacing" @bind-HorizontalAlignment="@_horizontalAlignment" @bind-VerticalAlignment="@_verticalAlignment" GetLayoutInfo="GetLayoutInfo">
            <LayoutMargin @bind-Top="@_top" @bind-Bottom="@_bottom" @bind-Right="@_right" @bind-Left="@_left"></LayoutMargin>
        </Layout>
        <SnapSettings></SnapSettings>
</SfDiagramComponent>

@code {
    private SfDiagramComponent? _diagram;
    private double _top = 50;
    private double _bottom = 50;
    private double _right = 50;
    private double _left = 50;
    private LayoutType _type = LayoutType.OrganizationalChart;
    private LayoutOrientation _oreintation = LayoutOrientation.BottomToTop;
    private HorizontalAlignment _horizontalAlignment = HorizontalAlignment.Auto;
    private VerticalAlignment _verticalAlignment = VerticalAlignment.Auto;
    private int _horizontalSpacing = 30;
    private int _verticalSpacing = 30;
    private string _pattern;
    private Orientation _subTreeOrientation = Orientation.Vertical;
    private SubTreeAlignmentType _subTreeAlignment = SubTreeAlignmentType.Left;
    private string _fixedNode = null;

    public class HierarchicalDetails
    {
        public string Id { get; set; }
        public string Role { get; set; }
        public string Manager { get; set; }
        public string ChartType { get; set; }
        public string Color { get; set; }
    }
    private TreeInfo GetLayoutInfo(IDiagramObject obj, TreeInfo options)
    {
        Node node = obj as Node;
        if ((node.Data as HierarchicalDetails).Role == "General Manager")
        {
            options.Assistants.Add(options.Children[0]);
            options.Children.RemoveAt(0);
        }
        return options;
    }
    private List<HierarchicalDetails> _dataSource = new List<HierarchicalDetails>()
    {
        new HierarchicalDetails()   { Id = "parent", Role = "Board", Color = "#71AF17" },
        new HierarchicalDetails()   { Id = "1", Role = "General Manager", Manager = "parent", ChartType = "right", Color = "#71AF17" },
        new HierarchicalDetails()   { Id = "11", Role = "Assistant Manager", Manager = "1", Color = "#71AF17" },
        new HierarchicalDetails()   { Id = "2", Role = "Human Resource Manager", Manager = "1", ChartType = "right", Color = "#1859B7" },
        new HierarchicalDetails()   { Id = "3", Role = "Trainers", Manager = "2", Color = "#2E95D8" },
        new HierarchicalDetails()   { Id = "4", Role = "Recruiting Team", Manager = "2", Color = "#2E95D8" },
        new HierarchicalDetails()   { Id = "5", Role = "Finance Asst. Manager", Manager = "2", Color = "#2E95D8" },
        new HierarchicalDetails()   { Id = "6", Role = "Design Manager", Manager = "1", ChartType = "right", Color = "#1859B7" },
        new HierarchicalDetails()   { Id = "7", Role = "Design Supervisor", Manager = "6", Color = "#2E95D8" },
        new HierarchicalDetails()   { Id = "8", Role = "Development Supervisor", Manager = "6", Color = "#2E95D8" },
        new HierarchicalDetails()   { Id = "9", Role = "Drafting Supervisor", Manager = "6", Color = "#2E95D8" },
        new HierarchicalDetails()   { Id = "10", Role = "Operation Manager", Manager = "1", ChartType = "right", Color = "#1859B7" },
        new HierarchicalDetails()   { Id = "11", Role = "Statistic Department", Manager = "10", Color = "#2E95D8" },
        new HierarchicalDetails()   { Id = "12", Role = "Logistic Department", Manager = "10", Color = "#2E95D8" },
        new HierarchicalDetails()   { Id = "16", Role = "Marketing Manager", Manager = "1", ChartType = "right", Color = "#1859B7" },
        new HierarchicalDetails()   { Id = "17", Role = "Oversea sales Manager", Manager = "16", Color = "#2E95D8" },
        new HierarchicalDetails()   { Id = "18", Role = "Petroleum Manager", Manager = "16", Color = "#2E95D8" },
        new HierarchicalDetails()   { Id = "20", Role = "Service Dept. Manager", Manager = "16", Color = "#2E95D8" },
        new HierarchicalDetails()   { Id = "21", Role = "Quality Department", Manager = "16", Color = "#2E95D8" }
    };
}How to Refresh the Layout
The layout can be refreshed at runtime by calling DoLayoutAsync method. Use the following code example to refresh the layout.
//Update the layout at runtime.
_diagram.DoLayoutAsync();

//Here, _diagram is instance of SfDiagramComponent.