Baseline in Blazor Gantt Chart Component
22 Nov 20234 minutes to read
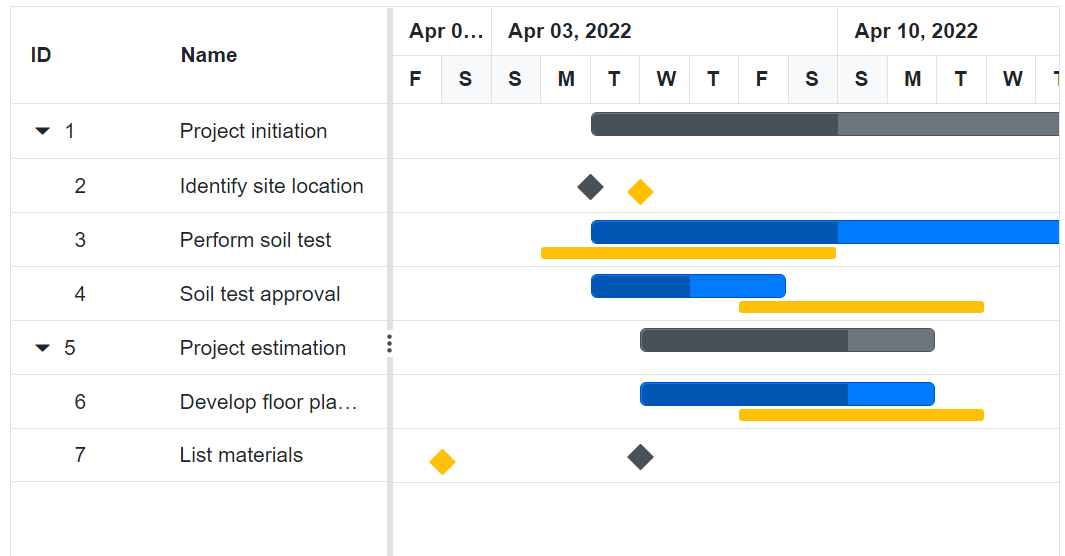
The baseline feature enables users to view the deviation between the planned dates and actual dates of the tasks in a project. Baseline dates or planned dates of a task may or may not be same as the actual task dates. The baseline can be enabled by setting the RenderBaseline property to true and the baseline color can be changed using the BaselineColor property. To render the baseline, you should map the baseline start and end date values from the data source. This can be done using the GanttTaskFields.BaselineStartDate and GanttTaskFields.BaselineEndDate properties. The following code example shows how to enable a baseline in the Gantt Chart component.
@using Syncfusion.Blazor.Gantt
<SfGantt DataSource="@TaskCollection" RenderBaseline="true"
        ProjectStartDate="@ProjectStart" ProjectEndDate="@ProjectEnd" Height="450px" Width="700px">
    <GanttTaskFields Id="TaskId" Name="TaskName" StartDate="StartDate" EndDate="EndDate"
          Duration="Duration" Progress="Progress" ParentID="ParentId" BaselineStartDate="BaselineStartDate"
          BaselineEndDate="BaselineEndDate">
    </GanttTaskFields>
</SfGantt>

@code{
    private DateTime ProjectStart = new DateTime(2022, 04, 01);
    private DateTime ProjectEnd = new DateTime(2022, 04, 30);
    private List<TaskData> TaskCollection { get; set; }
    protected override void OnInitialized()
    {
        this.TaskCollection = GetTaskCollection();
    }

    public class TaskData
    {
        public int TaskId { get; set; }
        public string TaskName { get; set; }
        public DateTime StartDate { get; set; }
        public DateTime? EndDate { get; set; }
        public DateTime? BaselineStartDate { get; set; }
        public DateTime? BaselineEndDate { get; set; }
        public string Duration { get; set; }
        public int Progress { get; set; }
        public int? ParentId { get; set; }
    }

    public static List<TaskData> GetTaskCollection()
    {
        List<TaskData> Tasks = new List<TaskData>()
        {
            new TaskData() { TaskId = 1, TaskName = "Project initiation", StartDate = new DateTime(2022, 04, 05), EndDate = new DateTime(2022, 04, 21), },
            new TaskData() { TaskId = 2, TaskName = "Identify site location", StartDate = new DateTime(2022, 04, 05), BaselineStartDate = new DateTime(2022, 04, 06), BaselineEndDate = new DateTime(2022, 04, 08), Duration = "0", Progress = 70, ParentId = 1 },
            new TaskData() { TaskId = 3, TaskName = "Perform soil test", StartDate = new DateTime(2022, 04, 05), BaselineStartDate = new DateTime(2022, 04, 04), BaselineEndDate = new DateTime(2022, 04, 09), Duration = "8", Progress = 50, ParentId = 1 },
            new TaskData() { TaskId = 4, TaskName = "Soil test approval", StartDate = new DateTime(2022, 04, 05), BaselineStartDate = new DateTime(2022, 04, 08), BaselineEndDate = new DateTime(2022, 04, 12), Duration = "4", Progress = 50, ParentId = 1 },
            new TaskData() { TaskId = 5, TaskName = "Project estimation", StartDate = new DateTime(2022, 04, 06), EndDate = new DateTime(2022, 04, 21), },
            new TaskData() { TaskId = 6, TaskName = "Develop floor plan for estimation", StartDate = new DateTime(2022, 04, 06), BaselineStartDate = new DateTime(2022, 04, 08), BaselineEndDate = new DateTime(2022, 04, 12), Duration = "4", Progress = 70, ParentId = 5 },
            new TaskData() { TaskId = 7, TaskName = "List materials", StartDate = new DateTime(2022, 04, 06), BaselineStartDate = new DateTime(2022, 04, 02), BaselineEndDate = new DateTime(2022, 04, 02), Duration = "0", Progress = 50, ParentId = 5 },
        };
        return Tasks;
    }
}
The following screenshot shows the baselines in Gantt Chart component.
NOTE
You can refer to our Blazor Gantt Chart feature tour page for its groundbreaking feature representations. You can also explore our Blazor Gantt Chart example to know how to render and configure the gantt.