How can I help you?
Events in Blazor HeatMap Chart Component
19 Sep 202424 minutes to read
This section describes the events that will be triggered for appropriate actions in HeatMap. The events should be declared in the HeatMap component using the HeatMapEvents.
CellClicked
When you click on a HeatMap cell, the CellClicked event is triggered. More information about the arguments in this event can be found here. When you right-click on a HeatMap cell, the CellClicked event will be triggered, and the HasRightClicked property in the event argument will be set to true.
The following example demonstrates how to use the CellClicked event. In this example, content will be displayed when you click on a HeatMap cell. Additionally, a dialog box showing the cell value, x-axis label, and y-axis label of the current cell will appear only when you right-click on the HeatMap cell.
@using Syncfusion.Blazor.HeatMap
@using Syncfusion.Blazor.Popups

@if (IsCellClicked)
{
    <div>@CellClicked</div>
}

<SfHeatMap DataSource="@dataSource">
    <HeatMapEvents CellClicked="CellClick"></HeatMapEvents>
    <HeatMapXAxis Labels="@XAxisLabels"></HeatMapXAxis>
    <HeatMapYAxis Labels="@YAxisLabels"></HeatMapYAxis>
    <HeatMapTitleSettings Text="Sales Revenue per Employee (in 1000 US$)">
    </HeatMapTitleSettings>
    <HeatMapCellSettings ShowLabel="true" TileType="CellType.Rect">
        <HeatMapCellBorder Width="1" Radius="4" Color="White"></HeatMapCellBorder>
    </HeatMapCellSettings>
    <HeatMapLegendSettings ShowLabel="true"></HeatMapLegendSettings>
</SfHeatMap>


@if (this.ShowButton)
{
    <SfDialog ResizeHandles="@DialogResizeDirections" AllowDragging="true" Height="200px" Width="300px" EnableResize="true" ShowCloseIcon="true" @bind-Visible="Visibility">
        <DialogPositionData X="@Xvalue" Y="@Yvalue"></DialogPositionData>
        <DialogEvents Closed="@DialogClose"></DialogEvents>
        <DialogTemplates>
            <Header>HeatMap Cell Values</Header>
            <Content>
                <table class="styled-table">
                    <thead>
                        <tr>
                            <th>X-axis Label</th>
                            <th>Y-axis Label</th>
                            <th>Current Cell Value</th>
                        </tr>
                    </thead>
                    <tbody>
                        <tr>
                            <td>@xLabel</td>
                            <td>@yLabel</td>
                            <td>@cellValue</td>
                        </tr>
                    </tbody>
                </table>
            </Content>
        </DialogTemplates>
    </SfDialog>
}

<style>
    .styled-table {
        width: 100%;
        border-collapse: collapse;
    }

        .styled-table th, .styled-table td {
            border: 1px solid black;
            padding: 10px;
            text-align: left;
        }

        .styled-table thead {
            background-color: #f2f2f2;
        }
</style>

@code {
    public bool IsCellClicked = false;
    public string CellClicked;
    public bool ShowButton { get; set; } = false;
    public bool Visibility { get; set; } = false;
    public ResizeDirection[] DialogResizeDirections { get; set; } = new ResizeDirection[] { ResizeDirection.All };
    string[] XAxisLabels = new string[] { "Nancy", "Andrew", "Janet", "Margaret", "Steven", "Michael" };
    string[] YAxisLabels = new string[] { "Mon", "Tue", "Wed", "Thu", "Fri", "Sat" };
    public string xLabel { get; set; }
    public string yLabel { get; set; }
    public double cellValue { get; set; }
    public string Xvalue { get; set; }
    public string Yvalue { get; set; }

    int[,] dataSource = new int[,]
    {
        {73, 39, 26, 39, 94, 0},
        {93, 58, 53, 38, 26, 68},
        {99, 28, 22, 4, 66, 90},
        {14, 26, 97, 69, 69, 3},
        {7, 46, 47, 47, 88, 6},
        {41, 55, 73, 23, 3, 79},
    };

    public void CellClick(Syncfusion.Blazor.HeatMap.CellClickEventArgs args)
    {
        if (args.HasRightClicked)
        {
            Xvalue = args.X;
            Yvalue = args.Y;
            ShowButton = true;
            Visibility = true;
            xLabel = args.XLabel;
            yLabel = args.YLabel;
            cellValue = args.Value;
        } else {
            IsCellClicked = true;
            CellClicked = "The cell clicked event has been triggered!!";
        }
    }

    private void DialogClose(Object args)
    {
        ShowButton = false;
    }
}
CellRendering
The CellRendering event will be triggered before each HeatMap cell is rendered. More information about the arguments in this event can be found here.
The following example demonstrates how to use the CellRendering event to customize the value, color, and border color of the cell.
@using Syncfusion.Blazor.HeatMap

<SfHeatMap DataSource="@dataSource">
    <HeatMapEvents CellRendering="@CellRender"/>
    <HeatMapTitleSettings Text="GDP Growth Rate for Major Economies (in Percentage)"/>
    <HeatMapXAxis Labels="@xAxisLabels"/>
    <HeatMapYAxis Labels="@yAxisLabels"/>
</SfHeatMap>

@code{
    private void CellRender(HeatMapCellRenderEventArgs args)
    {
        if (args.CellValue == "2.2")
        {
            args.CellValue = "UPFRONT TEXT";
            args.CellColor = "#c7afcf";
            args.BorderColor = "Red";
        }
    }
    public double[,] dataSource = new double[2, 2]
    {
            {9.5, 2.2 },
            {4.3, 8.9 }
    };
    public string[] xAxisLabels = new string[] { "China", "India" };
    public string[] yAxisLabels = new string[] { "2008", "2009" };
}
CellSelected
When single or multiple cells in the HeatMap are selected, the CellSelected event is triggered. More information about the arguments in this event can be found here.
The following example demonstrates how to use the CellSelected event to obtain the count and details of the selected cells.
@using Syncfusion.Blazor.HeatMap
@if (IsVisible)
{
<div> Total Selected Cells : <b> @SelectedCellCount </b> </div>
}
<SfHeatMap DataSource="@dataSource" AllowSelection="true">
<HeatMapEvents CellSelected="@CellSelected" />
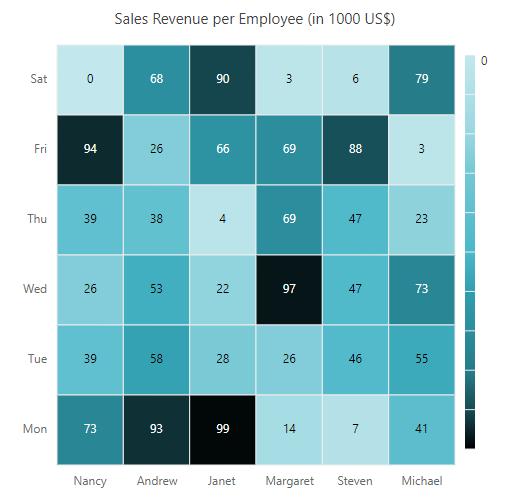
<HeatMapTitleSettings Text="Sales Revenue per Employee (in 1000 US$)" />
<HeatMapXAxis Labels="@xAxisLabels" />
<HeatMapYAxis Labels="@yAxisLabels" />
</SfHeatMap>
@code {
public bool IsVisible = false;
public int SelectedCellCount { get; set; }
private void CellSelected(SelectedEventArgs args)
{
IsVisible = true;
SelectedCellCount = args.Data.Count;
}
public double[,] dataSource = new double[,]
{
{ 73, 39, 26, 39, 94, 0 },
{ 93, 58, 53, 38, 26, 68 },
{ 99, 28, 22, 4, 66, 90 },
{ 14, 26, 97, 69, 69, 3 },
{ 7, 46, 47, 47, 88, 6 },
{ 41, 55, 73, 23, 3, 79 },
{ 56, 69, 21, 86, 3, 33 },
{ 45, 7, 53, 81, 95, 79 },
{ 60, 77, 74, 68, 88, 51 },
{ 25, 25, 10, 12, 78, 14 },
{ 25, 56, 55, 58, 12, 82 },
{ 74, 33, 88, 23, 86, 59 }
};
public string[] xAxisLabels = new string[] { "Nancy", "Andrew", "Janet", "Margaret", "Steven",
"Michael", "Robert", "Laura", "Anne", "Paul", "Karin", "Mario" };
public string[] yAxisLabels = new string[] { "Mon", "Tues", "Wed", "Thurs", "Fri", "Sat" };
}
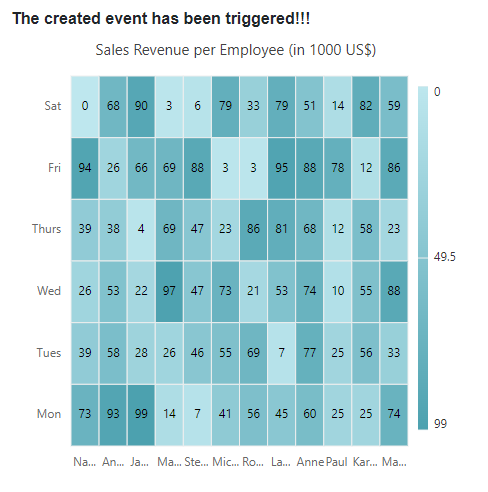
Created
The Created event is triggered during the initial rendering process, that is, immediately after the HeatMap component is initialized. This indicates that this event will be executed only once.
The following example demonstrates how to use the Created event.
@using Syncfusion.Blazor.HeatMap

@if (IsVisible)
{
    <div> <b>@EventText</b> </div>
}
<SfHeatMap DataSource="@dataSource">
    <HeatMapEvents Created="@Created" />
    <HeatMapTitleSettings Text="Sales Revenue per Employee (in 1000 US$)" />
    <HeatMapXAxis Labels="@xAxisLabels" />
    <HeatMapYAxis Labels="@yAxisLabels" />
</SfHeatMap>

@code {
    public bool IsVisible = false;
    public string EventText { get; set; }
    private void Created()
    {
        IsVisible = true;
        EventText = "The created event has been triggered!!!";
    }
    public double[,] dataSource = new double[,]
    {
            { 73, 39, 26, 39, 94, 0 },
            { 93, 58, 53, 38, 26, 68 },
            { 99, 28, 22, 4, 66, 90 },
            { 14, 26, 97, 69, 69, 3 },
            { 7, 46, 47, 47, 88, 6 },
            { 41, 55, 73, 23, 3, 79 },
            { 56, 69, 21, 86, 3, 33 },
            { 45, 7, 53, 81, 95, 79 },
            { 60, 77, 74, 68, 88, 51 },
            { 25, 25, 10, 12, 78, 14 },
            { 25, 56, 55, 58, 12, 82 },
            { 74, 33, 88, 23, 86, 59 }
    };
    public string[] xAxisLabels = new string[] { "Nancy", "Andrew", "Janet", "Margaret", "Steven",
                 "Michael", "Robert", "Laura", "Anne", "Paul", "Karin", "Mario" };
    public string[] yAxisLabels = new string[] { "Mon", "Tues", "Wed", "Thurs", "Fri", "Sat" };
}
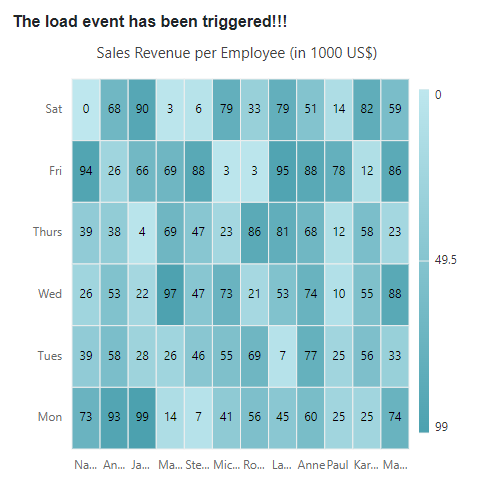
OnLoad
The OnLoad event is triggered before the HeatMap is rendered. More information about the arguments in this event can be found here.
The following example demonstrates how to use the OnLoad event.
@using Syncfusion.Blazor.HeatMap

@if (IsVisible)
{
    <div> <b>@EventText</b> </div>
}
<SfHeatMap DataSource="@dataSource">
    <HeatMapEvents OnLoad="@Load" />
    <HeatMapTitleSettings Text="Sales Revenue per Employee (in 1000 US$)" />
    <HeatMapXAxis Labels="@xAxisLabels" />
    <HeatMapYAxis Labels="@yAxisLabels" />
</SfHeatMap>

@code {
    public bool IsVisible = false;
    public string EventText { get; set; }
    private void Load(LoadedEventArgs args)
    {
        IsVisible = true;
        EventText = "The load event has been triggered!!!";
    }
    public double[,] dataSource = new double[,]
    {
            { 73, 39, 26, 39, 94, 0 },
            { 93, 58, 53, 38, 26, 68 },
            { 99, 28, 22, 4, 66, 90 },
            { 14, 26, 97, 69, 69, 3 },
            { 7, 46, 47, 47, 88, 6 },
            { 41, 55, 73, 23, 3, 79 },
            { 56, 69, 21, 86, 3, 33 },
            { 45, 7, 53, 81, 95, 79 },
            { 60, 77, 74, 68, 88, 51 },
            { 25, 25, 10, 12, 78, 14 },
            { 25, 56, 55, 58, 12, 82 },
            { 74, 33, 88, 23, 86, 59 }
    };
    public string[] xAxisLabels = new string[] { "Nancy", "Andrew", "Janet", "Margaret", "Steven",
                 "Michael", "Robert", "Laura", "Anne", "Paul", "Karin", "Mario" };
    public string[] yAxisLabels = new string[] { "Mon", "Tues", "Wed", "Thurs", "Fri", "Sat" };
}
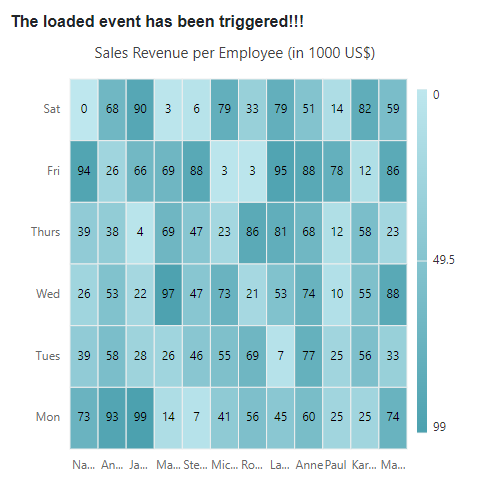
Loaded
The Loaded event is triggered when the HeatMap component is re-rendered during a browser window resize. More information about the arguments in this event can be found here.
The following example demonstrates how to use the Loaded event.
@using Syncfusion.Blazor.HeatMap

@if (IsVisible)
{
    <div> <b>@EventText</b> </div>
}
<SfHeatMap DataSource="@dataSource">
    <HeatMapEvents Loaded="@Loaded" />
    <HeatMapTitleSettings Text="Sales Revenue per Employee (in 1000 US$)" />
    <HeatMapXAxis Labels="@xAxisLabels" />
    <HeatMapYAxis Labels="@yAxisLabels" />
</SfHeatMap>

@code {
    public bool IsVisible = false;
    public string EventText { get; set; }
    private void Loaded(LoadedEventArgs args)
    {
        IsVisible = true;
        EventText = "The loaded event has been triggered!!!";
    }
    public double[,] dataSource = new double[,]
    {
            { 73, 39, 26, 39, 94, 0 },
            { 93, 58, 53, 38, 26, 68 },
            { 99, 28, 22, 4, 66, 90 },
            { 14, 26, 97, 69, 69, 3 },
            { 7, 46, 47, 47, 88, 6 },
            { 41, 55, 73, 23, 3, 79 },
            { 56, 69, 21, 86, 3, 33 },
            { 45, 7, 53, 81, 95, 79 },
            { 60, 77, 74, 68, 88, 51 },
            { 25, 25, 10, 12, 78, 14 },
            { 25, 56, 55, 58, 12, 82 },
            { 74, 33, 88, 23, 86, 59 }
    };
    public string[] xAxisLabels = new string[] { "Nancy", "Andrew", "Janet", "Margaret", "Steven",
                 "Michael", "Robert", "Laura", "Anne", "Paul", "Karin", "Mario" };
    public string[] yAxisLabels = new string[] { "Mon", "Tues", "Wed", "Thurs", "Fri", "Sat" };
}
Resized
When the browser window is resized, the Resized event is triggered. More information about the arguments in this event can be found here.
The following example demonstrates how to use the Resized event.
@using Syncfusion.Blazor.HeatMap

@if (IsVisible)
{
    <div> <b>@EventText</b> </div>
}
<SfHeatMap DataSource="@dataSource">
    <HeatMapEvents Resized="@Resized" />
    <HeatMapTitleSettings Text="Sales Revenue per Employee (in 1000 US$)" />
    <HeatMapXAxis Labels="@xAxisLabels" />
    <HeatMapYAxis Labels="@yAxisLabels" />
</SfHeatMap>

@code {
    public bool IsVisible = false;
    public string EventText { get; set; }
    private void Resized(ResizeEventArgs args)
    {
        IsVisible = true;
        EventText = "The resized event has been triggered!!!";
    }
    public double[,] dataSource = new double[,]
    {
            { 73, 39, 26, 39, 94, 0 },
            { 93, 58, 53, 38, 26, 68 },
            { 99, 28, 22, 4, 66, 90 },
            { 14, 26, 97, 69, 69, 3 },
            { 7, 46, 47, 47, 88, 6 },
            { 41, 55, 73, 23, 3, 79 },
            { 56, 69, 21, 86, 3, 33 },
            { 45, 7, 53, 81, 95, 79 },
            { 60, 77, 74, 68, 88, 51 },
            { 25, 25, 10, 12, 78, 14 },
            { 25, 56, 55, 58, 12, 82 },
            { 74, 33, 88, 23, 86, 59 }
    };
    public string[] xAxisLabels = new string[] { "Nancy", "Andrew", "Janet", "Margaret", "Steven",
                 "Michael", "Robert", "Laura", "Anne", "Paul", "Karin", "Mario" };
    public string[] yAxisLabels = new string[] { "Mon", "Tues", "Wed", "Thurs", "Fri", "Sat" };
}
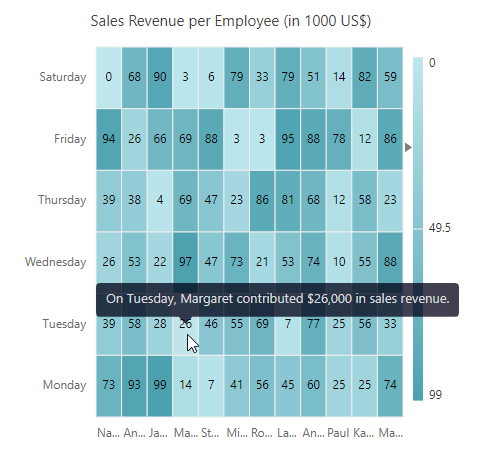
TooltipRendering
The TooltipRendering event is triggered before the tooltip is rendered on the HeatMap cell. More information about the arguments in this event can be found here.
The following example demonstrates how to use the TooltipRendering event to customize tooltips for specific cells when hovering over them.
@using Syncfusion.Blazor.HeatMap

<SfHeatMap DataSource="@dataSource">
    <HeatMapEvents TooltipRendering="@TooltipRendering" />
    <HeatMapTitleSettings Text="Sales Revenue per Employee (in 1000 US$)" />
    <HeatMapXAxis Labels="@xAxisLabels" />
    <HeatMapYAxis Labels="@yAxisLabels" />
</SfHeatMap>

@code {
    private void TooltipRendering(TooltipEventArgs args)
    {
        args.Content = new string[] { $"On {args.YLabel}, {args.XLabel} contributed {args.Value * 1000:C0} in sales revenue." };
    }
    public double[,] dataSource = new double[,]
    {
            { 73, 39, 26, 39, 94, 0 },
            { 93, 58, 53, 38, 26, 68 },
            { 99, 28, 22, 4, 66, 90 },
            { 14, 26, 97, 69, 69, 3 },
            { 7, 46, 47, 47, 88, 6 },
            { 41, 55, 73, 23, 3, 79 },
            { 56, 69, 21, 86, 3, 33 },
            { 45, 7, 53, 81, 95, 79 },
            { 60, 77, 74, 68, 88, 51 },
            { 25, 25, 10, 12, 78, 14 },
            { 25, 56, 55, 58, 12, 82 },
            { 74, 33, 88, 23, 86, 59 }
    };
    public string[] xAxisLabels = new string[] { "Nancy", "Andrew", "Janet", "Margaret", "Steven",
                 "Michael", "Robert", "Laura", "Anne", "Paul", "Karin", "Mario" };
    public string[] yAxisLabels = new string[] { "Monday", "Tuesday", "Wednesday", "Thursday", "Friday", "Saturday" };
}
CellDoubleClicked
When you double-click on a HeatMap cell, the CellDoubleClicked event is triggered. To learn more about the arguments for this event, refer to the documentation here.
The following example demonstrates how to use the CellDoubleClicked event to retrieve the value of a cell, as well as its x-axis and y-axis labels, by performing a double-click action.
@using Syncfusion.Blazor.HeatMap

@if(IsVisible) {
    <div>
        <span> X-Label : <b> @XLabel </b> </span> <br />
        <span> Y-Label : <b> @YLabel </b> </span> <br />
        <span> CellValue : <b> @CellValue </b> </span>
    </div>
}

<SfHeatMap DataSource="@dataSource">
    <HeatMapEvents CellDoubleClicked="@CellDoubleClicked" />
    <HeatMapTitleSettings Text="Sales Revenue per Employee (in 1000 US$)" />
    <HeatMapXAxis Labels="@xAxisLabels" />
    <HeatMapYAxis Labels="@yAxisLabels" />
</SfHeatMap>

@code {
    public bool IsVisible = false;
    public string XLabel { get; set; }
    public string YLabel { get; set; }
    public double CellValue { get; set; }
    private void CellDoubleClicked(CellDoubleClickEventArgs args)
    {
        IsVisible = true;
        XLabel = args.XLabel;
        YLabel = args.YLabel;
        CellValue = args.Value;
    }
    public double[,] dataSource = new double[,]
    {
            { 73, 39, 26, 39, 94, 0 },
            { 93, 58, 53, 38, 26, 68 },
            { 99, 28, 22, 4, 66, 90 },
            { 14, 26, 97, 69, 69, 3 },
            { 7, 46, 47, 47, 88, 6 },
            { 41, 55, 73, 23, 3, 79 },
            { 56, 69, 21, 86, 3, 33 },
            { 45, 7, 53, 81, 95, 79 },
            { 60, 77, 74, 68, 88, 51 },
            { 25, 25, 10, 12, 78, 14 },
            { 25, 56, 55, 58, 12, 82 },
            { 74, 33, 88, 23, 86, 59 }
    };
    public string[] xAxisLabels = new string[] { "Nancy", "Andrew", "Janet", "Margaret", "Steven",
                 "Michael", "Robert", "Laura", "Anne", "Paul", "Karin", "Mario" };
    public string[] yAxisLabels = new string[] { "Mon", "Tues", "Wed", "Thurs", "Fri", "Sat" };
}
LegendRendering
The LegendRendering event is triggered before each legend item is rendered. To learn more about the arguments for this event, refer to the documentation here.
The following example demonstrates how to use the LegendRendering event to customize the value of the text in the legend.
@using Syncfusion.Blazor.HeatMap

<SfHeatMap DataSource="@HeatMapData">
    <HeatMapEvents LegendRendering="@LegendRender" />
    <HeatMapTitleSettings Text="Sales Revenue per Employee (in 1000 US$)">
    </HeatMapTitleSettings>
    <HeatMapXAxis Labels="@XAxisLabels"></HeatMapXAxis>
    <HeatMapYAxis Labels="@YAxisLabels"></HeatMapYAxis>
    <HeatMapCellSettings ShowLabel="true" TileType="CellType.Rect"></HeatMapCellSettings>
    <HeatMapPaletteSettings Type="PaletteType.Gradient">
        <HeatMapPalettes>
            <HeatMapPalette Value="0" Color="#C2E7EC"></HeatMapPalette>
            <HeatMapPalette Value="10" Color="#AEDFE6"></HeatMapPalette>
            <HeatMapPalette Value="20" Color="#9AD7E0"></HeatMapPalette>
            <HeatMapPalette Value="30" Color="#72C7D4"></HeatMapPalette>
            <HeatMapPalette Value="40" Color="#5EBFCE"></HeatMapPalette>
            <HeatMapPalette Value="50" Color="#4AB7C8"></HeatMapPalette>
            <HeatMapPalette Value="60" Color="#309DAE"></HeatMapPalette>
            <HeatMapPalette Value="70" Color="#2B8C9B"></HeatMapPalette>
            <HeatMapPalette Value="80" Color="#257A87"></HeatMapPalette>
            <HeatMapPalette Value="90" Color="#15464D"></HeatMapPalette>
            <HeatMapPalette Value="100" Color="#000000"></HeatMapPalette>
        </HeatMapPalettes>
    </HeatMapPaletteSettings>
    <HeatMapLegendSettings Visible="true"></HeatMapLegendSettings>
</SfHeatMap>


@code {
    public int[,] HeatMapData = new int[,]
    {
        {73, 39, 26, 39, 94, 0},
        {93, 58, 53, 38, 26, 68},
        {99, 28, 22, 4, 66, 90},
        {14, 26, 97, 69, 69, 3},
        {7, 46, 47, 47, 88, 6},
        {41, 55, 73, 23, 3, 79}
    };
    public string[] XAxisLabels = new string[] { "Nancy", "Andrew", "Janet", "Margaret", "Steven", "Michael" };
    public string[] YAxisLabels = new string[] { "Mon", "Tue", "Wed", "Thu", "Fri", "Sat" };
    private void LegendRender(Syncfusion.Blazor.HeatMap.LegendRenderEventArgs args)
    {
        if (args.Text != "0")
        {
            args.Text = "";
        }
    }
}