Palette in Blazor HeatMap Chart Component
23 Jun 20266 minutes to read
In heat map, each data point is displayed as a cell with applied color based on the data value. The palette in the heat map is used to define the color range for cells and gradient type for colors. You can define the colors either in RGB or hex codes using the Color property in the HeatMapPalette. The defined colors are applied to the cell background based on the palette type and cell value.
Palette types
You can display the heat map cells either in gradient colors or fixed colors.
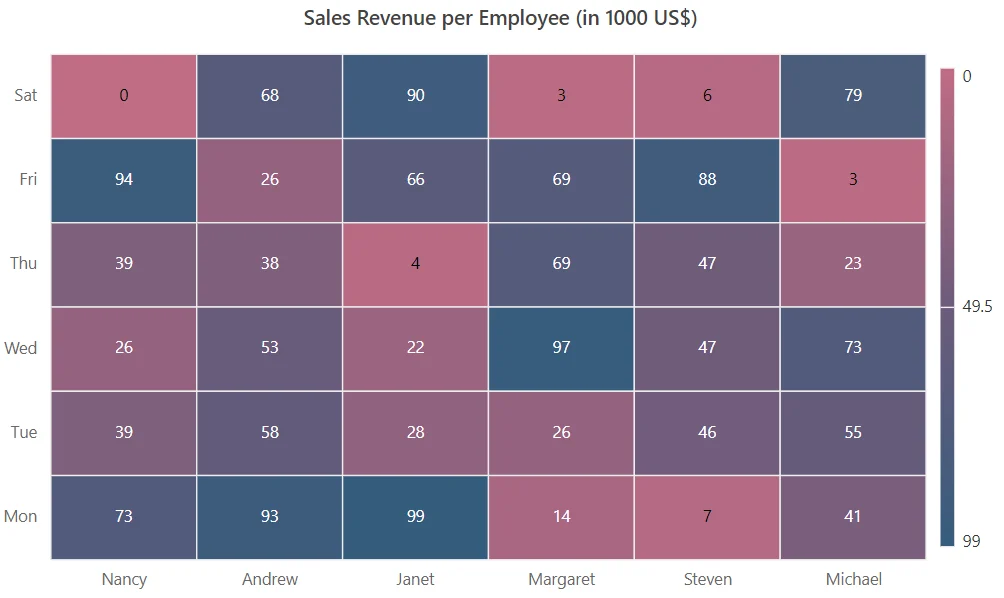
Gradient
The smooth transition between the given palette colors can be applied for the heat map cells based on value. The heat map calculates all the gradient colors between the start and end colors for all distinct data values. Default start color and end color will be considered for gradient calculation, if the colors are not defined. The palette type must be defined as Gradient for the Type property in the HeatMapPaletteSettings property.
@using Syncfusion.Blazor.HeatMap

<SfHeatMap DataSource="@HeatMapData">
    <HeatMapTitleSettings Text="Sales Revenue per Employee (in 1000 US$)">
    </HeatMapTitleSettings>
    <HeatMapXAxis Labels="@XAxisLabels"></HeatMapXAxis>
    <HeatMapYAxis Labels="@YAxisLabels"></HeatMapYAxis>
    <HeatMapCellSettings ShowLabel="true" TileType="CellType.Rect"></HeatMapCellSettings>
    <HeatMapPaletteSettings Type="PaletteType.Gradient">
        <HeatMapPalettes>
            <HeatMapPalette Color="#C06C84"></HeatMapPalette>
            <HeatMapPalette Color="#6C5B7B"></HeatMapPalette>
            <HeatMapPalette Color="#355C7D"></HeatMapPalette>
        </HeatMapPalettes>
    </HeatMapPaletteSettings>
</SfHeatMap>

@code{
    int[,] GetDefaultData()
    {
        int[,] dataSource = new int[,]
        {
            {73, 39, 26, 39, 94, 0},
            {93, 58, 53, 38, 26, 68},
            {99, 28, 22, 4, 66, 90},
            {14, 26, 97, 69, 69, 3},
            {7, 46, 47, 47, 88, 6},
            {41, 55, 73, 23, 3, 79}
        };
        return dataSource;
    }
    string[] XAxisLabels = new string[] {"Nancy", "Andrew", "Janet", "Margaret", "Steven", "Michael" };
    string[] YAxisLabels = new string[] { "Mon", "Tue", "Wed", "Thu", "Fri", "Sat" };
    public object HeatMapData { get; set; }
    protected override void OnInitialized()
    {
        HeatMapData = GetDefaultData();
    }
}
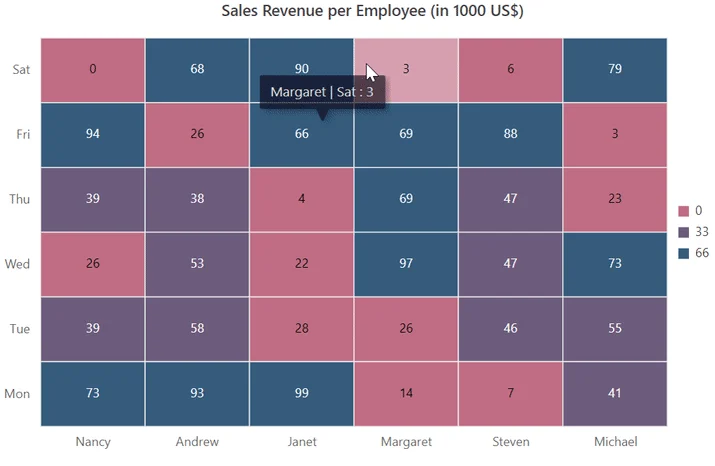
Fixed
In fixed palette type, solid colors are applied to the heat map cells. The data values can be grouped based on the number of colors defined for the heat map. The palette type should be defined as Fixed for the Type property in the HeatMapPaletteSettings property.
@using Syncfusion.Blazor.HeatMap

<SfHeatMap DataSource="@HeatMapData">
    <HeatMapTitleSettings Text="Sales Revenue per Employee (in 1000 US$)">
    </HeatMapTitleSettings>
    <HeatMapXAxis Labels="@XAxisLabels"></HeatMapXAxis>
    <HeatMapYAxis Labels="@YAxisLabels"></HeatMapYAxis>
    <HeatMapCellSettings ShowLabel="true" TileType="CellType.Rect"></HeatMapCellSettings>
    <HeatMapPaletteSettings Type="PaletteType.Fixed">
        <HeatMapPalettes>
            <HeatMapPalette Color="#C06C84"></HeatMapPalette>
            <HeatMapPalette Color="#6C5B7B"></HeatMapPalette>
            <HeatMapPalette Color="#355C7D"></HeatMapPalette>
        </HeatMapPalettes>
    </HeatMapPaletteSettings>
</SfHeatMap>

@code{
    int[,] GetDefaultData()
    {
        int[,] dataSource = new int[,]
        {
            {73, 39, 26, 39, 94, 0},
            {93, 58, 53, 38, 26, 68},
            {99, 28, 22, 4, 66, 90},
            {14, 26, 97, 69, 69, 3},
            {7, 46, 47, 47, 88, 6},
            {41, 55, 73, 23, 3, 79}
        };
        return dataSource;
    }
    string[] XAxisLabels = new string[] {"Nancy", "Andrew", "Janet", "Margaret", "Steven", "Michael" };
    string[] YAxisLabels = new string[] { "Mon", "Tue", "Wed", "Thu", "Fri", "Sat" };
    public object HeatMapData { get; set; }
    protected override void OnInitialized()
    {
        HeatMapData = GetDefaultData();
    }
}