Tooltip in Blazor HeatMap Chart Component
27 Mar 202324 minutes to read
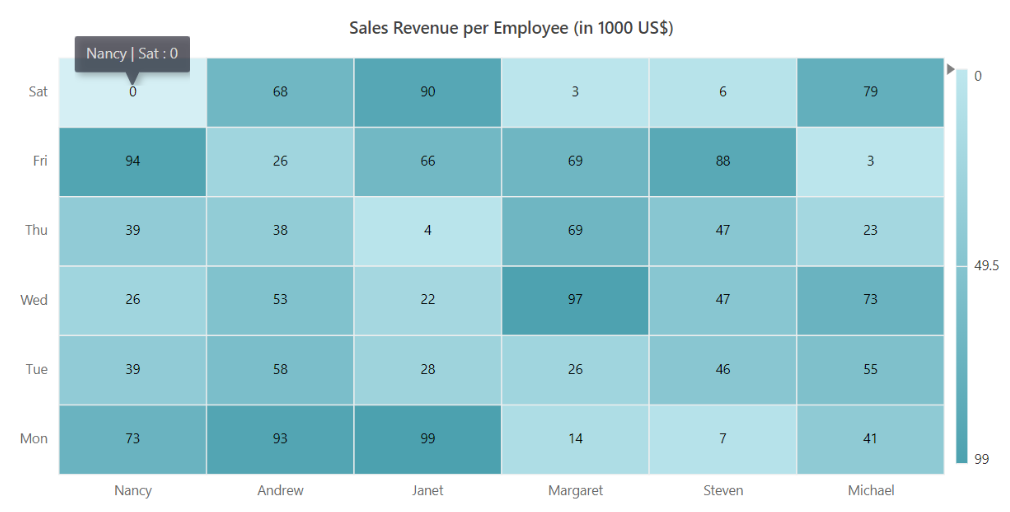
Tooltip is used to provide the details of the heatmap cell, and this can be displayed, while hovering the cursor over the cell or performing tap action in touch devices.
Default tooltip
You can enable the tooltip by setting the Enable property to true inside the HeatMapTooltipSettings.
@using Syncfusion.Blazor.HeatMap

<SfHeatMap DataSource="@HeatMapData">
    <HeatMapTitleSettings Text="Sales Revenue per Employee (in 1000 US$)">
    </HeatMapTitleSettings>
    <HeatMapXAxis Labels="@XAxisLabels"></HeatMapXAxis>
    <HeatMapYAxis Labels="@YAxisLabels"></HeatMapYAxis>
    <HeatMapCellSettings ShowLabel="true" TileType="CellType.Rect"></HeatMapCellSettings>
     <HeatMapTooltipSettings Enable="true"></HeatMapTooltipSettings>
</SfHeatMap>

@code{
    int[,] GetDefaultData()
    {
        int[,] dataSource = new int[,]
        {
            {73, 39, 26, 39, 94, 0},
            {93, 58, 53, 38, 26, 68},
            {99, 28, 22, 4, 66, 90},
            {14, 26, 97, 69, 69, 3},
            {7, 46, 47, 47, 88, 6},
            {41, 55, 73, 23, 3, 79}
        };
        return dataSource;
    }
    string[] XAxisLabels = new string[] {"Nancy", "Andrew", "Janet", "Margaret", "Steven", "Michael" };
    string[] YAxisLabels = new string[] { "Mon", "Tue", "Wed", "Thu", "Fri", "Sat" };
    public object HeatMapData { get; set; }
    protected override void OnInitialized()
    {
        HeatMapData = GetDefaultData();
    }
}
Tooltip template
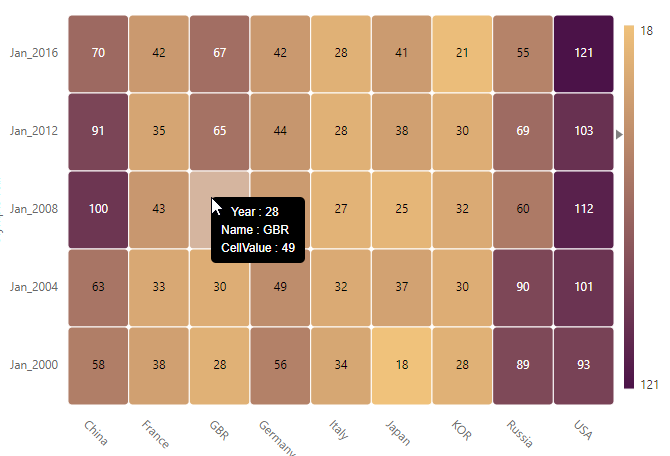
Any custom HTML element can be rendered as a HeatMap tooltip using the Template property of the HeatMapTooltipSettings. The following examples show how to display the tooltip template for different data bindings in the HeatMap.
Array binding
When an array of numbers is specified as the DataSource, you can get the data for the tooltip as a Dictionary<string, string> type. The x-axis label, y-axis label, and cell value can be retrieved from the dictionary using the XLabel, YLabel, and Value keys respectively.
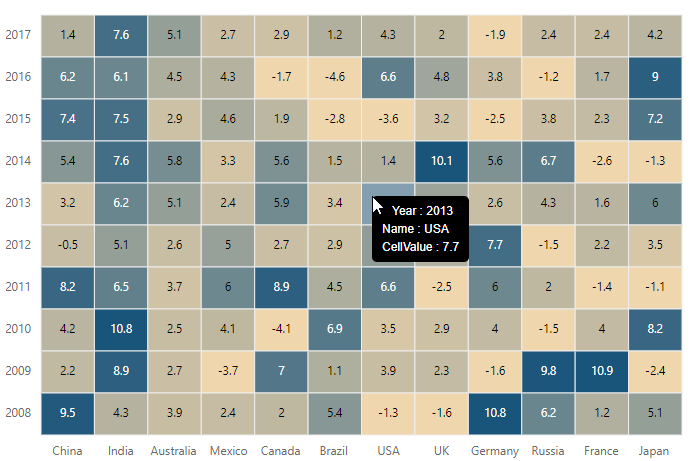
Table
The following example illustrates how to display the tooltip template for array table binding.
@using Syncfusion.Blazor.HeatMap;

<SfHeatMap DataSource="@HeatMapData">
    <HeatMapTitleSettings Text="GDP Growth Rate for Major Economies (in Percentage)">
        <HeatMapTitleTextStyle Size="15px" FontWeight="500" FontStyle="Normal" FontFamily="Segoe UI"></HeatMapTitleTextStyle>
    </HeatMapTitleSettings>
    <HeatMapXAxis Labels="@XAxisLabels"></HeatMapXAxis>
    <HeatMapYAxis Labels="@YAxisLabels"></HeatMapYAxis>
    <HeatMapCellSettings ShowLabel="true"></HeatMapCellSettings>
    <HeatMapTooltipSettings Fill="#265259">
        <Template>
            @{
                var TooltipTemplate = (context as Dictionary<string, string>);
                <div class="displayTemplate">
                    <span class="label">Year : @TooltipTemplate["YLabel"] <br/> Name : @TooltipTemplate["XLabel"] <br> CellValue : @TooltipTemplate["Value"] </span>
                </div>
            }
        </Template>
    </HeatMapTooltipSettings>
    <HeatMapPaletteSettings Type="PaletteType.Gradient">
        <HeatMapPalettes>
            <HeatMapPalette Color="#F0D6AD" Value=-1></HeatMapPalette>
            <HeatMapPalette Color="#9da49a" Value=0></HeatMapPalette>
            <HeatMapPalette Color="#d7c7a7" Value=3.5></HeatMapPalette>
            <HeatMapPalette Color="#6e888f" Value=6.0></HeatMapPalette>
            <HeatMapPalette Color="#466f86" Value=7.5></HeatMapPalette>
            <HeatMapPalette Color="#19547B" Value=10></HeatMapPalette>
        </HeatMapPalettes>
    </HeatMapPaletteSettings>
    <HeatMapLegendSettings Visible="false"></HeatMapLegendSettings>
</SfHeatMap>

<style>
    .displayTemplate {
        border-radius: 5px;
        padding-left: 10px;
        padding-right: 10px;
        padding-bottom: 6px;
        padding-top: 6px;
        background: black;
        border: 1px #919191;
    }

    .label {
        margin-left: 6px;
        padding-left: 4px;
        padding-bottom: 10px;
        color: white;
        font-size: 12px;
    }
</style>

@code {
    double[,] GetDefaultData()
    {
        double[,] dataSource = new double[,]
            {

                {9.5, 2.2, 4.2, 8.2, -0.5, 3.2, 5.4, 7.4, 6.2, 1.4 },

                {4.3, 8.9, 10.8, 6.5, 5.1, 6.2, 7.6, 7.5, 6.1, 7.6 },

                {3.9, 2.7, 2.5, 3.7, 2.6, 5.1, 5.8, 2.9, 4.5, 5.1 },

                {2.4, -3.7, 4.1, 6.0, 5.0, 2.4, 3.3, 4.6, 4.3, 2.7 },

                {2.0, 7.0, -4.1, 8.9, 2.7, 5.9, 5.6, 1.9, -1.7, 2.9 },

                {5.4, 1.1, 6.9, 4.5, 2.9, 3.4, 1.5, -2.8, -4.6, 1.2 },

                {-1.3, 3.9, 3.5, 6.6, 5.2, 7.7, 1.4, -3.6, 6.6, 4.3 },

                {-1.6, 2.3, 2.9, -2.5, 1.3, 4.9, 10.1, 3.2, 4.8, 2.0 },

                {10.8, -1.6, 4.0, 6.0, 7.7, 2.6, 5.6, -2.5, 3.8, -1.9 },

                {6.2, 9.8, -1.5, 2.0, -1.5, 4.3, 6.7, 3.8, -1.2, 2.4 },

                {1.2, 10.9, 4.0, -1.4, 2.2, 1.6, -2.6, 2.3, 1.7, 2.4 },

                {5.1, -2.4, 8.2, -1.1, 3.5, 6.0, -1.3, 7.2, 9.0, 4.2 }
        };
        return dataSource;
    }
    string[] XAxisLabels = new string[] { "China", "India", "Australia", "Mexico", "Canada", "Brazil", "USA", "UK", "Germany", "Russia", "France", "Japan" };
    string[] YAxisLabels = new string[] { "2008", "2009", "2010", "2011", "2012", "2013", "2014", "2015", "2016", "2017" };
    public object HeatMapData { get; set; }
    protected override void OnInitialized()
    {
        HeatMapData = GetDefaultData();
    }
}
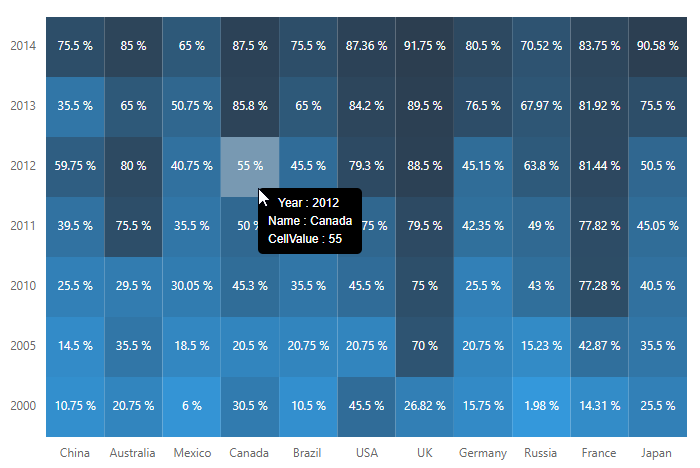
Cell
The following example illustrates how to display the tooltip template for array cell binding.
@using Syncfusion.Blazor.HeatMap;

<SfHeatMap DataSource="@HeatMapData">
    <HeatMapTitleSettings Text="Percentage of Individuals Using Internet by Country">
        <HeatMapTitleTextStyle Size="15px" FontWeight="500" FontStyle="Normal" FontFamily="Segoe UI"></HeatMapTitleTextStyle>
    </HeatMapTitleSettings>
    <HeatMapXAxis Labels="@XAxisLabels"></HeatMapXAxis>
    <HeatMapYAxis Labels="@YAxisLabels"></HeatMapYAxis>
    <HeatMapLegendSettings Visible="false"></HeatMapLegendSettings>
    <HeatMapCellSettings Format="{value} %">
        <HeatMapCellBorder Width="0">
        </HeatMapCellBorder>
        <HeatMapCellTextStyle Color="White"></HeatMapCellTextStyle>
    </HeatMapCellSettings>
    <HeatMapTooltipSettings Fill="#265259">
        <Template>
            @{
                var TooltipTemplate = (context as Dictionary<string, string>);
                <div class="displayTemplate">
                    <span class="label">Year : @TooltipTemplate["YLabel"] <br/> Name : @TooltipTemplate["XLabel"] <br> CellValue : @TooltipTemplate["Value"] </span>
                </div>
            }
        </Template>
    </HeatMapTooltipSettings>
    <HeatMapDataSourceSettings IsJsonData="false" AdaptorType="AdaptorType.Cell"></HeatMapDataSourceSettings>
    <HeatMapPaletteSettings Type="PaletteType.Gradient">
        <HeatMapPalettes>
            <HeatMapPalette Color="#3498DB"></HeatMapPalette>
            <HeatMapPalette Color="#2C3E50"></HeatMapPalette>
        </HeatMapPalettes>
    </HeatMapPaletteSettings>
</SfHeatMap>

<style>
    .displayTemplate {
        border-radius: 5px;
        padding-left: 10px;
        padding-right: 10px;
        padding-bottom: 6px;
        padding-top: 6px;
        background: black;
        border: 1px #919191;
    }

    .label {
        margin-left: 6px;
        padding-left: 4px;
        padding-bottom: 10px;
        color: white;
        font-size: 12px;
    }
</style>

@code {
    double[,] GetDefaultData()
    {
        double[,] dataSource = new double[,]
            {

                {0, 0, 10.75 }, {0, 1, 14.5 }, {0, 2, 25.5 }, {0, 3, 39.5 }, {0, 4, 59.75 }, {0, 5, 35.50 }, {0, 6, 75.5 },

                {1, 0, 20.75 }, {1, 1, 35.5 }, {1, 2, 29.5 }, {1, 3, 75.5 }, {1, 4, 80 }, {1, 5, 65 }, {1, 6, 85 },

                { 2, 0, 6}, {2, 1, 18.5 }, {2, 2, 30.05 }, {2, 3, 35.5 }, {2, 4, 40.75 }, {2, 5, 50.75 }, {2, 6, 65 },

                {3, 0, 30.5 }, {3, 1, 20.5 }, {3, 2, 45.30 }, {3, 3, 50 }, {3, 4, 55 }, {3, 5, 85.80 }, {3, 6, 87.5 },

                {4, 0, 10.5 }, {4, 1, 20.75 }, {4, 2, 35.5 }, {4, 3, 35.5 }, {4, 4, 45.5 }, {4, 5, 65}, {4, 6, 75.5 },

                {5, 0, 45.5 }, {5, 1, 20.75}, {5, 2, 45.5}, {5, 3, 50.75}, {5, 4, 79.30}, {5, 5, 84.20}, {5, 6, 87.36},

                {6, 0, 26.82 }, {6, 1, 70 }, {6, 2, 75 }, {6, 3, 79.5 }, {6, 4, 88.5 }, {6, 5, 89.5 }, {6, 6, 91.75 },

                {7, 0, 15.75 }, {7, 1, 20.75}, {7, 2, 25.5}, {7, 3, 42.35}, {7, 4, 45.15}, {7, 5, 76.5}, {7, 6, 80.5},

                {8, 0, 1.98 }, {8, 1, 15.23 }, {8, 2, 43 }, {8, 3, 49 }, {8, 4, 63.80 }, {8, 5, 67.97 }, {8, 6, 70.52 },

                {9, 0, 14.31 }, {9, 1, 42.87}, {9, 2, 77.28}, {9, 3, 77.82}, {9, 4, 81.44}, {9, 5, 81.92}, {9, 6, 83.75},

                {10, 0, 25.5 }, {10, 1, 35.5 }, {10, 2, 40.5 }, {10, 3, 45.05 }, {10, 4, 50.5 }, {10, 5, 75.5 }, {10, 6, 90.58 }
            };
        return dataSource;
    }
    string[] XAxisLabels = new string[] { "China", "Australia", "Mexico", "Canada", "Brazil", "USA", "UK" , "Germany", "Russia", "France", "Japan" };
    string[] YAxisLabels = new string[] { "2000", "2005", "2010", "2011", "2012", "2013", "2014" };
    public object HeatMapData { get; set; }
    protected override void OnInitialized()
    {
        HeatMapData = GetDefaultData();
    }
}
JSON binding
When a list of JSON objects are specified as DataSource, the data for the tooltip can be obtained as the same JSON object.
Table
The following example illustrates how to display the tooltip template for JSON table binding.
@using Syncfusion.Blazor.HeatMap

<SfHeatMap DataSource="@HeatMapData">
    <HeatMapTitleSettings Text="Olympic Medal Achievements of most Successful Countries">
        <HeatMapTitleTextStyle Size="15px" FontWeight="500" FontStyle="Normal" FontFamily="Segoe UI"></HeatMapTitleTextStyle>
    </HeatMapTitleSettings>
    <HeatMapDataSourceSettings IsJsonData="true" AdaptorType="AdaptorType.Table" XDataMapping="Region"></HeatMapDataSourceSettings>
    <HeatMapXAxis Labels="@XLabels" LabelRotation="45" LabelIntersectAction="LabelIntersectAction.None"></HeatMapXAxis>
    <HeatMapYAxis Labels="@YLabels">
        <HeatMapYAxisTitle Text="Olympic Year"></HeatMapYAxisTitle>
    </HeatMapYAxis>
    <HeatMapPaletteSettings>
        <HeatMapPalettes>
            <HeatMapPalette Color="#F0C27B"></HeatMapPalette>
            <HeatMapPalette Color="#4B1248"></HeatMapPalette>
        </HeatMapPalettes>
    </HeatMapPaletteSettings>
    <HeatMapCellSettings>
        <HeatMapCellBorder Width="1" Radius="4" Color="White"></HeatMapCellBorder>
    </HeatMapCellSettings>
    <HeatMapTooltipSettings Fill="#265259">
        <Template>
            @{
                var TooltipTemplate = (context as RegionalData);
                <div class="displayTemplate">
                    <span class="label">Year : @TooltipTemplate.Jan_2000 <br /> Name : @TooltipTemplate.Region <br> CellValue : @TooltipTemplate.Jan_2008 </span>
                </div>
            }
        </Template>
    </HeatMapTooltipSettings>
</SfHeatMap>

<style>
    .displayTemplate {
        border-radius: 5px;
        padding-left: 10px;
        padding-right: 10px;
        padding-bottom: 6px;
        padding-top: 6px;
        background: black;
        border: 1px #919191;
    }

    .label {
        margin-left: 6px;
        padding-left: 4px;
        padding-bottom: 10px;
        color: white;
        font-size: 12px;
    }
</style>

@code
{
    public string[] XLabels = new string[] { "China", "France", "GBR", "Germany", "Italy", "Japan", "KOR", "Russia", "USA" };
    public string[] YLabels = new string[] { "Jan_2000", "Jan_2004", "Jan_2008", "Jan_2012", "Jan_2016" };
    public class RegionalData
    {
        public string Region { get; set; }
        public int? Jan_2000 { get; set; }
        public int? Jan_2004 { get; set; }
        public int? Jan_2008 { get; set; }
        public int? Jan_2012 { get; set; }
        public int? Jan_2016 { get; set; }
    }
    public RegionalData[] HeatMapData = new RegionalData[]{
        new RegionalData {Region = "USA", Jan_2000 = 93,Jan_2004 = 101,Jan_2008 = 112,Jan_2012 = 103,Jan_2016 = 121 },
        new RegionalData {Region = "GBR", Jan_2000 = 28,Jan_2004 = 30,Jan_2008 = 49,Jan_2012 = 65,Jan_2016 = 67 },
        new RegionalData {Region = "China", Jan_2000 = 58,Jan_2004 = 63,Jan_2008 = 100,Jan_2012 = 91,Jan_2016 = 70 },
        new RegionalData {Region = "Russia", Jan_2000 = 89,Jan_2004 = 90,Jan_2008 = 60,Jan_2012 = 69,Jan_2016 = 55 },
        new RegionalData {Region = "Germany", Jan_2000 = 56,Jan_2004 = 49,Jan_2008 = 41,Jan_2012 = 44,Jan_2016 = 42 },
        new RegionalData {Region = "Japan", Jan_2000 = 18,Jan_2004 = 37,Jan_2008 = 25,Jan_2012 = 38,Jan_2016 = 41 },
        new RegionalData {Region = "France", Jan_2000 = 38,Jan_2004 = 33,Jan_2008 = 43,Jan_2012 = 35,Jan_2016 = 42 },
        new RegionalData {Region = "KOR", Jan_2000 = 28,Jan_2004 = 30,Jan_2008 = 32,Jan_2012 = 30,Jan_2016 = 21 },
        new RegionalData {Region = "Italy", Jan_2000 = 34,Jan_2004 = 32,Jan_2008 = 27,Jan_2012 = 28,Jan_2016 = 28 }
    };
}
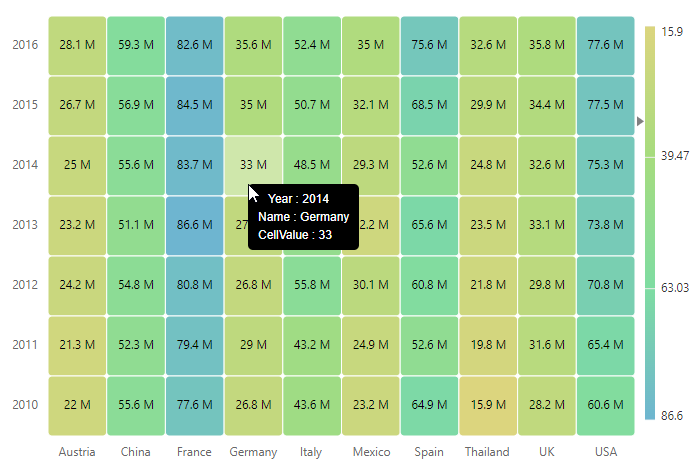
Cell
The following example illustrates how to display the tooltip template for JSON cell binding.
@using Syncfusion.Blazor.HeatMap

<SfHeatMap DataSource="@HeatMapData">
    <HeatMapTitleSettings Text="Most Visited Destinations by International Tourist Arrivals">
        <HeatMapTitleTextStyle Size="15px" FontWeight="500" FontStyle="Normal" FontFamily="Segoe UI"></HeatMapTitleTextStyle>
    </HeatMapTitleSettings>
    <HeatMapDataSourceSettings IsJsonData="true" AdaptorType="AdaptorType.Cell" XDataMapping="RowId" YDataMapping="ColumnId" ValueMapping="Value"></HeatMapDataSourceSettings>
    <HeatMapXAxis Labels="@XLabels"></HeatMapXAxis>
    <HeatMapYAxis Labels="@YLabels"></HeatMapYAxis>
    <HeatMapPaletteSettings>
        <HeatMapPalettes>
            <HeatMapPalette Color="#DCD57E"></HeatMapPalette>
            <HeatMapPalette Color="#A6DC7E"></HeatMapPalette>
            <HeatMapPalette Color="#7EDCA2"></HeatMapPalette>
            <HeatMapPalette Color="#6EB5D0"></HeatMapPalette>
        </HeatMapPalettes>
    </HeatMapPaletteSettings>
    <HeatMapCellSettings ShowLabel="true" Format="{value} M">
        <HeatMapCellBorder Width="1" Radius="4" Color="White"></HeatMapCellBorder>
    </HeatMapCellSettings>
    <HeatMapTooltipSettings Fill="#265259">
        <Template>
            @{
                var TooltipTemplate = (context as SampleData);
                <div class="displayTemplate">
                    <span class="label">Year : @TooltipTemplate.ColumnId <br /> Name : @TooltipTemplate.RowId <br> CellValue : @TooltipTemplate.Value </span>
                </div>
            }
        </Template>
    </HeatMapTooltipSettings>
</SfHeatMap>

<style>
    .displayTemplate {
        border-radius: 5px;
        padding-left: 10px;
        padding-right: 10px;
        padding-bottom: 6px;
        padding-top: 6px;
        background: black;
        border: 1px #919191;
    }

    .label {
        margin-left: 6px;
        padding-left: 4px;
        padding-bottom: 10px;
        color: white;
        font-size: 12px;
    }
</style>

@code {
    public string[] XLabels = new string[] { "Austria", "China", "France", "Germany", "Italy", "Mexico", "Spain", "Thailand", "UK", "USA" };
    public string[] YLabels = new string[] { "2010", "2011", "2012", "2013", "2014", "2015", "2016" };
    public class SampleData
    {
        public string RowId { get; set; }
        public string ColumnId { get; set; }
        public string Value { get; set; }
    }
    public SampleData[] HeatMapData = new SampleData[] {
        new SampleData  { RowId= "France", ColumnId= "2010", Value= "77.6" },
        new SampleData  { RowId= "France", ColumnId= "2011", Value= "79.4" },
        new SampleData  { RowId= "France", ColumnId= "2012", Value= "80.8" },
        new SampleData  { RowId= "France", ColumnId= "2013", Value= "86.6" },
        new SampleData  { RowId= "France", ColumnId= "2014", Value= "83.7" },
        new SampleData  { RowId= "France", ColumnId= "2015", Value= "84.5" },
        new SampleData  { RowId= "France", ColumnId= "2016", Value= "82.6" },
        new SampleData  { RowId= "USA", ColumnId= "2010", Value= "60.6" },
        new SampleData  { RowId= "USA", ColumnId= "2014", Value= "75.3" },
        new SampleData  { RowId= "USA", ColumnId= "2011", Value= "65.4" },
        new SampleData  { RowId= "USA", ColumnId= "2012", Value= "70.8" },
        new SampleData  { RowId= "USA", ColumnId= "2012", Value= "70.8" },
        new SampleData  { RowId= "USA", ColumnId= "2013", Value= "73.8" },
        new SampleData  { RowId= "USA", ColumnId= "2014", Value= "75.3" },
        new SampleData  { RowId= "USA", ColumnId= "2015", Value= "77.5" },
        new SampleData  { RowId= "USA", ColumnId= "2016", Value= "77.6" },
        new SampleData  { RowId= "Spain", ColumnId= "2010", Value= "64.9" },
        new SampleData  { RowId= "Spain", ColumnId= "2011", Value= "52.6" },
        new SampleData  { RowId= "Spain", ColumnId= "2012", Value= "60.8" },
        new SampleData  { RowId= "Spain", ColumnId= "2013", Value= "65.6" },
        new SampleData  { RowId= "Spain", ColumnId= "2014", Value= "52.6" },
        new SampleData  { RowId= "Spain", ColumnId= "2015", Value= "68.5" },
        new SampleData  { RowId= "Spain", ColumnId= "2016", Value= "75.6" },
        new SampleData  { RowId= "China", ColumnId= "2010", Value= "55.6" },
        new SampleData  { RowId= "China", ColumnId= "2011", Value= "52.3" },
        new SampleData  { RowId= "China", ColumnId= "2012", Value= "54.8" },
        new SampleData  { RowId= "China", ColumnId= "2013", Value= "51.1" },
        new SampleData  { RowId= "China", ColumnId= "2014", Value= "55.6" },
        new SampleData  { RowId= "China", ColumnId= "2015", Value= "56.9" },
        new SampleData  { RowId= "China", ColumnId= "2016", Value= "59.3" },
        new SampleData  { RowId= "Italy", ColumnId= "2010", Value= "43.6" },
        new SampleData  { RowId= "Italy", ColumnId= "2011", Value= "43.2" },
        new SampleData  { RowId= "Italy", ColumnId= "2012", Value= "55.8" },
        new SampleData  { RowId= "Italy", ColumnId= "2013", Value= "50.1" },
        new SampleData  { RowId= "Italy", ColumnId= "2014", Value= "48.5" },
        new SampleData  { RowId= "Italy", ColumnId= "2015", Value= "50.7" },
        new SampleData  { RowId= "Italy", ColumnId= "2016", Value= "52.4" },
        new SampleData  { RowId= "UK", ColumnId= "2010", Value= "28.2" },
        new SampleData  { RowId= "UK", ColumnId= "2011", Value= "31.6" },
        new SampleData  { RowId= "UK", ColumnId= "2012", Value= "29.8" },
        new SampleData  { RowId= "UK", ColumnId= "2013", Value= "33.1" },
        new SampleData  { RowId= "UK", ColumnId= "2014", Value= "32.6" },
        new SampleData  { RowId= "UK", ColumnId= "2015", Value= "34.4" },
        new SampleData  { RowId= "UK", ColumnId= "2016", Value= "35.8" },
        new SampleData  { RowId= "Germany", ColumnId= "2010", Value= "26.8" },
        new SampleData  { RowId= "Germany", ColumnId= "2011", Value= "29" },
        new SampleData  { RowId= "Germany", ColumnId= "2012", Value= "26.8" },
        new SampleData  { RowId= "Germany", ColumnId= "2013", Value= "27.6" },
        new SampleData  { RowId= "Germany", ColumnId= "2014", Value= "33" },
        new SampleData  { RowId= "Germany", ColumnId= "2015", Value= "35" },
        new SampleData  { RowId= "Germany", ColumnId= "2016", Value= "35.6" },
        new SampleData  { RowId= "Mexico", ColumnId= "2010", Value= "23.2" },
        new SampleData  { RowId= "Mexico", ColumnId= "2011", Value= "24.9" },
        new SampleData  { RowId= "Mexico", ColumnId= "2012", Value= "30.1" },
        new SampleData  { RowId= "Mexico", ColumnId= "2013", Value= "22.2" },
        new SampleData  { RowId= "Mexico", ColumnId= "2014", Value= "29.3" },
        new SampleData  { RowId= "Mexico", ColumnId= "2015", Value= "32.1" },
        new SampleData  { RowId= "Mexico", ColumnId= "2016", Value= "35" },
        new SampleData  { RowId= "Thailand", ColumnId= "2010", Value= "15.9" },
        new SampleData  { RowId= "Thailand", ColumnId= "2011", Value= "19.8" },
        new SampleData  { RowId= "Thailand", ColumnId= "2012", Value= "21.8" },
        new SampleData  { RowId= "Thailand", ColumnId= "2013", Value= "23.5" },
        new SampleData  { RowId= "Thailand", ColumnId= "2014", Value= "24.8" },
        new SampleData  { RowId= "Thailand", ColumnId= "2015", Value= "29.9" },
        new SampleData  { RowId= "Thailand", ColumnId= "2016", Value= "32.6" },
        new SampleData  { RowId= "Austria", ColumnId= "2010", Value= "22" },
        new SampleData  { RowId= "Austria", ColumnId= "2011", Value= "21.3" },
        new SampleData  { RowId= "Austria", ColumnId= "2012", Value= "24.2" },
        new SampleData  { RowId= "Austria", ColumnId= "2013", Value= "23.2" },
        new SampleData  { RowId= "Austria", ColumnId= "2014", Value= "25" },
        new SampleData  { RowId= "Austria", ColumnId= "2015", Value= "26.7" },
        new SampleData  { RowId= "Austria", ColumnId= "2016", Value= "28.1" }
    };
}