Working with data in Blazor HeatMap Chart Component
23 Jun 202621 minutes to read
This section shows how to bind data to the HeatMap component. The below video demonstrates the same.
HeatMap visualizes the JSON data and two-dimensional array data. Using the data adaptor support, data can be bound to the HeatMap.
Data adaptor
HeatMap supports the following types of data binding with the adaptor support.
- Array
- Table binding
- Cell binding
- JSON data
- Table binding
- Cell binding
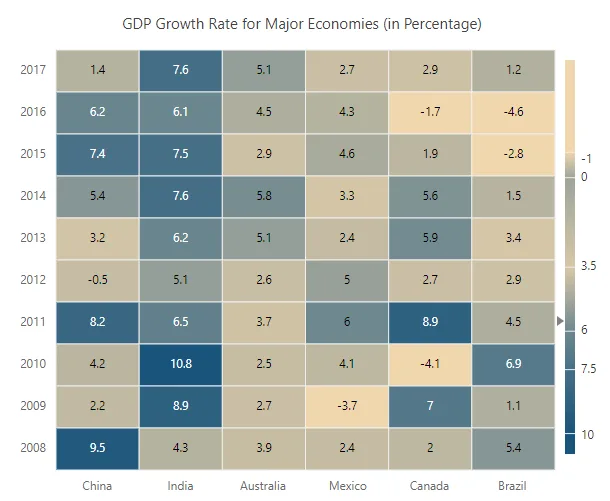
Array - Table binding
This data type is a collection of array of numbers, where each array represents data points for an X-axis data label. This is the default data binding type for HeatMap. You can also directly bind the array of numbers to the DataSource property.
@using Syncfusion.Blazor.HeatMap

<SfHeatMap DataSource="@HeatMapData">
    <HeatMapTitleSettings Text="GDP Growth Rate for Major Economics (in Percentage)">
    </HeatMapTitleSettings>
    <HeatMapXAxis Labels="@XAxisLabels"></HeatMapXAxis>
    <HeatMapYAxis Labels="@YAxisLabels"></HeatMapYAxis>
    <HeatMapPaletteSettings Type="PaletteType.Gradient">
        <HeatMapPalettes>
            <HeatMapPalette Color="#F0D6AD" Value=-1></HeatMapPalette>
            <HeatMapPalette Color="#9da49a" Value=0></HeatMapPalette>
            <HeatMapPalette Color="#d7c7a7" Value=3.5></HeatMapPalette>
            <HeatMapPalette Color="#6e888f" Value=6.0></HeatMapPalette>
            <HeatMapPalette Color="#466f86" Value=7.5></HeatMapPalette>
            <HeatMapPalette Color="#19547B" Value=10></HeatMapPalette>
        </HeatMapPalettes>
    </HeatMapPaletteSettings>
</SfHeatMap>

@code {
    public double[,] GetDefaultData()
    {
        double[,] dataSource = new double[6, 10]
        {
                {9.5, 2.2, 4.2, 8.2, -0.5, 3.2, 5.4, 7.4, 6.2, 1.4 },
                {4.3, 8.9, 10.8, 6.5, 5.1, 6.2, 7.6, 7.5, 6.1, 7.6},
                {3.9, 2.7, 2.5, 3.7, 2.6, 5.1, 5.8, 2.9, 4.5, 5.1},
                {2.4, -3.7, 4.1, 6.0, 5.0, 2.4, 3.3, 4.6, 4.3, 2.7},
                {2.0, 7.0, -4.1, 8.9, 2.7, 5.9, 5.6, 1.9, -1.7, 2.9},
                {5.4, 1.1, 6.9, 4.5, 2.9, 3.4, 1.5, -2.8, -4.6, 1.2}
        };
        return dataSource;
    }
    public string[] XAxisLabels = new string[] { "China", "India", "Australia", "Mexico", "Canada", "Brazil" };
    public string[] YAxisLabels = new string[] { "2008", "2009", "2010", "2011", "2012", "2013", "2014", "2015", "2016", "2017" };
    public object HeatMapData { get; set; }
    protected override void OnInitialized()
    {
        HeatMapData = GetDefaultData();
    }
}
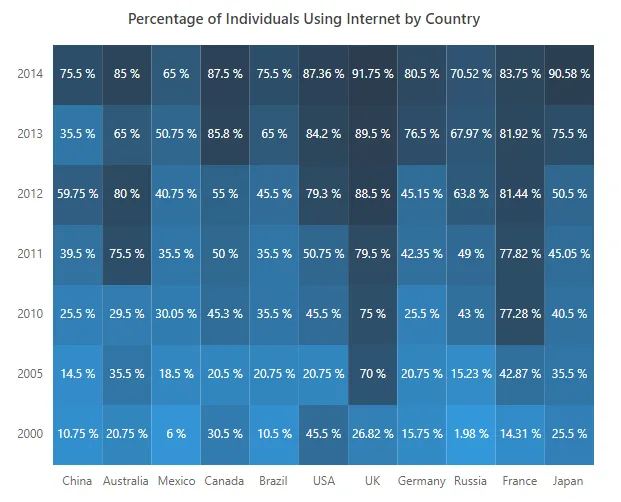
Array - Cell binding
This data type is a collection of array objects that contain information about the row index, column index, and data value for each cell. You can bind the data to HeatMap using the DataSource property and setting the AdaptorType property to Cell.
@using Syncfusion.Blazor.HeatMap

<SfHeatMap DataSource="@HeatMapData">
    <HeatMapTitleSettings Text="Percentage of Individuals Using Internet by Country">
        <HeatMapTitleTextStyle Size="15px" FontWeight="500" FontStyle="Normal" FontFamily="Segoe UI"></HeatMapTitleTextStyle>
    </HeatMapTitleSettings>
    <HeatMapXAxis Labels="@XAxisLabels"></HeatMapXAxis>
    <HeatMapYAxis Labels="@YAxisLabels"></HeatMapYAxis>
    <HeatMapLegendSettings Visible="false"></HeatMapLegendSettings>
    <HeatMapCellSettings Format="{value} %">
        <HeatMapCellBorder Width="0">
        </HeatMapCellBorder>
        <HeatMapCellTextStyle Color="White"></HeatMapCellTextStyle>
    </HeatMapCellSettings>
    <HeatMapDataSourceSettings IsJsonData="false" AdaptorType="AdaptorType.Cell"></HeatMapDataSourceSettings>
    <HeatMapPaletteSettings Type="PaletteType.Gradient">
        <HeatMapPalettes>
            <HeatMapPalette Color="#3498DB"></HeatMapPalette>
            <HeatMapPalette Color="#2C3E50"></HeatMapPalette>
        </HeatMapPalettes>
    </HeatMapPaletteSettings>
</SfHeatMap>

@code {
    public double[,] GetDefaultData()
    {
        double[,] dataSource = new double[,]
            {

                {0, 0, 10.75 }, {0, 1, 14.5 }, {0, 2, 25.5 }, {0, 3, 39.5 }, {0, 4, 59.75 }, {0, 5, 35.50 }, {0, 6, 75.5 },

                {1, 0, 20.75 }, {1, 1, 35.5 }, {1, 2, 29.5 }, {1, 3, 75.5 }, {1, 4, 80 }, {1, 5, 65 }, {1, 6, 85 },

                { 2, 0, 6}, {2, 1, 18.5 }, {2, 2, 30.05 }, {2, 3, 35.5 }, {2, 4, 40.75 }, {2, 5, 50.75 }, {2, 6, 65 },

                {3, 0, 30.5 }, {3, 1, 20.5 }, {3, 2, 45.30 }, {3, 3, 50 }, {3, 4, 55 }, {3, 5, 85.80 }, {3, 6, 87.5 },

                {4, 0, 10.5 }, {4, 1, 20.75 }, {4, 2, 35.5 }, {4, 3, 35.5 }, {4, 4, 45.5 }, {4, 5, 65}, {4, 6, 75.5 },

                {5, 0, 45.5 }, {5, 1, 20.75}, {5, 2, 45.5}, {5, 3, 50.75}, {5, 4, 79.30}, {5, 5, 84.20}, {5, 6, 87.36},

                {6, 0, 26.82 }, {6, 1, 70 }, {6, 2, 75 }, {6, 3, 79.5 }, {6, 4, 88.5 }, {6, 5, 89.5 }, {6, 6, 91.75 },

                {7, 0, 15.75 }, {7, 1, 20.75}, {7, 2, 25.5}, {7, 3, 42.35}, {7, 4, 45.15}, {7, 5, 76.5}, {7, 6, 80.5},

                {8, 0, 1.98 }, {8, 1, 15.23 }, {8, 2, 43 }, {8, 3, 49 }, {8, 4, 63.80 }, {8, 5, 67.97 }, {8, 6, 70.52 },

                {9, 0, 14.31 }, {9, 1, 42.87}, {9, 2, 77.28}, {9, 3, 77.82}, {9, 4, 81.44}, {9, 5, 81.92}, {9, 6, 83.75},

                {10, 0, 25.5 }, {10, 1, 35.5 }, {10, 2, 40.5 }, {10, 3, 45.05 }, {10, 4, 50.5 }, {10, 5, 75.5 }, {10, 6, 90.58 }
            };
        return dataSource;
    }
    public string[] XAxisLabels = new string[] { "China", "Australia", "Mexico", "Canada", "Brazil", "USA", "UK", "Germany", "Russia", "France", "Japan" };
    public string[] YAxisLabels = new string[] { "2000", "2005", "2010", "2011", "2012", "2013", "2014" };
    public object HeatMapData { get; set; }
    protected override void OnInitialized()
    {
        HeatMapData = GetDefaultData();
    }
}
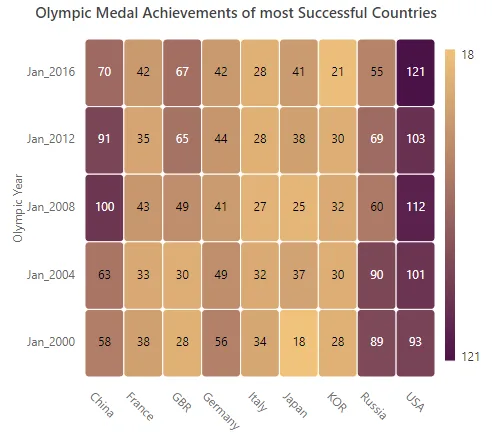
JSON data - Table binding
In JSON table data binding, each JSON object contains an X-axis data point as row header and all the corresponding Y-axis data values. You can bind the JSON table data to the HeatMap using the DataSource property. To achieve this, you should enable the IsJsonData property and define the AdaptorType property as Table. The XDataMapping property is used to map the row header in JSON data.
@using Syncfusion.Blazor.HeatMap

<SfHeatMap DataSource="@HeatMapData">
    <HeatMapTitleSettings Text="Olympic Medal Achievements of most Successful Countries">
        <HeatMapTitleTextStyle Size="15px" FontWeight="500" FontStyle="Normal" FontFamily="Segoe UI"></HeatMapTitleTextStyle>
    </HeatMapTitleSettings>
    <HeatMapDataSourceSettings IsJsonData="true" AdaptorType="AdaptorType.Table" XDataMapping="Region"></HeatMapDataSourceSettings>
    <HeatMapXAxis Labels="@XLabels" LabelRotation="45" LabelIntersectAction="LabelIntersectAction.None"></HeatMapXAxis>
    <HeatMapYAxis Labels="@YLabels">
        <HeatMapYAxisTitle Text="Olympic Year"></HeatMapYAxisTitle>
    </HeatMapYAxis>
    <HeatMapPaletteSettings>
        <HeatMapPalettes>
            <HeatMapPalette Color="#F0C27B"></HeatMapPalette>
            <HeatMapPalette Color="#4B1248"></HeatMapPalette>
        </HeatMapPalettes>
    </HeatMapPaletteSettings>
    <HeatMapCellSettings>
        <HeatMapCellBorder Width="1" Radius="4" Color="White"></HeatMapCellBorder>
    </HeatMapCellSettings>
</SfHeatMap>

@code
{
    public string[] XLabels = new string[] { "China", "France", "GBR", "Germany", "Italy", "Japan", "KOR", "Russia", "USA" };
    public string[] YLabels = new string[] { "Jan_2000", "Jan_2004", "Jan_2008", "Jan_2012", "Jan_2016" };
    public class RegionalData
    {
        public string Region { get; set; }
        public int? Jan_2000 { get; set; }
        public int? Jan_2004 { get; set; }
        public int? Jan_2008 { get; set; }
        public int? Jan_2012 { get; set; }
        public int? Jan_2016 { get; set; }
    }
    public RegionalData[] HeatMapData = new RegionalData[]{
        new RegionalData {Region = "USA", Jan_2000 = 93,Jan_2004 = 101,Jan_2008 = 112,Jan_2012 = 103,Jan_2016 = 121 },
        new RegionalData {Region = "GBR", Jan_2000 = 28,Jan_2004 = 30,Jan_2008 = 49,Jan_2012 = 65,Jan_2016 = 67 },
        new RegionalData {Region = "China", Jan_2000 = 58,Jan_2004 = 63,Jan_2008 = 100,Jan_2012 = 91,Jan_2016 = 70 },
        new RegionalData {Region = "Russia", Jan_2000 = 89,Jan_2004 = 90,Jan_2008 = 60,Jan_2012 = 69,Jan_2016 = 55 },
        new RegionalData {Region = "Germany", Jan_2000 = 56,Jan_2004 = 49,Jan_2008 = 41,Jan_2012 = 44,Jan_2016 = 42 },
        new RegionalData {Region = "Japan", Jan_2000 = 18,Jan_2004 = 37,Jan_2008 = 25,Jan_2012 = 38,Jan_2016 = 41 },
        new RegionalData {Region = "France", Jan_2000 = 38,Jan_2004 = 33,Jan_2008 = 43,Jan_2012 = 35,Jan_2016 = 42 },
        new RegionalData {Region = "KOR", Jan_2000 = 28,Jan_2004 = 30,Jan_2008 = 32,Jan_2012 = 30,Jan_2016 = 21 },
        new RegionalData {Region = "Italy", Jan_2000 = 34,Jan_2004 = 32,Jan_2008 = 27,Jan_2012 = 28,Jan_2016 = 28 }
    };
}
JSON data - Cell binding
In JSON cell data binding, each JSON object consists a value for each cell along with a mapping value for row and column. You can bind the JSON cell data having information for each cell to the HeatMap using the DataSource property. To achieve this, you should define the AdaptorType property as Cell, and enable the IsJsonData property. Now, map the fields of data by using the ValueMapping, XDataMapping and YDataMapping properties.
@using Syncfusion.Blazor.HeatMap

<SfHeatMap DataSource="@HeatMapData">
    <HeatMapTitleSettings Text="Most Visited Destinations by International Tourist Arrivals">
        <HeatMapTitleTextStyle Size="15px" FontWeight="500" FontStyle="Normal" FontFamily="Segoe UI"></HeatMapTitleTextStyle>
    </HeatMapTitleSettings>
    <HeatMapDataSourceSettings IsJsonData="true" AdaptorType="AdaptorType.Cell" XDataMapping="RowId" YDataMapping="ColumnId" ValueMapping="Value"></HeatMapDataSourceSettings>
    <HeatMapXAxis Labels="@XLabels"></HeatMapXAxis>
    <HeatMapYAxis Labels="@YLabels"></HeatMapYAxis>
    <HeatMapPaletteSettings>
        <HeatMapPalettes>
            <HeatMapPalette Color="#DCD57E"></HeatMapPalette>
            <HeatMapPalette Color="#A6DC7E"></HeatMapPalette>
            <HeatMapPalette Color="#7EDCA2"></HeatMapPalette>
            <HeatMapPalette Color="#6EB5D0"></HeatMapPalette>
        </HeatMapPalettes>
    </HeatMapPaletteSettings>
    <HeatMapCellSettings ShowLabel="true" Format="{value} M">
        <HeatMapCellBorder Width="1" Radius="4" Color="White"></HeatMapCellBorder>
    </HeatMapCellSettings>
</SfHeatMap>

@code {
    public string[] XLabels = new string[] { "Austria", "China", "France", "Germany", "Italy", "Mexico", "Spain", "Thailand", "UK", "USA" };
    public string[] YLabels = new string[] { "2010", "2011", "2012", "2013", "2014", "2015", "2016" };
    public class SampleData
    {
        public string RowId { get; set; }
        public string ColumnId { get; set; }
        public string Value { get; set; }
    }
    public SampleData[] HeatMapData = new SampleData[] {
        new SampleData  { RowId= "France", ColumnId= "2010", Value= "77.6" },
        new SampleData  { RowId= "France", ColumnId= "2011", Value= "79.4" },
        new SampleData  { RowId= "France", ColumnId= "2012", Value= "80.8" },
        new SampleData  { RowId= "France", ColumnId= "2013", Value= "86.6" },
        new SampleData  { RowId= "France", ColumnId= "2014", Value= "83.7" },
        new SampleData  { RowId= "France", ColumnId= "2015", Value= "84.5" },
        new SampleData  { RowId= "France", ColumnId= "2016", Value= "82.6" },
        new SampleData  { RowId= "USA", ColumnId= "2010", Value= "60.6" },
        new SampleData  { RowId= "USA", ColumnId= "2014", Value= "75.3" },
        new SampleData  { RowId= "USA", ColumnId= "2011", Value= "65.4" },
        new SampleData  { RowId= "USA", ColumnId= "2012", Value= "70.8" },
        new SampleData  { RowId= "USA", ColumnId= "2012", Value= "70.8" },
        new SampleData  { RowId= "USA", ColumnId= "2013", Value= "73.8" },
        new SampleData  { RowId= "USA", ColumnId= "2014", Value= "75.3" },
        new SampleData  { RowId= "USA", ColumnId= "2015", Value= "77.5" },
        new SampleData  { RowId= "USA", ColumnId= "2016", Value= "77.6" },
        new SampleData  { RowId= "Spain", ColumnId= "2010", Value= "64.9" },
        new SampleData  { RowId= "Spain", ColumnId= "2011", Value= "52.6" },
        new SampleData  { RowId= "Spain", ColumnId= "2012", Value= "60.8" },
        new SampleData  { RowId= "Spain", ColumnId= "2013", Value= "65.6" },
        new SampleData  { RowId= "Spain", ColumnId= "2014", Value= "52.6" },
        new SampleData  { RowId= "Spain", ColumnId= "2015", Value= "68.5" },
        new SampleData  { RowId= "Spain", ColumnId= "2016", Value= "75.6" },
        new SampleData  { RowId= "China", ColumnId= "2010", Value= "55.6" },
        new SampleData  { RowId= "China", ColumnId= "2011", Value= "52.3" },
        new SampleData  { RowId= "China", ColumnId= "2012", Value= "54.8" },
        new SampleData  { RowId= "China", ColumnId= "2013", Value= "51.1" },
        new SampleData  { RowId= "China", ColumnId= "2014", Value= "55.6" },
        new SampleData  { RowId= "China", ColumnId= "2015", Value= "56.9" },
        new SampleData  { RowId= "China", ColumnId= "2016", Value= "59.3" },
        new SampleData  { RowId= "Italy", ColumnId= "2010", Value= "43.6" },
        new SampleData  { RowId= "Italy", ColumnId= "2011", Value= "43.2" },
        new SampleData  { RowId= "Italy", ColumnId= "2012", Value= "55.8" },
        new SampleData  { RowId= "Italy", ColumnId= "2013", Value= "50.1" },
        new SampleData  { RowId= "Italy", ColumnId= "2014", Value= "48.5" },
        new SampleData  { RowId= "Italy", ColumnId= "2015", Value= "50.7" },
        new SampleData  { RowId= "Italy", ColumnId= "2016", Value= "52.4" },
        new SampleData  { RowId= "UK", ColumnId= "2010", Value= "28.2" },
        new SampleData  { RowId= "UK", ColumnId= "2011", Value= "31.6" },
        new SampleData  { RowId= "UK", ColumnId= "2012", Value= "29.8" },
        new SampleData  { RowId= "UK", ColumnId= "2013", Value= "33.1" },
        new SampleData  { RowId= "UK", ColumnId= "2014", Value= "32.6" },
        new SampleData  { RowId= "UK", ColumnId= "2015", Value= "34.4" },
        new SampleData  { RowId= "UK", ColumnId= "2016", Value= "35.8" },
        new SampleData  { RowId= "Germany", ColumnId= "2010", Value= "26.8" },
        new SampleData  { RowId= "Germany", ColumnId= "2011", Value= "29" },
        new SampleData  { RowId= "Germany", ColumnId= "2012", Value= "26.8" },
        new SampleData  { RowId= "Germany", ColumnId= "2013", Value= "27.6" },
        new SampleData  { RowId= "Germany", ColumnId= "2014", Value= "33" },
        new SampleData  { RowId= "Germany", ColumnId= "2015", Value= "35" },
        new SampleData  { RowId= "Germany", ColumnId= "2016", Value= "35.6" },
        new SampleData  { RowId= "Mexico", ColumnId= "2010", Value= "23.2" },
        new SampleData  { RowId= "Mexico", ColumnId= "2011", Value= "24.9" },
        new SampleData  { RowId= "Mexico", ColumnId= "2012", Value= "30.1" },
        new SampleData  { RowId= "Mexico", ColumnId= "2013", Value= "22.2" },
        new SampleData  { RowId= "Mexico", ColumnId= "2014", Value= "29.3" },
        new SampleData  { RowId= "Mexico", ColumnId= "2015", Value= "32.1" },
        new SampleData  { RowId= "Mexico", ColumnId= "2016", Value= "35" },
        new SampleData  { RowId= "Thailand", ColumnId= "2010", Value= "15.9" },
        new SampleData  { RowId= "Thailand", ColumnId= "2011", Value= "19.8" },
        new SampleData  { RowId= "Thailand", ColumnId= "2012", Value= "21.8" },
        new SampleData  { RowId= "Thailand", ColumnId= "2013", Value= "23.5" },
        new SampleData  { RowId= "Thailand", ColumnId= "2014", Value= "24.8" },
        new SampleData  { RowId= "Thailand", ColumnId= "2015", Value= "29.9" },
        new SampleData  { RowId= "Thailand", ColumnId= "2016", Value= "32.6" },
        new SampleData  { RowId= "Austria", ColumnId= "2010", Value= "22" },
        new SampleData  { RowId= "Austria", ColumnId= "2011", Value= "21.3" },
        new SampleData  { RowId= "Austria", ColumnId= "2012", Value= "24.2" },
        new SampleData  { RowId= "Austria", ColumnId= "2013", Value= "23.2" },
        new SampleData  { RowId= "Austria", ColumnId= "2014", Value= "25" },
        new SampleData  { RowId= "Austria", ColumnId= "2015", Value= "26.7" },
        new SampleData  { RowId= "Austria", ColumnId= "2016", Value= "28.1" }
    };
}
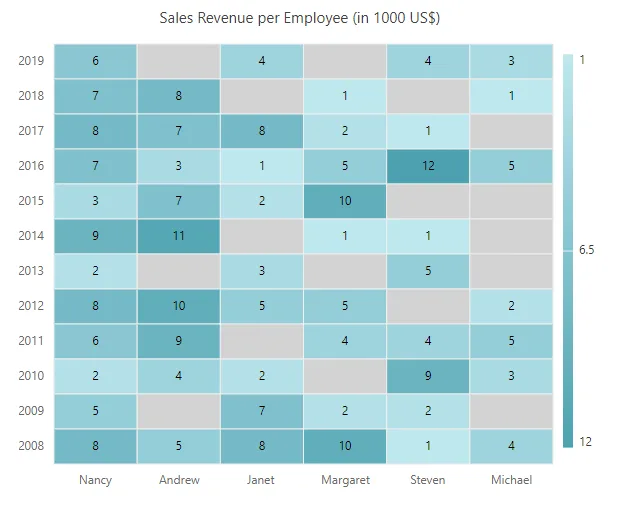
Empty points
The data points that use the null value are considered as empty points. Empty data points are ignored and not displayed in the HeatMap, and these points are rendered with default palette. You can customize the empty data point color value using the EmptyPointColor property.
@using Syncfusion.Blazor.HeatMap

<SfHeatMap DataSource="@HeatMapData">
    <HeatMapTitleSettings Text="Sales Revenue per Employee (in 1000 US$)">
    </HeatMapTitleSettings>
    <HeatMapXAxis Labels="@XAxisLabels"></HeatMapXAxis>
    <HeatMapYAxis Labels="@YAxisLabels"></HeatMapYAxis>
    <HeatMapPaletteSettings EmptyPointColor="#d3d3d3">
    </HeatMapPaletteSettings>
</SfHeatMap>

@code {
    public int?[,] GetDefaultData()
    {
        int?[,] dataSource = new int?[6, 12]
        {
                {8, 5, 2, 6, 8, 2, 9, 3, 7, 8, 7, 6},
                {5, null, 4, 9, 10, null, 11, 7, 3, 7, 8, null},
                {8, 7, 2, null, 5, 3, null, 2, 1, 8, null, 4},
                {10, 2, null, 4, 5, null, 1, 10, 5, 2, 1, null},
                {1, 2, 9, 4, null, 5, 1, null, 12, 1, null, 4},
                {4, null, 3, 5, 2, null, null, null, 5, null, 1, 3},
        };
        return dataSource;
    }
    public string[] XAxisLabels = new string[] { "Nancy", "Andrew", "Janet", "Margaret", "Steven", "Michael", "Robert", "Laura", "Anne", "Paul", "Karin", "Mario" };
    public string[] YAxisLabels = new string[] { "2008", "2009", "2010", "2011", "2012", "2013", "2014", "2015", "2016", "2017", "2018", "2019" };
    public object HeatMapData { get; set; }
    protected override void OnInitialized()
    {
        HeatMapData = GetDefaultData();
    }
}