Bubble in Blazor Maps Component
23 Jun 202616 minutes to read
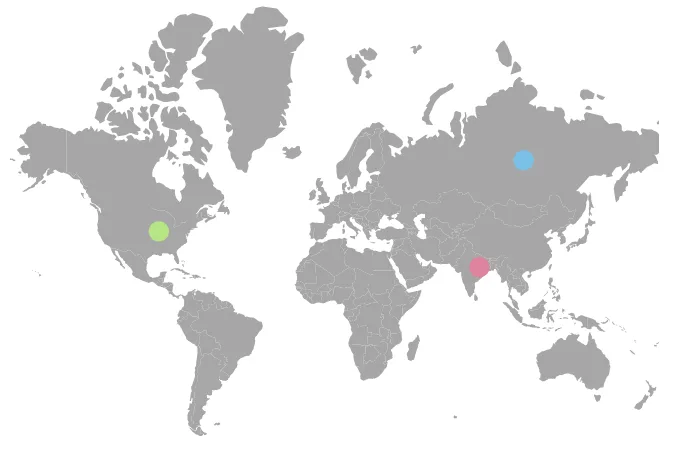
Bubbles in the Maps control represent underlying data values. They render over map shapes that have corresponding data in the data source. Enable bubbles by setting the Visible property of MapsBubble to true. To add bubbles, bind the data source to the DataSource property of MapsBubble and set the numeric field name in the ValuePath property.
@using Syncfusion.Blazor.Maps

<SfMaps>
    <MapsLayers>
        <MapsLayer ShapeData='new {dataOptions ="https://cdn.syncfusion.com/maps/map-data/world-map.json"}'
                   DataSource="PopulationDetails" ShapeDataPath="Name" ShapePropertyPath='new string[] {"name"}' TValue="Country">
            @* To add bubbles based on population count *@
            <MapsBubbleSettings>
                <MapsBubble Visible="true" ValuePath="Population" ColorValuePath="Color" DataSource="PopulationDetails" TValue="Country">
                </MapsBubble>
            </MapsBubbleSettings>
        </MapsLayer>
    </MapsLayers>
</SfMaps>

@code {
    public class Country
    {
        public string Name { get; set; }
        public double Population { get; set; }
        public string Color { get; set; }
    };

    public List<Country> PopulationDetails = new List<Country> {
        new Country
        {
            Name = "United States", Population = 325020000, Color = "#b5e485"
        },
        new Country
        {
            Name = "Russia", Population = 142905208, Color = "#7bc1e8"
        },
       new Country
        {
            Name ="India", Population=1198003000, Color = "#df819c"
        }
    };
}
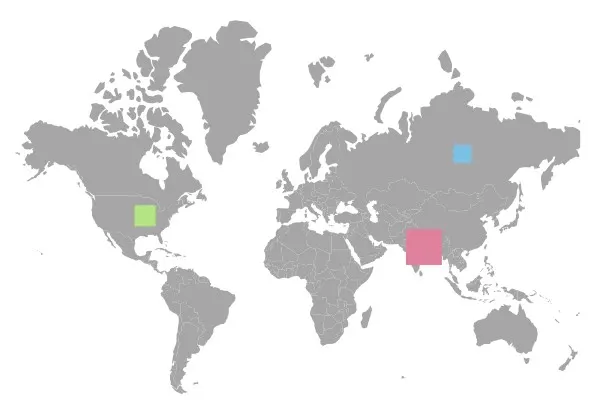
Bubble shapes
The following bubble shapes are available in Maps:
- Circle
- Square
By default, bubbles render as Circle. To render squares, set the BubbleType property of MapsBubble to Square.
@using Syncfusion.Blazor.Maps

<SfMaps>
    <MapsLayers>
        <MapsLayer ShapeData='new {dataOptions ="https://cdn.syncfusion.com/maps/map-data/world-map.json"}'
                   ShapeDataPath="Name" ShapePropertyPath='new string[] {"name"}' TValue="Country">
            @* To add bubbles based on population count *@
            <MapsBubbleSettings>
                <MapsBubble Visible="true" ValuePath="Population" ColorValuePath="Color" DataSource="PopulationDetails"
                            BubbleType="Syncfusion.Blazor.Maps.BubbleType.Square" TValue="Country">
                </MapsBubble>
            </MapsBubbleSettings>
        </MapsLayer>
    </MapsLayers>
</SfMaps>

@code {
    public class Country
    {
        public string Name { get; set; }
        public double Population { get; set; }
        public string Color { get; set; }
    };
    public List<Country> PopulationDetails = new List<Country> {
        new Country
        {
            Name = "United States", Population = 325020000, Color = "#b5e485"
        },
        new Country
        {
            Name = "Russia", Population = 142905208, Color = "#7bc1e8"
        },
       new Country
        {
            Name ="India", Population=1198003000, Color = "#df819c"
        }
    };
}
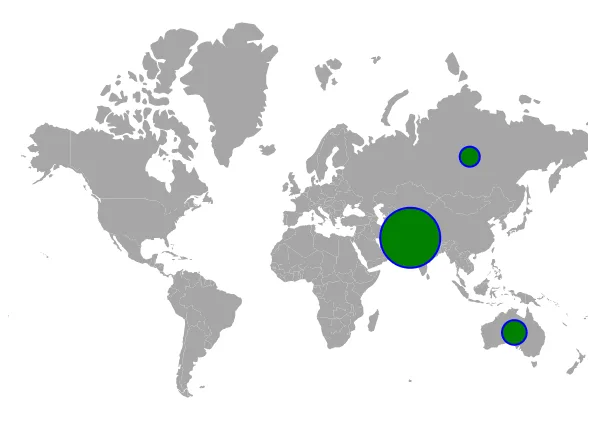
Customization
Use the following MapsBubble APIs to customize bubble appearance:
- MapsBubbleBorder - Specifies the bubble’s outline style.
- Fill - Specifies the bubble interior color.
- Opacity - Specifies bubble transparency from 0 (transparent) to 1 (opaque).
- AnimationDelay - Specifies delay before the bubble animation starts (milliseconds).
- AnimationDuration - Specifies how long the bubble animation runs (milliseconds).
@using Syncfusion.Blazor.Maps

<SfMaps>
    <MapsLayers>
        <MapsLayer ShapeData='new {dataOptions ="https://cdn.syncfusion.com/maps/map-data/world-map.json"}'
                   ShapeDataPath="Name" ShapePropertyPath='new string[] {"name"}' TValue="Country">
            @* To add bubbles based on population count *@
            <MapsBubbleSettings>
                <MapsBubble Visible="true" ValuePath="Population" Fill="green" MinRadius=5 MaxRadius=40 AnimationDelay=100 AnimationDuration=1000 Opacity=1 DataSource="PopulationDetails" TValue="Country">
                    <MapsBubbleBorder Color="blue" Width=2></MapsBubbleBorder>
                </MapsBubble>
            </MapsBubbleSettings>
        </MapsLayer>
    </MapsLayers>
</SfMaps>

@code {
    public class Country
    {
        public string Name { get; set; }
        public double Population { get; set; }
    };

    public List<Country> PopulationDetails = new List<Country> {
       new Country
       {
           Name = "Australia", Population = 325020000
       },
       new Country
       {
           Name = "Russia", Population = 142905208
       },
       new Country
       {
           Name = "India", Population = 1198003000
       }
    };
}
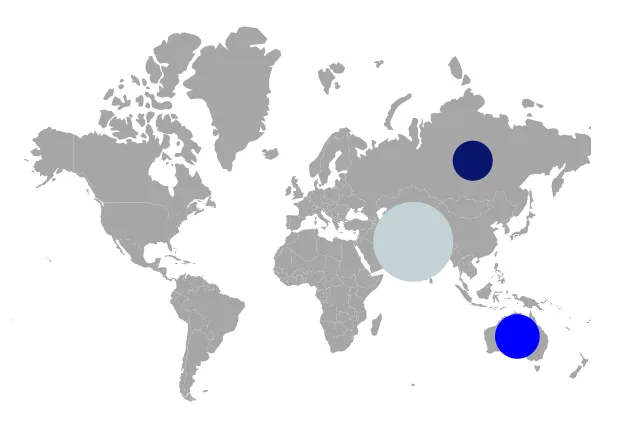
Setting colors to the bubbles from the data source
Assign each bubble colors using the ColorValuePath property of MapsBubble. Set this to the field in the bubble data source that contains color values.
@using Syncfusion.Blazor.Maps

<SfMaps>
    <MapsLayers>
        <MapsLayer ShapeData='new {dataOptions ="https://cdn.syncfusion.com/maps/map-data/world-map.json"}'
                   ShapeDataPath="Name" ShapePropertyPath='new string[] {"name"}' TValue="Country">
            @* To add bubbles based on population count *@
            <MapsBubbleSettings>
                <MapsBubble Visible="true" ValuePath="Population" ColorValuePath="Color" MinRadius=20 MaxRadius=40
                            DataSource="PopulationDetails" TValue="Country">
                </MapsBubble>
            </MapsBubbleSettings>
        </MapsLayer>
    </MapsLayers>
</SfMaps>

@code {
    public class Country
    {
        public string Name { get; set; }
        public double Population { get; set; }
        public string Color { get; set; }
    };

    public List<Country> PopulationDetails = new List<Country> {
       new Country
       {
           Name = "Australia", Population = 325020000, Color = "#0000FF"
       },
       new Country
       {
           Name = "Russia", Population = 142905208, Color = "#09156D"
       },
       new Country
       {
           Name = "India", Population = 1198003000, Color = "#C2D2D6"
       }
    };
}
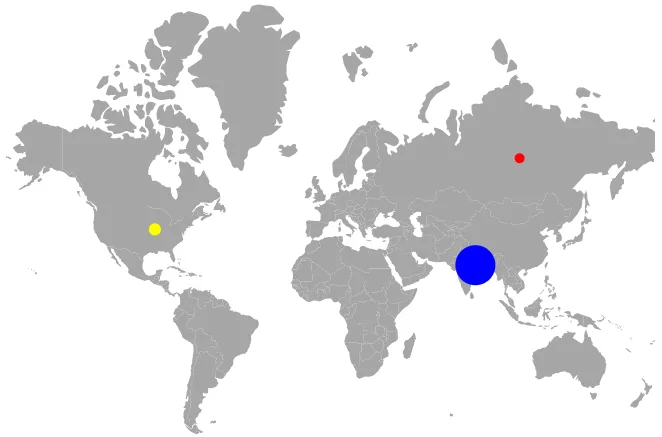
Setting the range of the bubble size
Bubble size is computed from the values specified by ValuePath property. Control the radius range using MinRadius and MaxRadius properties.
@using Syncfusion.Blazor.Maps

<SfMaps>
    <MapsLayers>
        <MapsLayer ShapeData='new {dataOptions ="https://cdn.syncfusion.com/maps/map-data/world-map.json"}'
                   DataSource="PopulationDetails" ShapeDataPath="Name" ShapePropertyPath='new string[] {"name"}' TValue="PopulationDetail">
            <MapsBubbleSettings>
                <MapsBubble Visible="true" ValuePath="Density" ColorValuePath="Color" MinRadius="5" MaxRadius="20"
                            DataSource="PopulationDetails" TValue="PopulationDetail">
                </MapsBubble>
            </MapsBubbleSettings>
        </MapsLayer>
    </MapsLayers>
</SfMaps>

@code {
    public class PopulationDetail
    {
        public string Name { get; set; }
        public double Population { get; set; }
        public double Density { get; set; }
        public string Color { get; set; }
    };

    public List<PopulationDetail> PopulationDetails = new List<PopulationDetail> {
       new PopulationDetail
       {
           Name = "United States", Population = 325020000, Density = 33, Color = "yellow"
       },
       new PopulationDetail
       {
           Name = "Russia", Population = 142905208, Density = 8.3, Color = "red"
       },
       new PopulationDetail
       {
           Name = "India", Population = 1198003000, Density = 364, Color = "blue"
       }
    };
}
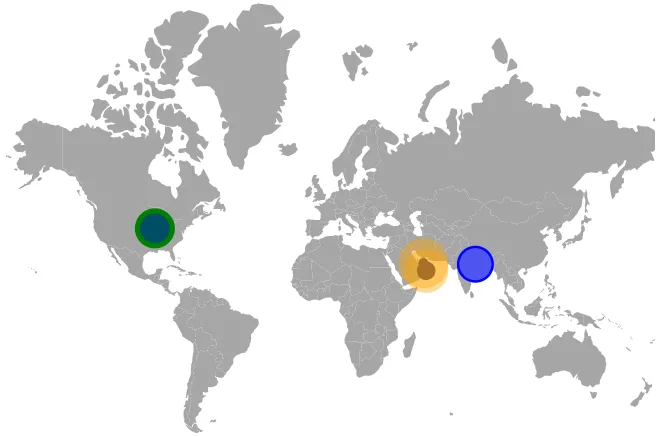
Multiple bubble groups
Add multiple bubble groups by defining more than one MapsBubble within MapsBubbleSettings. Each group can use distinct settings. The following example shows gender-wise population ratios using two bubble groups.
@using Syncfusion.Blazor.Maps

<SfMaps>
    <MapsLayers>
        <MapsLayer ShapeData='new {dataOptions ="https://cdn.syncfusion.com/maps/map-data/world-map.json"}'
                   ShapePropertyPath='new string[] {"name"}' DataSource="GenderRatios" ShapeDataPath="Country" TValue="GenderRatio">
            @* To add multiple bubble groups *@
            <MapsBubbleSettings>
                <MapsBubble Visible="true" MinRadius="5" MaxRadius="20" ValuePath="FemaleRatio" ColorValuePath="FemaleRatioColor"
                            DataSource="GenderRatios" TValue="GenderRatio">
                </MapsBubble>
                <MapsBubble Visible="true" BubbleType="BubbleType.Circle" Opacity="0.4" MinRadius="15" MaxRadius="25" ValuePath="MaleRatio"
                            ColorValuePath="MaleRatioColor" DataSource="GenderRatios" TValue="GenderRatio">
                </MapsBubble>
            </MapsBubbleSettings>
        </MapsLayer>
    </MapsLayers>
</SfMaps>

@code {
    public class GenderRatio
    {
        public string Country { get; set; }
        public double FemaleRatio { get; set; }
        public double MaleRatio { get; set; }
        public string FemaleRatioColor { get; set; }
        public string MaleRatioColor { get; set; }
    }

    public List<GenderRatio> GenderRatios = new List<GenderRatio> {
        new GenderRatio {
            Country = "United States", FemaleRatio = 50.50442726, MaleRatio = 49.49557274, FemaleRatioColor = "green", MaleRatioColor = "blue"
        },
        new GenderRatio {
            Country = "India", FemaleRatio = 48.18032713, MaleRatio = 51.81967287, FemaleRatioColor = "blue", MaleRatioColor = "#c2d2d6"
        },
        new GenderRatio {
            Country = "Oman", FemaleRatio = 34.15597234, MaleRatio = 65.84402766, FemaleRatioColor = "#09156d", MaleRatioColor = "orange"
        },
        new GenderRatio {
            Country = "United Arab Emirates", FemaleRatio = 27.59638942, MaleRatio = 72.40361058, FemaleRatioColor = "#09156d", MaleRatioColor = "orange"
        }
    };
}
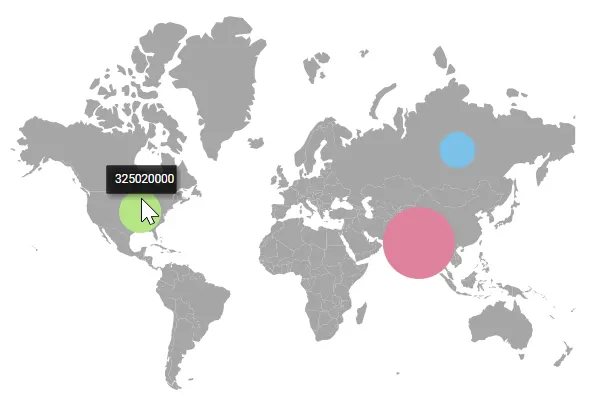
Enable tooltip for bubble
Enable bubble tooltips by setting the Visible property of MapsBubbleTooltipSettings to true. Specify the tooltip content using the ValuePath property. Use TooltipTemplate to define custom HTML content.
@using Syncfusion.Blazor.Maps

<SfMaps>
    <MapsLayers>
        <MapsLayer ShapeData='new {dataOptions ="https://cdn.syncfusion.com/maps/map-data/world-map.json"}'
                   ShapeDataPath="Name" ShapePropertyPath='new string[] {"name"}' TValue="Country">
            @* To add bubbles based on population count *@
            <MapsBubbleSettings>
                <MapsBubble Visible="true" ValuePath="Population" ColorValuePath="Color" MinRadius=20 MaxRadius=40
                            DataSource="PopulationDetails" TValue="Country">
                    <MapsBubbleTooltipSettings Visible="true" ValuePath="Population"></MapsBubbleTooltipSettings>
                </MapsBubble>
            </MapsBubbleSettings>
        </MapsLayer>
    </MapsLayers>
</SfMaps>

@code {
    public class Country
    {
        public string Name { get; set; }
        public double Population { get; set; }
        public string Color { get; set; }
    };

    public List<Country> PopulationDetails = new List<Country> {
       new Country
       {
           Name = "United States", Population = 325020000, Color = "#b5e485"
       },
       new Country
       {
           Name = "Russia", Population = 142905208, Color = "#7bc1e8"
       },
       new Country
       {
           Name = "India", Population = 1198003000, Color = "#df819c"
       }
    };
}