Color Mapping in Blazor Maps Component
23 Jun 202612 minutes to read
Color mapping customizes shape colors based on data values. It supports three types.
- Range color mapping
- Equal color mapping
- Desaturation color mapping
To apply color mapping to map shapes, bind the data source to the DataSource property of MapsLayer, and set the field that contains the color value to the ColorValuePath property.
Types of color mapping
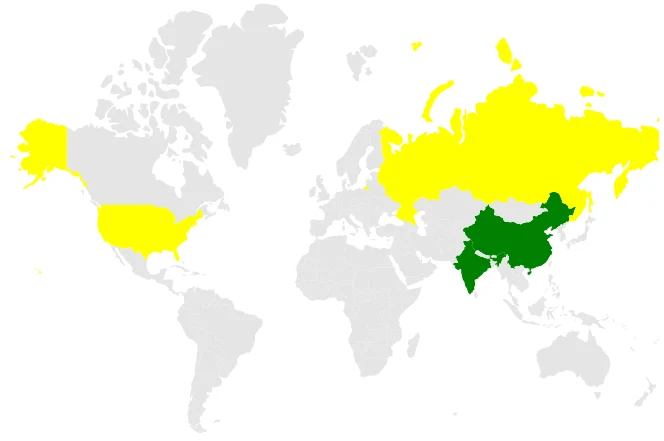
Range color mapping
Range color mapping applies colors to map shapes whose numeric values fall within the given color mapping ranges. The StartRange and EndRange properties in MapsShapeColorMapping defines the color mapping ranges.
Bind the PopulationDetails data to the DataSource property of MapsLayer and set the ColorValuePath property of MapsShapeSettings to Density. Configure range values using StartRange and EndRange properties in MapsShapeColorMapping.
@using Syncfusion.Blazor.Maps

<SfMaps>
    <MapsLayers>
        <MapsLayer ShapeData='new {dataOptions ="https://cdn.syncfusion.com/maps/map-data/world-map.json"}' DataSource="PopulationDetails"
		    ShapeDataPath="Name" ShapePropertyPath='new string[] {"name"}' TValue="PopulationDetail">
            @* To apply color based on density range *@
            <MapsShapeSettings Fill="#E5E5E5" ColorValuePath="Density">
                <MapsShapeColorMappings>
                    <MapsShapeColorMapping StartRange="0.00001" EndRange="100" Color='new string[] {"yellow"}' />
                    <MapsShapeColorMapping StartRange="100" EndRange="400" Color='new string[] {"green"}' />
                </MapsShapeColorMappings>
            </MapsShapeSettings>
        </MapsLayer>
    </MapsLayers>
</SfMaps>

@code {
    public class PopulationDetail
    {
        public string Code { get; set; }
        public double Value { get; set; }
        public string Name { get; set; }
        public double Population { get; set; }
        public double Density { get; set; }
    };

    public List<PopulationDetail> PopulationDetails = new List<PopulationDetail> {
       new PopulationDetail
       {
           Code = "US", Value = 34, Name ="United States", Population = 325020000, Density = 33
       },
       new PopulationDetail
       {
           Code ="RU", Value = 9, Name = "Russia", Population = 142905208, Density = 8.3
       },
       new PopulationDetail
       {
           Code = "In", Value = 384, Name = "India", Population = 1198003000, Density = 364
       },
       new PopulationDetail
       {
           Code = "CN", Value = 143, Name = "China", Population = 1389750000,Density = 144
       }
    };
}
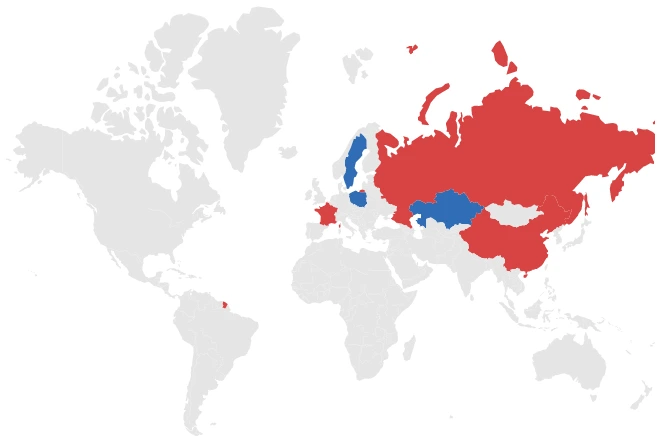
Equal color mapping
Equal color mapping applies colors when the Value property of MapsShapeColorMapping matches a corresponding value in the data source.
The following example highlights permanent and non-permanent members of the UN Security Council in 2017. Bind CouncilMemberDetails to the DataSource property of MapsLayer and set ColorValuePath property of MapsShapeSettings to Membership. Configure Value property as Permanent and Non-Permanent in separate mappings. When the value specified by ColorValuePath property matches with the corresponding field name in the data source, the corresponding color is applied.
@using Syncfusion.Blazor.Maps

<SfMaps>
    <MapsLayers>
        <MapsLayer ShapeData='new {dataOptions ="https://cdn.syncfusion.com/maps/map-data/world-map.json"}' DataSource="CouncilMemberDetails" ShapeDataPath="Country" ShapePropertyPath='new string[] {"name"}' TValue="UNCouncil">
            @* To apply color based on membership type *@
            <MapsShapeSettings Fill="#E5E5E5" ColorValuePath="Membership">
                <MapsShapeColorMappings>
                    <MapsShapeColorMapping Value="Permanent" Color='new string[] {"#D84444"}' />
                    <MapsShapeColorMapping Value="Non-Permanent" Color='new string[] {"#316DB5"}' />
                </MapsShapeColorMappings>
            </MapsShapeSettings>
        </MapsLayer>
    </MapsLayers>
</SfMaps>

@code {
    public class UNCouncil
    {
        public string Country { get; set; }
        public string Membership { get; set; }
    };

    public List<UNCouncil> CouncilMemberDetails = new List<UNCouncil> {
        new UNCouncil { Country = "China", Membership = "Permanent" },
        new UNCouncil { Country = "France", Membership = "Permanent" },
        new UNCouncil { Country = "Russia", Membership = "Permanent" },
        new UNCouncil { Country = "Kazakhstan", Membership = "Non-Permanent" },
        new UNCouncil { Country = "Poland", Membership = "Non-Permanent" },
        new UNCouncil { Country = "Sweden", Membership = "Non-Permanent" }
    };
}
Desaturation color mapping
Desaturation color mapping works like range color mapping, but applies opacity based on MinOpacity and MaxOpacity properties in MapsShapeColorMapping.
NOTE
The following example applies desaturation color mapping to shapes using the PopulationDetails data from the Range color mapping section.
Bind PopulationDetails to the DataSource property of MapsLayer and set ColorValuePath property of MapsShapeSettings to Density. Configure the range using StartRange and EndRange properties in MapsShapeColorMapping.
@using Syncfusion.Blazor.Maps

<SfMaps>
    <MapsLayers>
        <MapsLayer ShapeData='new {dataOptions ="https://cdn.syncfusion.com/maps/map-data/world-map.json"}' DataSource="PopulationDetails" ShapeDataPath="Name" ShapePropertyPath='new string[] {"name"}' TValue="PopulationDetail">
            <MapsShapeSettings Fill="#E5E5E5" ColorValuePath="Density">
                <MapsShapeColorMappings>
                    <MapsShapeColorMapping StartRange="100" EndRange="400" Color='new string[] {"blue"}' MinOpacity="0.3" MaxOpacity="1" />
                </MapsShapeColorMappings>
            </MapsShapeSettings>
        </MapsLayer>
    </MapsLayers>
</SfMaps>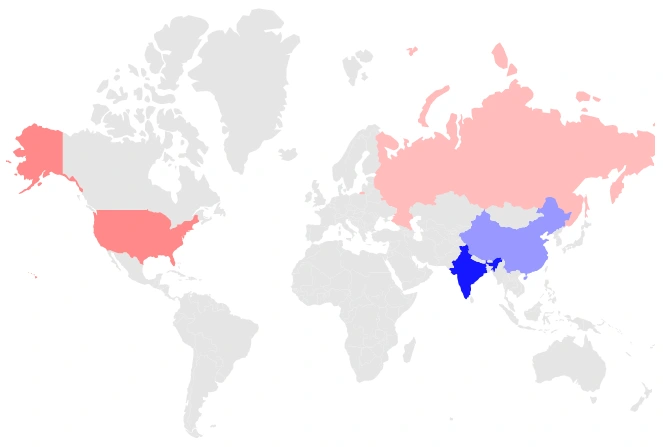
Multiple colors for a single shape
Multiple colors can be added to color mapping to create a gradient effect for specific shapes based on ranges in the data source. Using the Color property of MapsShapeColorMapping, multiple colors can be assigned to shapes as a gradient.
NOTE
The following example demonstrates multiple colors in color mapping using the PopulationDetails data from the Range color mapping section.
Bind PopulationDetails to the DataSource property of MapsLayer and set ColorValuePath property of MapsShapeSettings to Density. Configure the range values using StartRange and EndRange properties in MapsShapeColorMapping.
@using Syncfusion.Blazor.Maps

<SfMaps>
    <MapsLayers>
        <MapsLayer ShapeData='new {dataOptions ="https://cdn.syncfusion.com/maps/map-data/world-map.json"}'
                   DataSource="PopulationDetails" ShapeDataPath="Name" ShapePropertyPath='new string[] {"name"}' TValue="PopulationDetail">
            <MapsShapeSettings Fill="#E5E5E5" ColorValuePath="Density">
                <MapsShapeColorMappings>
                    <MapsShapeColorMapping StartRange="0.00001" EndRange="50" Color='new string[] { "red", "blue"}' />
                    <MapsShapeColorMapping StartRange="50" EndRange="400" Color='new string[] { "green", "yellow"}' />
                </MapsShapeColorMappings>
            </MapsShapeSettings>
        </MapsLayer>
    </MapsLayers>
</SfMaps>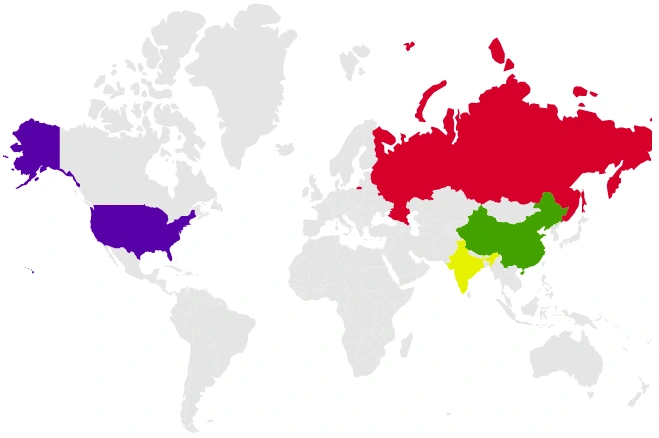
Color for items excluded from color mapping
Color mapping can also define a color for shapes that do not match range or equal-value criteria by using the Color property of MapsShapeColorMapping.
NOTE
The following example shows how to set a color for items excluded from color mapping using the PopulationDetails data from the Range color mapping section.
In the following example, color mapping is configured for the range 0 to 300. If any records fall outside this range, the mapping is not applied. To color these excluded items, set only the Color property in MapsShapeColorMapping.
@using Syncfusion.Blazor.Maps

<SfMaps>
    <MapsLayers>
        <MapsLayer ShapeData='new {dataOptions ="https://cdn.syncfusion.com/maps/map-data/world-map.json"}' DataSource="PopulationDetails" ShapeDataPath="Name" ShapePropertyPath='new string[] {"name"}' TValue="PopulationDetail">
            <MapsShapeSettings Fill="#E5E5E5" ColorValuePath="Density">
                <MapsShapeColorMappings>
                    <MapsShapeColorMapping StartRange="0.00001" EndRange="100" Color='new string[] {"orange"}' />
                    <MapsShapeColorMapping StartRange="100" EndRange="300" Color='new string[] {"blue"}' />
                    @* To apply color for excluded items *@
                    <MapsShapeColorMapping Color='new string[] {"green"}' />
                </MapsShapeColorMappings>
            </MapsShapeSettings>
        </MapsLayer>
    </MapsLayers>
</SfMaps>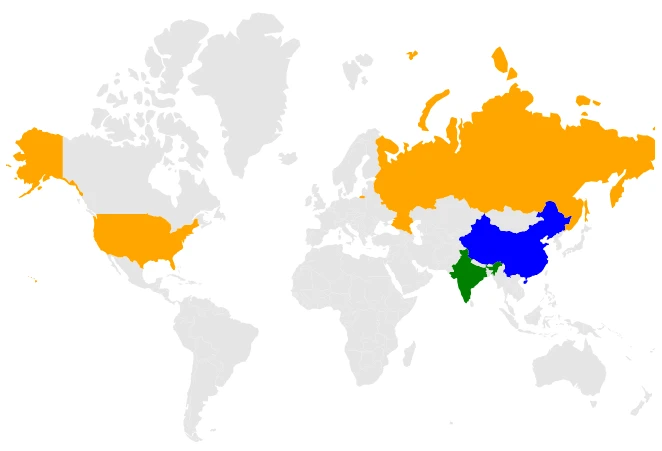
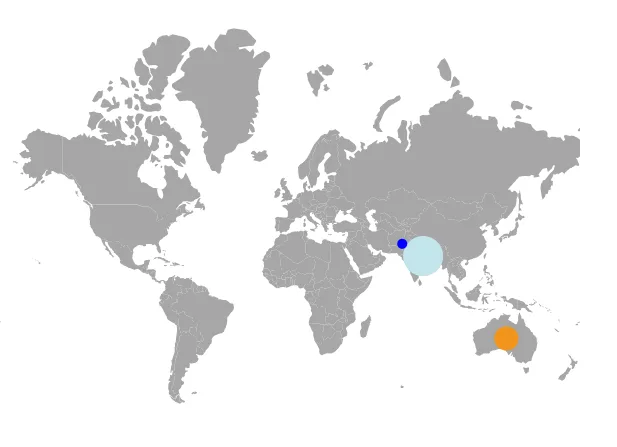
Color mapping for bubbles
Range, equal, and desaturation color mapping types are also supported for bubbles. To apply color mapping to bubbles, bind the data source to the DataSource property of MapsBubble and set the field that contains the color value to ColorValuePath property. Multiple colors for a single set of bubbles and colors for excluded items using MapsBubbleColorMapping are also supported.
@using Syncfusion.Blazor.Maps

<SfMaps>
    <MapsLayers>
        <MapsLayer ShapeData='new {dataOptions ="https://cdn.syncfusion.com/maps/map-data/world-map.json"}'
		        ShapeDataPath="Name" ShapePropertyPath='new string[] {"name"}' TValue="BubbleData">
        <MapsShapeSettings Fill="#E5E5E5"/>
            <MapsBubbleSettings>
                <MapsBubble Visible="true" ValuePath="Population" ColorValuePath="Population" MinRadius=5 DataSource="BubbleColorMapping"
			        TValue="BubbleData">
                    <MapsBubbleColorMappings>
                        <MapsBubbleColorMapping Value="38332521" Color='new string[] {"#D84444"}' />
                        <MapsBubbleColorMapping Value="19651127" Color='new string[] {"#316DB5"}' />
                        <MapsBubbleColorMapping Value="3090416" Color='new string[] {"blue"}' />
                    </MapsBubbleColorMappings>
                </MapsBubble>
            </MapsBubbleSettings>
        </MapsLayer>
    </MapsLayers>
</SfMaps>

@code {
    public class BubbleData
    {
        public string Name { get; set; }
        public string Population { get; set; }
    };

    public List<BubbleData> BubbleColorMapping = new List<BubbleData>{
        new BubbleData { Name = "India", Population = "38332521" },
        new BubbleData { Name = "Russia", Population = "19651127" },
        new BubbleData { Name = "Pakistan", Population = "3090416"}
    };
}