How can I help you?
Legend in Blazor Maps Component
4 Nov 202524 minutes to read
A legend visually explains the symbols used on Maps. It uses colors, shapes, or other identifiers based on the data and helps interpret what the Maps display. Enable legends by setting the Visible property of MapsLegendSettings to true.
Modes of legend
Legends support two modes.
- Default mode
- Interactive mode
Default mode
Default mode shows symbols with legend labels that identify the color of a shape, bubble, or marker. Enable it by setting the Mode property of MapsLegendSettings to Default.
Interactive mode
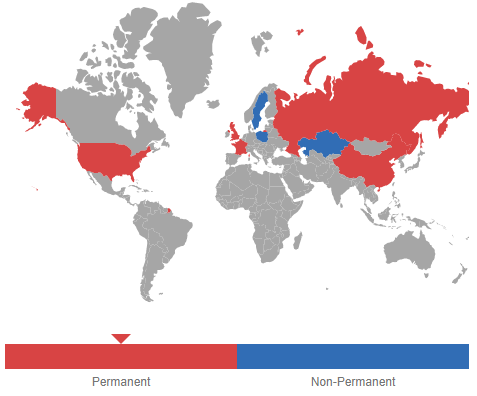
Interactive legends display an arrow pointer indicating the exact range color when hovering over corresponding shapes. Enable this by setting the Mode property of MapsLegendSettings to Interactive. Use the InvertedPointer property to show or hide the inverted pointer in interactive legends.
@using Syncfusion.Blazor.Maps

<SfMaps>
    @*  To set legend mode as interactive  *@
    <MapsLegendSettings Visible="true" Mode="LegendMode.Interactive" InvertedPointer="true">
    </MapsLegendSettings>
    <MapsLayers>
        <MapsLayer ShapeData='new {dataOptions ="https://cdn.syncfusion.com/maps/map-data/world-map.json"}' TValue="UNCouncilCountry"
                   DataSource="SecurityCouncilDetails" ShapePropertyPath='new string[] {"name"}' ShapeDataPath="Name">
            <MapsShapeSettings ColorValuePath="Membership">
                <MapsShapeColorMappings>
                    <MapsShapeColorMapping Value="Permanent" Color='new string[] {"#D84444"}' />
                    <MapsShapeColorMapping Value="Non-Permanent" Color='new string[] {"#316DB5"}' />
                </MapsShapeColorMappings>
            </MapsShapeSettings>
        </MapsLayer>
    </MapsLayers>
</SfMaps>

@code {
    private List<UNCouncilCountry> SecurityCouncilDetails = new List<UNCouncilCountry>{
         new UNCouncilCountry { Name  "China", Membership = "Permanent" },
         new UNCouncilCountry { Name = "France", Membership = "Permanent" },
         new UNCouncilCountry { Name = "Russia", Membership = "Permanent" },
         new UNCouncilCountry { Name = "Kazakhstan", Membership = "Non-Permanent" },
         new UNCouncilCountry { Name = "Poland", Membership = "Non-Permanent" },
         new UNCouncilCountry { Name = "Sweden", Membership = "Non-Permanent" },
         new UNCouncilCountry { Name = "United Kingdom", Membership = "Permanent" },
         new UNCouncilCountry { Name = "United States", Membership = "Permanent" }
    };

    public class UNCouncilCountry
    {
        public string Name { get; set; }
        public string Membership { get; set; }
    }
}
Positioning of the legend
The legend can be positioned in two ways:
- Absolute position
- Dock position
Absolute position
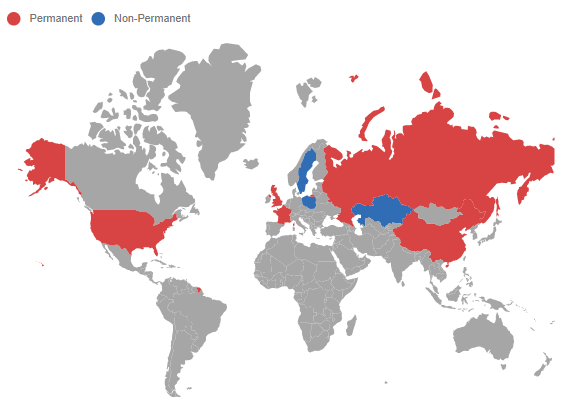
Position the legend using the X and Y properties in MapsLegendSettings. To position the legend based on coordinates relative to Maps, set Position to Float.
Dock position
Legends can be docked within the container using the Position property in MapsLegendSettings at the following locations:
- Top
- Left
- Bottom
- Right
These positions can be aligned using Near, Center, or Far with the Alignment property in MapsLegendSettings, providing 12 alignment combinations.
@using Syncfusion.Blazor.Maps

<SfMaps>
    @*  To position the legend  *@
    <MapsLegendSettings Visible="true" Position="LegendPosition.Top" Alignment="Alignment.Near">
    </MapsLegendSettings>
    <MapsLayers>
        <MapsLayer ShapeData='new {dataOptions ="https://cdn.syncfusion.com/maps/map-data/world-map.json"}' ShapeDataPath="Name"
                   DataSource="SecurityCouncilDetails" ShapePropertyPath='new string[] {"name"}' TValue="UNCouncilCountry">
            <MapsShapeSettings ColorValuePath="Membership">
                <MapsShapeColorMappings>
                    <MapsShapeColorMapping Value="Permanent" Color='new string[] {"#D84444"}' />
                    <MapsShapeColorMapping Value="Non-Permanent" Color='new string[] {"#316DB5"}' />
                </MapsShapeColorMappings>
            </MapsShapeSettings>
        </MapsLayer>
    </MapsLayers>
</SfMaps>
NOTE
Refer code block to know the property value of
securityCouncilDetails.
Legend for shapes
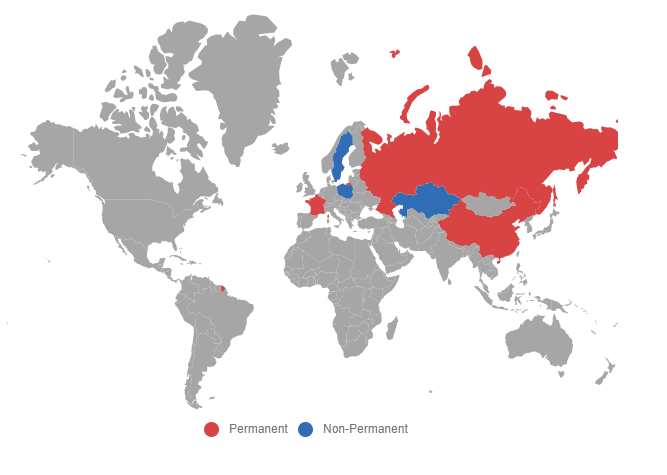
Legends for shapes can be generated from equal, range, and desaturation color mappings.
The following code demonstrates equal color mapping legends for shapes. To bind the MembershipDetails data to the DataSource property of MapsLayer, set ShapePropertyPath to name and ShapeDataPath to Country. To enable equal color mapping, configure MapsShapeColorMapping in MapsShapeSettings. Finally, set the Visible property of MapsLegendSettings to true. Use the Label property in MapsColorMapping to set legend text.
@using Syncfusion.Blazor.Maps

<SfMaps>
    <MapsLegendSettings Visible="true">
    </MapsLegendSettings>
    <MapsLayers>
        <MapsLayer ShapeData='new {dataOptions ="https://cdn.syncfusion.com/maps/map-data/world-map.json"}' ShapeDataPath="Country"
                   DataSource="MembershipDetails" ShapePropertyPath='new string[] {"name"}' TValue="UNCouncil">
            <MapsShapeSettings ColorValuePath="Membership" >
                <MapsShapeColorMappings>
                    <MapsShapeColorMapping Value="Permanent" Color='new string[] {"#D84444"}' />
                    <MapsShapeColorMapping Value="Non-Permanent" Color='new string[] {"#316DB5"}' />
                </MapsShapeColorMappings>
            </MapsShapeSettings>
        </MapsLayer>
    </MapsLayers>
</SfMaps>

@code {
    public class UNCouncil
    {
        public string Country { get; set; }
        public string Membership { get; set; }
    }

    private List<UNCouncil> MembershipDetails = new List<UNCouncil> {
        new UNCouncil { Country = "China", Membership = "Permanent" },
        new UNCouncil { Country = "France", Membership = "Permanent" },
        new UNCouncil { Country = "Russia", Membership = "Permanent" },
        new UNCouncil { Country = "Kazakhstan", Membership = "Non-Permanent" },
        new UNCouncil { Country = "Poland", Membership = "Non-Permanent" },
        new UNCouncil { Country = "Sweden", Membership = "Non-Permanent" }
    };
}
Legend shape
Maps supports the following legend shapes. Use the Shape property in MapsLegendSettings to change the legend shape.
- Circle
- Rectangle
- Triangle
- Diamond
- Cross
- Star
- HorizontalLine
- VerticalLine
- Pentagon
- InvertedTriangle
Customize legend shapes using ShapeHeight, ShapeWidth, ShapePadding properties and MapsLegendShapeBorder.
Customization
Use the following properties and classes to customize the legend and legend text in Maps.
- Background - Sets the legend background color.
- MapsLegendBorder - Configures the legend border color and width.
- Fill - Applies a color to the legend.
- LabelDisplayMode - Controls how legend text is displayed.
- LabelPosition - Positions legend text.
- Orientation - Sets the legend orientation.
- MapsLegendTextStyle - Customizes legend text style.
- MapsLegendTitle - Adds a legend title.
- MapsLegendTitleStyle - Customizes the legend title style.
- Height - Sets the legend height.
- Width - Sets the legend width.
- Opacity - Applies opacity to the legend.
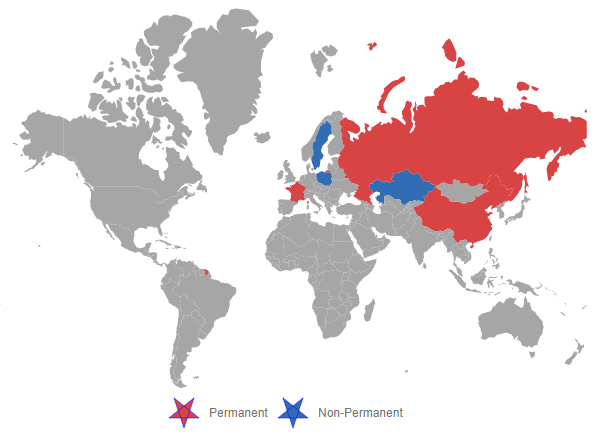
@using Syncfusion.Blazor.Maps

<SfMaps>
    @*  To customize the legend  *@
    <MapsLegendSettings Visible="true" Shape="Syncfusion.Blazor.Maps.LegendShape.Star" ShapeHeight="30" ShapeWidth="30" ShapePadding="10">
        <MapsLegendShapeBorder Color="blue" Width="0.5">
        </MapsLegendShapeBorder>
    </MapsLegendSettings>
    <MapsLayers>
        <MapsLayer ShapeData='new {dataOptions ="https://cdn.syncfusion.com/maps/map-data/world-map.json"}' ShapeDataPath="Country"
                   DataSource="MemberShipDetails" ShapePropertyPath='new string[] {"name"}' TValue="UNCouncil">
            <MapsShapeSettings ColorValuePath="Membership">
                <MapsShapeColorMappings>
                    <MapsShapeColorMapping Value="Permanent" Color='new string[] {"#D84444"}' />
                    <MapsShapeColorMapping Value="Non-Permanent" Color='new string[] {"#316DB5"}' />
                </MapsShapeColorMappings>
            </MapsShapeSettings>
        </MapsLayer>
    </MapsLayers>
</SfMaps>

@code {
    public class UNCouncil
    {
        public string Country { get; set; }
        public string Membership { get; set; }
    }

    private List<UNCouncil> MemberShipDetails = new List<UNCouncil>
    {
        new UNCouncil { Country = "China", Membership = "Permanent" },
        new UNCouncil { Country = "France", Membership = "Permanent" },
        new UNCouncil { Country = "Russia", Membership = "Permanent" },
        new UNCouncil { Country = "Kazakhstan", Membership = "Non-Permanent" },
        new UNCouncil { Country = "Poland", Membership = "Non-Permanent" },
        new UNCouncil { Country = "Sweden", Membership = "Non-Permanent" }
    };
}
Legend for items excluded from color mapping
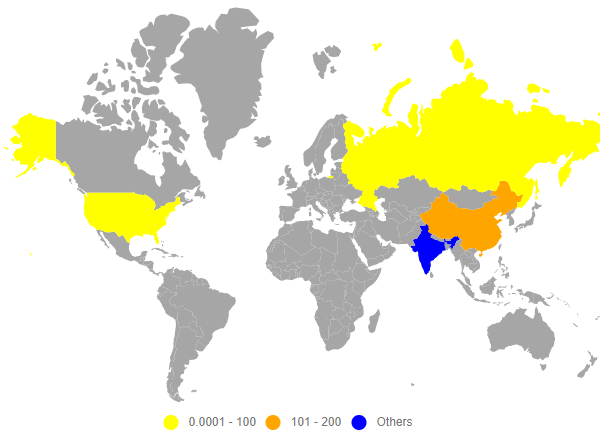
Enable legends for items excluded from color mapping using the Color property in MapsShapeColorMapping.
In the following example, color mapping is defined for ranges from 0 to 200. Records outside this range do not receive color mapping. To color those excluded items, set only the Color property in MapsShapeColorMapping. To enable legends for these items, set the Visible property of MapsLegendSettings to true.
@using Syncfusion.Blazor.Maps

<SfMaps>
    <MapsLegendSettings Visible="true"></MapsLegendSettings>
    <MapsLayers>
        <MapsLayer ShapeData='new {dataOptions ="https://cdn.syncfusion.com/maps/map-data/world-map.json"}' ShapeDataPath="Name"
                   DataSource="populationDetails" ShapePropertyPath='new string[] {"name"}' TValue="PopulationDetail">
            <MapsShapeSettings ColorValuePath="Density">
                <MapsShapeColorMappings>
                    <MapsShapeColorMapping StartRange="0.0001" EndRange="100" Color='new string[] {"yellow"}' />
                    <MapsShapeColorMapping StartRange="101" EndRange="200" Color='new string[] {"orange"}' />
                    <MapsShapeColorMapping Color='new string[] {"blue"}' />
                </MapsShapeColorMappings>
            </MapsShapeSettings>
        </MapsLayer>
    </MapsLayers>
</SfMaps>

@code {
    public class PopulationDetail
    {
        public string Name { get; set; }
        public double Population { get; set; }
        public double Density { get; set; }
    }

    private List<PopulationDetail> populationDetails = new List<PopulationDetail> {
        new PopulationDetail
        {
            Name ="United States", Population = 325020000, Density = 33
        },
        new PopulationDetail
        {
            Name = "Russia", Population = 142905208, Density = 8.3
        },
        new PopulationDetail
        {
            Name="India", Population=1198003000, Density=364
        },
        new PopulationDetail
        {
            Name="China", Population=1389750000, Density=144
        }
    };
}
Hiding desired legend items
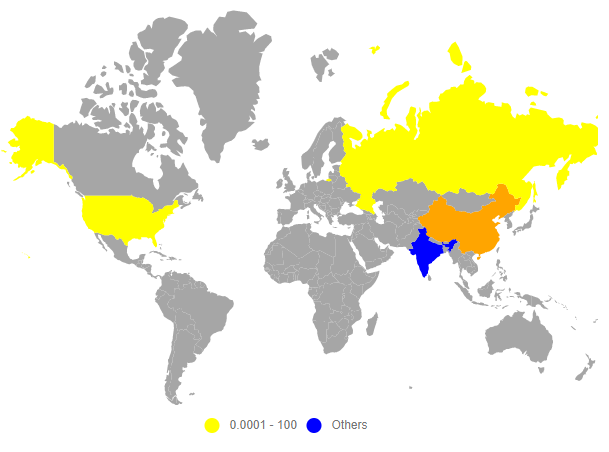
Use the ShowLegend property in MapsShapeColorMapping to show or hide legend items. If ShowLegend is set to false, the legend item is hidden. Otherwise, it is visible.
@using Syncfusion.Blazor.Maps

<SfMaps>
    <MapsLegendSettings Visible="true"></MapsLegendSettings>
    <MapsLayers>
        <MapsLayer ShapeData='new {dataOptions ="https://cdn.syncfusion.com/maps/map-data/world-map.json"}' ShapeDataPath="Name"
                   DataSource="populationDetails" ShapePropertyPath='new string[] {"name"}' TValue="PopulationDetail">
            <MapsShapeSettings ColorValuePath="Density">
                <MapsShapeColorMappings>
                    <MapsShapeColorMapping StartRange="0.0001" EndRange="100" Color='new string[] {"yellow"}' ShowLegend="true" />
                    @*  hide legend for this range  *@
                    <MapsShapeColorMapping StartRange="101" EndRange="200" Color='new string[] {"orange"}' ShowLegend="false" />
                    <MapsShapeColorMapping Color='new string[] {"blue"}' ShowLegend="true" />
                </MapsShapeColorMappings>
            </MapsShapeSettings>
        </MapsLayer>
    </MapsLayers>
</SfMaps>
NOTE
Refer code block to know the property value of
PopulationDetails.
Hide legend items based on data source value
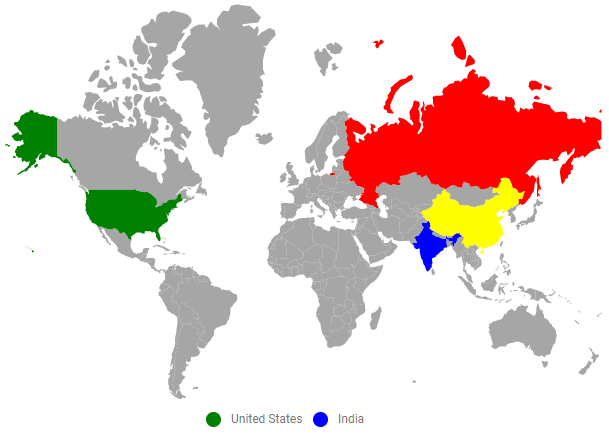
Legend item visibility can be driven by boolean values in the data source. Bind the field that contains the visibility state to the ShowLegendPath property of MapsLegendSettings.
@using Syncfusion.Blazor.Maps

<SfMaps>
    @*  To hide legend based in data source fields  *@
    <MapsLegendSettings Visible="true" ShowLegendPath="LegendVisibility"/>
    <MapsLayers>
        <MapsLayer ShapeData='new {dataOptions ="https://cdn.syncfusion.com/maps/map-data/world-map.json"}' ShapeDataPath="Name"
                   DataSource="populationDetails" ShapePropertyPath='new string[] {"name"}' TValue="PopulationDetail">
            <MapsShapeSettings ColorValuePath="Color"> </MapsShapeSettings>
        </MapsLayer>
    </MapsLayers>
</SfMaps>

@code {
    public class PopulationDetail
    {
        public string Name { get; set; }
        public double Population { get; set; }
        public double Density { get; set; }
        public bool LegendVisibility { get; set; }
        public string Color { get; set; }
    }

    private List<PopulationDetail> populationDetails = new List<PopulationDetail> {
        new PopulationDetail
        {
            Name = "United States", Population = 325020000, Density = 33, LegendVisibility = true, Color = "green"
        },
        new PopulationDetail
        {
            Name = "Russia", Population = 142905208, Density = 8.3, LegendVisibility = false, Color = "red"
        },
        new PopulationDetail
        {
            Name = "India", Population = 1198003000, Density = 364, LegendVisibility = true, Color = "blue"
        },
        new PopulationDetail
        {
            Name = "China", Population = 1389750000, Density = 144, LegendVisibility = false, Color = "orange"
        }
    };
}
Binding legend item text from data source
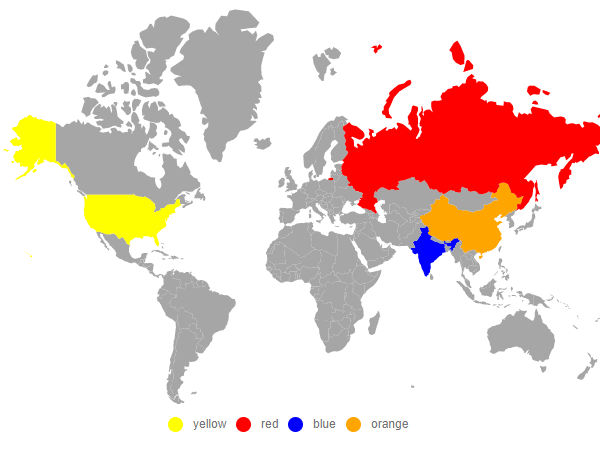
Display legend text based on values in the data source by using the ValuePath property in MapsLegendSettings.
@using Syncfusion.Blazor.Maps

<SfMaps>
    <MapsLegendSettings Visible="true" ValuePath="Color"></MapsLegendSettings>
    <MapsLayers>
        <MapsLayer ShapeData='new {dataOptions ="https://cdn.syncfusion.com/maps/map-data/world-map.json"}' ShapeDataPath="Name"
                   DataSource="PopulationDetails" ShapePropertyPath='new string[] {"name"}' TValue="PopulationDetail">
            <MapsShapeSettings ColorValuePath="Color"> </MapsShapeSettings>
        </MapsLayer>
    </MapsLayers>
</SfMaps>

@code {
    public class PopulationDetail
    {
        public string Name { get; set; }
        public double Population { get; set; }
        public double Density { get; set; }
        public string Color { get; set; }
    }

    private List<PopulationDetail> PopulationDetails = new List<PopulationDetail> {
        new PopulationDetail
        {
            Name = "United States", Population = 325020000, Density = 33, Color = "yellow"
        },
        new PopulationDetail
        {
            Name = "Russia", Population = 142905208, Density = 8.3, Color = "red"
        },
        new PopulationDetail
        {
            Name = "India", Population = 1198003000, Density = 364, Color = "blue"
        },
        new PopulationDetail
        {
            Name = "China", Population = 1389750000, Density = 144, Color = "orange"
        }
    };
}
Hiding duplicate legend items
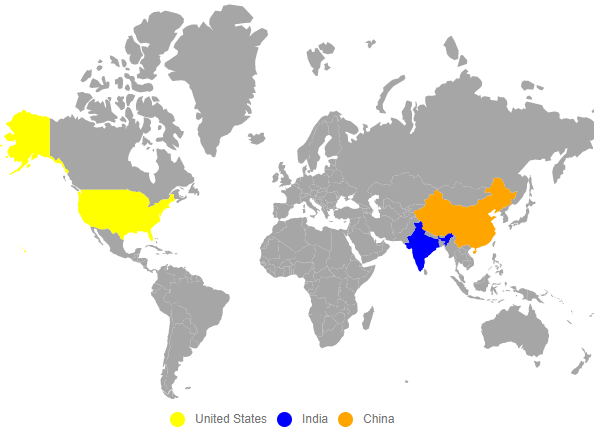
To hide duplicate legend items, set RemoveDuplicateLegend property to true in MapsLegendSettings.
@using Syncfusion.Blazor.Maps

<SfMaps>
    <MapsLegendSettings Visible="true" RemoveDuplicateLegend="true"></MapsLegendSettings>
    <MapsLayers>
        <MapsLayer ShapeData='new {dataOptions ="https://cdn.syncfusion.com/maps/map-data/world-map.json"}' ShapeDataPath="Name"
                   DataSource="populationDetails" TValue="PopulationDetail" ShapePropertyPath='new string[] {"name"}'>
            <MapsShapeSettings ColorValuePath="Color"> </MapsShapeSettings>
        </MapsLayer>
    </MapsLayers>
</SfMaps>

@code {
    public class PopulationDetail
    {
        public string Name { get; set; }
        public double Population { get; set; }
        public double Density { get; set; }
        public string Color { get; set; }
    }

    private List<PopulationDetail> populationDetails = new List<PopulationDetail> {
        new PopulationDetail
        {
            Name = "United States", Population = 325020000, Density = 33, Color = "yellow"
        },
        new PopulationDetail
        {
            Name = "United States", Population = 325020000, Density = 33, Color = "yellow"
        },
        new PopulationDetail
        {
            Name = "India", Population = 1198003000, Density = 364, Color = "blue"
        },
        new PopulationDetail
        {
            Name = "China", Population = 1389750000, Density = 144, Color = "orange"
        }
    };
}
Toggle option in legend
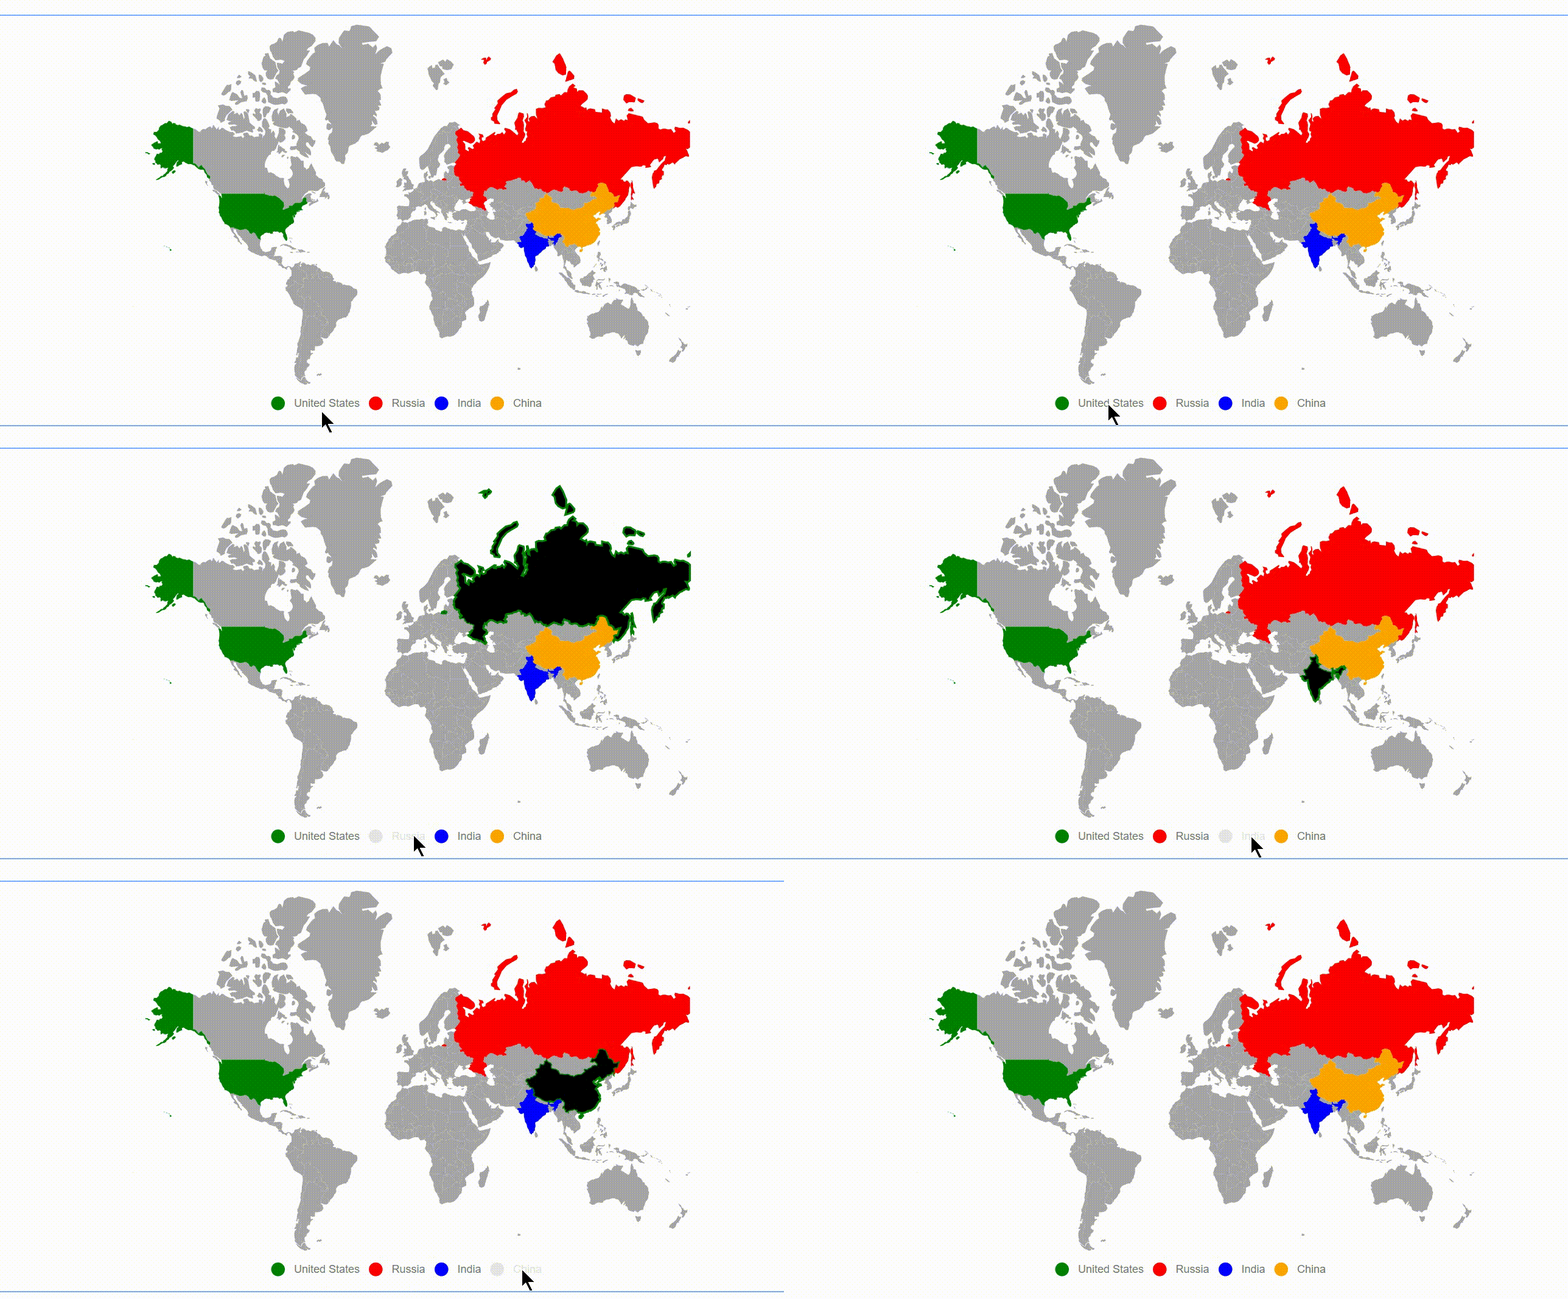
A toggle option is available for legends. When toggled, the specified color is applied to the corresponding Maps shape item. To enable toggle behavior, set the Enable property of MapsToggleLegendSettings to true.
The following properties and components customize the toggle option:
- ApplyShapeSettings – Applies the Fill value of the Maps shape when toggling legend items.
- Fill - Sets the color for shapes whose legend item is toggled.
- Opacity – Controls the transparency of toggled shapes.
- MapsToggleLegendBorder – Customizes the color and width of the shapes’ borders.
@using Syncfusion.Blazor.Maps

<SfMaps>
    @*  To hide legend based in data source fields  *@
    <MapsLegendSettings Visible="true">
    <MapsToggleLegendSettings Enable="true" ApplyShapeSettings="false">
    <MapsLegendBorder Width="2" Color="green"></MapsLegendBorder></MapsToggleLegendSettings>
    </MapsLegendSettings>
    <MapsLayers>
        <MapsLayer ShapeData='new {dataOptions ="https://cdn.syncfusion.com/maps/map-data/world-map.json"}' ShapeDataPath="Name"
                   DataSource="populationDetails" TValue="PopulationDetail" ShapePropertyPath='new string[] {"name"}'>
            <MapsShapeSettings ColorValuePath="Color"> </MapsShapeSettings>
        </MapsLayer>
    </MapsLayers>
</SfMaps>

@code {
    public class PopulationDetail
    {
        public string Name { get; set; }
        public double Population { get; set; }
        public double Density { get; set; }
        public bool LegendVisibility { get; set; }
        public string Color { get; set; }
    };

    private List<PopulationDetail> populationDetails = new List<PopulationDetail> {
        new PopulationDetail
        {
            Name = "United States", Population = 325020000, Density = 33, LegendVisibility = true, Color = "green"
        },
        new PopulationDetail
        {
            Name = "Russia", Population = 142905208, Density = 8.3, LegendVisibility = false, Color = "red"
        },
        new PopulationDetail
        {
            Name = "India", Population = 1198003000, Density = 364, LegendVisibility = true, Color = "blue"
        },
        new PopulationDetail
        {
            Name = "China", Population = 1389750000, Density = 144, LegendVisibility = false, Color = "orange"
        }
    };
}
Enable legend for bubbles
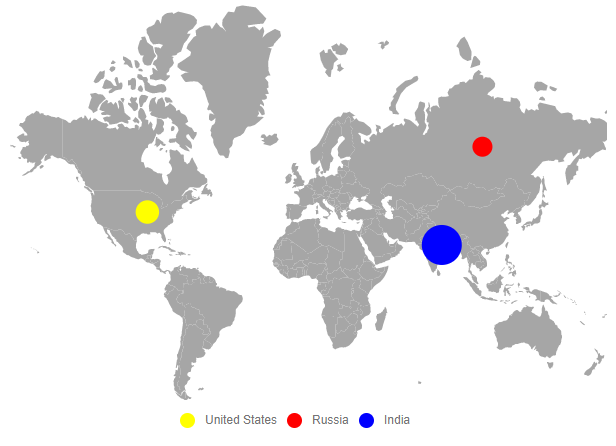
Enable legends for bubbles by setting the Visible property of MapsLegendSettings to true and the Type property to Bubbles.
@using Syncfusion.Blazor.Maps

<SfMaps>
    @* To enable legend for bubbles *@
    <MapsLegendSettings Visible="true" Type="LegendType.Bubbles"></MapsLegendSettings>
    <MapsLayers>
        <MapsLayer ShapeData='new {dataOptions ="https://cdn.syncfusion.com/maps/map-data/world-map.json"}' ShapeDataPath="Name"
                   DataSource="PopulationDetails" ShapePropertyPath='new string[] {"name"}' TValue="PopulationDetail">
            <MapsBubbleSettings>
                <MapsBubble Visible="true" ValuePath="Population" ColorValuePath="Color"
                            DataSource="PopulationDetails" TValue="PopulationDetail">
                </MapsBubble>
            </MapsBubbleSettings>
        </MapsLayer>
    </MapsLayers>
</SfMaps>

@code {
    public class PopulationDetail
    {
        public string Name { get; set; }
        public double Population { get; set; }
        public double Density { get; set; }
        public string Color { get; set; }
    }

    private List<PopulationDetail> PopulationDetails = new List<PopulationDetail> {
        new PopulationDetail
        {
            Name = "United States", Population = 325020000, Density = 33, Color = "yellow"
        },
        new PopulationDetail
        {
            Name = "Russia", Population = 142905208, Density = 8.3, Color = "red"
        },
        new PopulationDetail
        {
            Name = "India", Population = 1198003000, Density = 364, Color = "blue"
        }
    };
}
Enable legend for markers
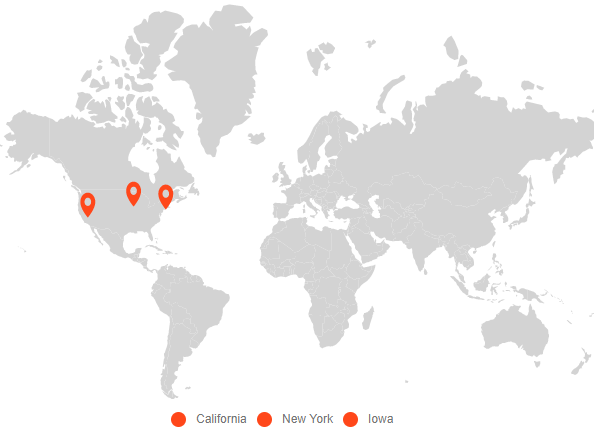
Enable legends for markers by setting the Visible property of MapsLegendSettings to true and the Type property to Markers. Use the LegendText property in MapsMarker to display legend text based on values in the data source.
@using Syncfusion.Blazor.Maps

<SfMaps>
    @*  To enable legend for marker *@
    <MapsLegendSettings Visible="true" Type="LegendType.Markers"></MapsLegendSettings>
    <MapsLayers>
        <MapsLayer ShapeData='new {dataOptions= "https://cdn.syncfusion.com/maps/map-data/world-map.json"}' TValue="string">
            <MapsMarkerSettings>
                <MapsMarker Visible="true" DataSource="Cities" Height="25" Width="15" LegendText="Name" TValue="City">
                </MapsMarker>
            </MapsMarkerSettings>
            <MapsShapeSettings Fill="lightgray"></MapsShapeSettings>
        </MapsLayer>
    </MapsLayers>
</SfMaps>

@code {
    public class City
    {
        public double Latitude { get; set; }
        public double Longitude { get; set; }
        public string Name { get; set; }
    }

    private List<City> Cities = new List<City> {
        new City { Latitude = 35.145083, Longitude = -117.960260, Name = "Californiya" },
        new City { Latitude = 40.724546, Longitude = -73.850344, Name = "New York" },
        new City { Latitude = 41.657782, Longitude = -91.533857, Name = "Iowa" }
    };
}
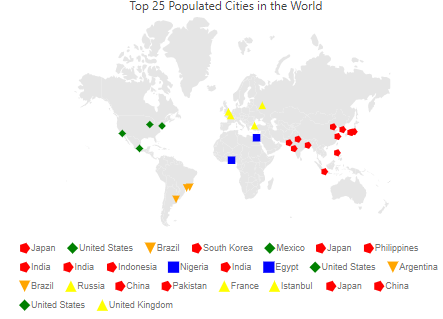
Imitate/Map marker shape to the legend shape
To map the marker shape to the legend item shape, set UseMarkerShape property to true in MapsLegendSettings.
@using Syncfusion.Blazor.Maps

<SfMaps>
    <MapsTitleSettings Text="Top 25 Populated Cities in the World">
        <MapsTitleTextStyle Size="16px" FontFamily="Segoe UI" />
    </MapsTitleSettings>
    <MapsZoomSettings Enable="false" />
    <MapsLegendSettings Visible="true" Type="LegendType.Markers" UseMarkerShape="true">
        <MapsToggleLegendSettings Enable="true" ApplyShapeSettings="false" >
            <MapsToggleLegendBorder Width="2" Color="green" />
        </MapsToggleLegendSettings>
    </MapsLegendSettings>
    <MapsLayers>
        <MapsLayer ShapeData='new {dataOptions= "https://cdn.syncfusion.com/maps/map-data/world-map.json"}' TValue="string">
            <MapsShapeSettings Fill="#E5E5E5" />
            <MapsMarkerSettings>
                <MapsMarker Visible="true" TValue="PopulationCityDetails" DataSource="@PopulatedCities" Shape="MarkerType.Circle" ColorValuePath="Color" ShapeValuePath="Shape" LegendText="Color">
                </MapsMarker>
            </MapsMarkerSettings>
        </MapsLayer>
    </MapsLayers>
</SfMaps>

@code {
    public class PopulationCityDetails
    {
        public double Latitude { get; set; }
        public double Longitude { get; set; }
        public string Name { get; set; }
        public double Population { get; set; }
        public string Country { get; set; }
        public string Continent { get; set; }
        public string Color { get; set; }
        public string Shape { get; set; }
    }

    public List<PopulationCityDetails> PopulatedCities = new List<PopulationCityDetails> {
        new PopulationCityDetails { Name = "Tokyo", Latitude = 35.6894875, Longitude = 139.6917064, Population = 33200000, Country = "Japan", Continent = "Asia", Color = "red", Shape = "Pentagon" },
        new PopulationCityDetails { Name = "New York", Latitude = 40.7127753, Longitude = -74.0059728, Population = 17800000, Country = "United States", Continent = "North America", Color = "green", Shape = "Diamond" },
        new PopulationCityDetails { Name = "Sao Paulo", Latitude = -23.5505199, Longitude = -46.6333094, Population = 17700000, Country = "Brazil", Continent = "South America", Color = "orange", Shape = "InvertedTriangle" },
        new PopulationCityDetails { Name = "Seoul/Incheon", Latitude = 37.566535, Longitude = 126.9779692, Population = 17500000, Country = "South Korea", Continent = "Asia", Color = "red", Shape = "Pentagon" },
        new PopulationCityDetails { Name = "Mexico City", Latitude = 19.2464696, Longitude = -99.1013498, Population = 17400000, Country = "Mexico", Continent = "North America", Color = "green", Shape = "Diamond" },
        new PopulationCityDetails { Name = "Osaka/Kobe/Kyoto", Latitude = 35.0212466, Longitude = 135.7555968, Population = 16425000, Country = "Japan", Continent = "Asia", Color = "red", Shape = "Pentagon" },
        new PopulationCityDetails { Name = "Manila", Latitude = 14.5995124, Longitude = 120.9842195, Population = 14750000, Country = "Philippines", Continent = "Asia", Color = "red", Shape = "Pentagon" },
        new PopulationCityDetails { Name = "Mumbai", Latitude = 19.0759837, Longitude = 72.8776559, Population = 14350000, Country = "India", Continent = "Asia", Color = "red", Shape = "Pentagon" },
        new PopulationCityDetails { Name = "Delhi", Latitude = 28.6139391, Longitude = 77.2090212, Population = 14300000, Country = "India", Continent = "Asia", Color = "red", Shape = "Pentagon" },
        new PopulationCityDetails { Name = "Jakarta", Latitude = -6.17511, Longitude = 106.8650395, Population = 14250000, Country = "Indonesia", Continent = "Asia", Color = "red", Shape = "Pentagon" },
        new PopulationCityDetails { Name = "Lagos", Latitude = 6.5243793, Longitude = 3.3792057, Population = 13400000, Country = "Nigeria", Continent = "Africa", Color = "blue", Shape = "Rectangle" },
        new PopulationCityDetails { Name = "Kolkata", Latitude = 22.572646, Longitude = 88.363895, Population = 12700000, Country = "India", Continent = "Asia", Color = "red", Shape = "Pentagon" },
        new PopulationCityDetails { Name = "Cairo", Latitude = 30.0444196, Longitude = 31.2357116, Population = 12200000, Country = "Egypt", Continent = "Africa", Color = "blue", Shape = "Rectangle" },
        new PopulationCityDetails { Name = "Los Angeles", Latitude = 34.0522265, Longitude = -118.2436596, Population = 11789000, Country = "United States", Continent = "North America", Color = "green", Shape = "Diamond" },
        new PopulationCityDetails { Name = "Buenos Aires", Latitude = -34.6036844, Longitude = -58.3815591, Population = 11200000, Country = "Argentina", Continent = "South America", Color = "orange", Shape = "InvertedTriangle" },
        new PopulationCityDetails { Name = "Rio de Janeiro", Latitude = -22.9068467, Longitude = -43.1728965, Population = 10800000, Country = "Brazil", Continent = "South America", Color = "orange", Shape = "InvertedTriangle" },
        new PopulationCityDetails { Name = "Moscow", Latitude = 55.755826, Longitude = 37.6173, Population = 10500000, Country = "Russia", Continent = "Europe", Color = "yellow", Shape = "Triangle" },
        new PopulationCityDetails { Name = "Shanghai", Latitude = 31.2303904, Longitude = 121.4737021, Population = 10000000, Country = "China", Continent = "Asia", Color = "red", Shape = "Pentagon" },
        new PopulationCityDetails { Name = "Karachi", Latitude = 25.0700428, Longitude = 67.2847875, Population = 9800000, Country = "Pakistan", Continent = "Asia", Color = "red", Shape = "Pentagon" },
        new PopulationCityDetails { Name = "Paris", Latitude = 48.856614, Longitude = 2.3522219, Population = 9645000, Country = "France", Continent = "Europe", Color = "yellow", Shape = "Triangle" },
        new PopulationCityDetails { Name = "Istanbul", Latitude = 41.0082376, Longitude = 28.9783589, Population = 9000000, Country = "Istanbul", Continent = "Europe", Color = "yellow", Shape = "Triangle" },
        new PopulationCityDetails { Name = "Nagoya", Latitude = 35.1814464, Longitude = 136.906398, Population = 9000000, Country = "Japan", Continent = "Asia", Color = "red", Shape = "Pentagon" },
        new PopulationCityDetails { Name = "Beijing", Latitude = 39.9041999, Longitude = 116.4073963, Population = 8614000, Country = "China", Continent = "Asia", Color = "red", Shape = "Pentagon" },
        new PopulationCityDetails { Name = "Chicago", Latitude = 41.8781136, Longitude = -87.6297982, Population = 8308000, Country = "United States", Continent = "North America", Color = "green", Shape = "Diamond" },
        new PopulationCityDetails { Name = "London", Latitude = 51.5073509, Longitude = -0.1277583, Population = 8278000, Country = "United Kingdom", Continent = "Europe", Color = "yellow", Shape = "Triangle" }
    };
}