Azure Maps in Blazor Maps Component
23 Jun 20269 minutes to read
Azure Maps is an online map tile provider from Microsoft. Similar to OSM and Bing Maps, it serves map tile images on request and composites them to display the map area.
Adding Azure Maps
Azure Maps can be rendered by setting the UrlTemplate property with the tile server URL provided by the online map provider. A subscription key is required for Azure Maps. Follow the steps in this link to generate an API key, and then add the key to the URL.
NOTE
Refer to Azure Maps Licensing.
@using Syncfusion.Blazor.Maps

<SfMaps>
    <MapsLayers>
        <MapsLayer UrlTemplate="https://atlas.microsoft.com/map/imagery/png?subscription-key=Your-Key &api-version=1.0&style=satellite&zoom=level&x=tileX&y=tileY" TValue="string">
        </MapsLayer>
    </MapsLayers>
</SfMaps>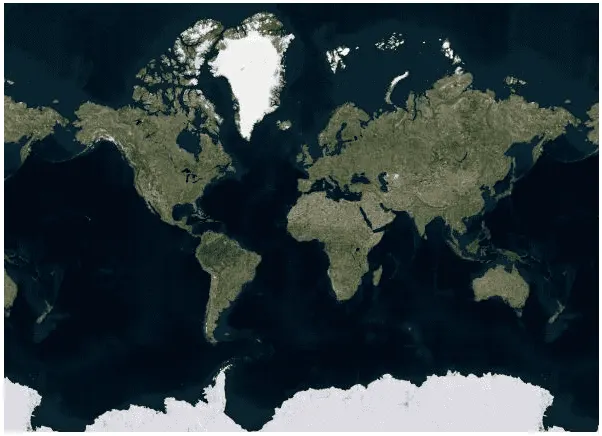
Enable zooming and panning
The Azure Maps layer supports zooming and panning. Zooming provides a closer view of a specific area for detailed analysis, and panning moves the map to focus on a targeted area. To enable zooming, set the Enable property to true in MapsZoomSettings. Panning is enabled by default and can be configured using the EnablePanning property.
@using Syncfusion.Blazor.Maps

<SfMaps>
    @* To zoom and pan *@
    <MapsZoomSettings Enable="true">
        <MapsZoomToolbarSettings>
            <MapsZoomToolbarButton ToolbarItems="new List<ToolbarItem>() { ToolbarItem.Zoom, ToolbarItem.ZoomIn, ToolbarItem.ZoomOut,
            ToolbarItem.Pan, ToolbarItem.Reset }"></MapsZoomToolbarButton>
        </MapsZoomToolbarSettings>
    </MapsZoomSettings>
    <MapsLayers>
        <MapsLayer UrlTemplate="https://atlas.microsoft.com/map/imagery/png?subscription-key=Your-Key &api-version=1.0&style=satellite&zoom=level&x=tileX&y=tileY" TValue="string">
        </MapsLayer>
    </MapsLayers>
</SfMaps>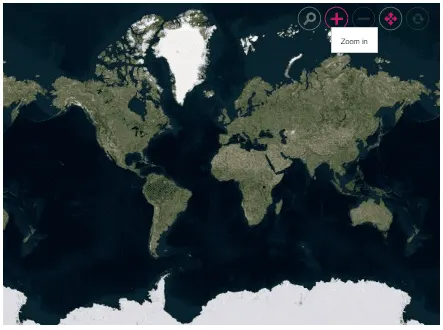
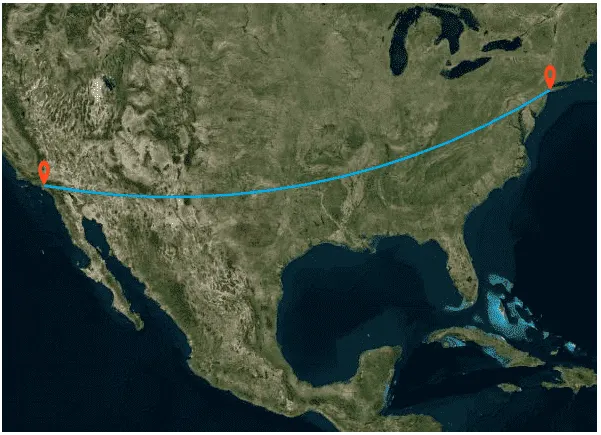
Adding markers and navigation line
Markers can be added to Azure Maps layers by providing latitude and longitude coordinates in MapsMarker. Navigation lines can be drawn over the Azure Maps layer to highlight paths between locations by providing latitude and longitude coordinates in MapsNavigationLine.
@using Syncfusion.Blazor.Maps

<SfMaps>
    <MapsZoomSettings ZoomFactor="4"></MapsZoomSettings>
    <MapsCenterPosition Latitude="29.394708" Longitude="-94.954653"></MapsCenterPosition>
    <MapsLayers>
        <MapsLayer UrlTemplate="https://atlas.microsoft.com/map/imagery/png?subscription-key=Your-Key &api-version=1.0&style=satellite&zoom=level&x=tileX&y=tileY" TValue="string">
            @* Add markers *@
            <MapsMarkerSettings>
                <MapsMarker Visible="true" Height="25" Width="15" DataSource="Cities" TValue="City">
                </MapsMarker>
            </MapsMarkerSettings>
            @* Add navigation line *@
            <MapsNavigationLines>
                <MapsNavigationLine Visible="true" Color="blue" Angle="0.1" Latitude="new double[]{34.060620, 40.724546}"
                                    Longitude="new double[]{-118.330491,-73.850344}">
                </MapsNavigationLine>
            </MapsNavigationLines>
        </MapsLayer>
    </MapsLayers>
</SfMaps>

@code {
    public class City
    {
        public double Latitude { get; set; }
        public double Longitude { get; set; }
        public string Name { get; set; }
    }

    private List<City> Cities = new List<City> {
        new City { Latitude = 34.060620, Longitude = -118.330491,  Name="California" },
        new City{ Latitude = 40.724546, Longitude = -73.850344,  Name="New York"}
    };
}
Adding sublayer
Any GeoJSON shape can be rendered as a sublayer over the Azure Maps layer to highlight a continent or country. Add another layer and set the Type property of MapsLayer to SubLayer.
@using Syncfusion.Blazor.Maps

<SfMaps>
    <MapsLayers>
        <MapsLayer UrlTemplate="https://atlas.microsoft.com/map/imagery/png?subscription-key=Your-Key &api-version=1.0&style=satellite&zoom=level&x=tileX&y=tileY" TValue="string">
        </MapsLayer>
        @* To add geometry shape as sublayer *@
        <MapsLayer ShapeData='new {dataOptions = "https://cdn.syncfusion.com/maps/map-data/africa.json"}'
                   Type="Syncfusion.Blazor.Maps.Type.SubLayer" TValue="string">
            <MapsShapeSettings Fill="blue"></MapsShapeSettings>
        </MapsLayer>
    </MapsLayers>
</SfMaps>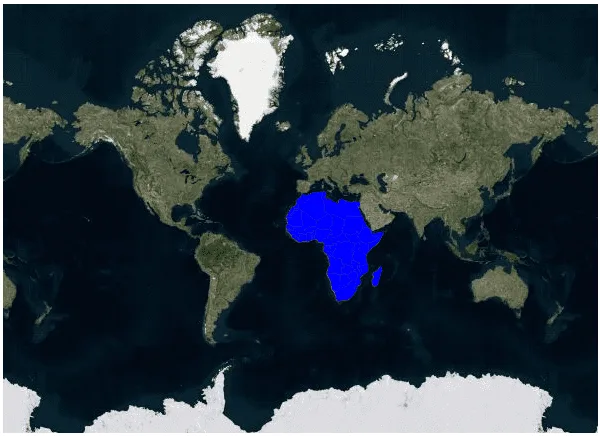
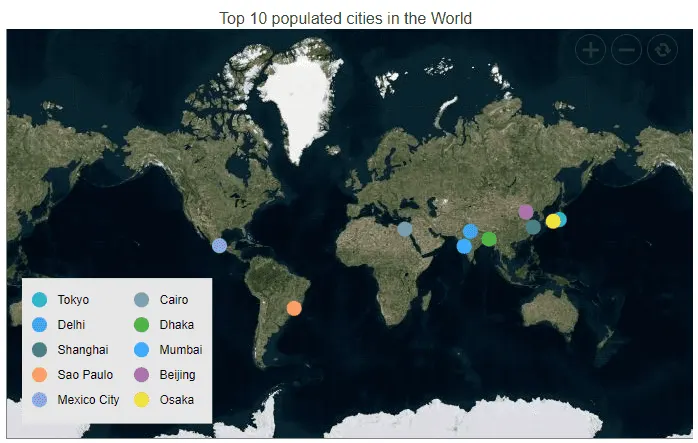
Enable legend
A legend can be added to Azure Maps by setting the Visible property of MapsLegendSettings to true.
@using Syncfusion.Blazor.Maps

<SfMaps Format="N0" EnableGroupingSeparator="true">
    <MapsZoomSettings Enable="true">
        <MapsZoomToolbarSettings>
            <MapsZoomToolbarTooltipSettings FontFamily="inherit"></MapsZoomToolbarTooltipSettings>
        </MapsZoomToolbarSettings>
    </MapsZoomSettings>
    <MapsLegendSettings Visible="true" Position="LegendPosition.Float" Height="123px" Width="200px" Type="LegendType.Markers" X="10" Y="247" Background="#E6E6E6" ShapePadding="10">
        <MapsLegendTextStyle FontFamily="inherit" Color="#000000" />
    </MapsLegendSettings>
    <MapsTitleSettings Text="Top 10 populated cities in the World">
        <MapsTitleTextStyle Size="16px" FontFamily="inherit" />
    </MapsTitleSettings>
    <MapsLayers>
        <MapsLayer UrlTemplate="https://atlas.microsoft.com/map/imagery/png?subscription-key=Your-Key &api-version=1.0&style=satellite&zoom=level&x=tileX&y=tileY" TValue="string">
        <MapsMarkerSettings>
                <MapsMarker Visible="true" TValue="PopulationCityDetails" DataSource="@PopulatedCities" Shape="MarkerType.Circle" Fill="#FFFFFF" ColorValuePath="Color" LegendText="Name" Height="15" Width="15">
                    <MapsMarkerTooltipSettings Visible="true" ValuePath="Population" Format="City Name: ${Name}</br>Population: ${Population} million">
                        <MapsMarkerTooltipTextStyle FontFamily="inherit"></MapsMarkerTooltipTextStyle>
                    </MapsMarkerTooltipSettings>
                </MapsMarker>
            </MapsMarkerSettings>
        </MapsLayer>
    </MapsLayers>
</SfMaps>

@code {
    public class PopulationCityDetails
    {
        public string Name { get; set; }
        public double Latitude { get; set; }
        public double Longitude { get; set; }
        public double Population { get; set; }
        public string Color { get; set; }
    };

    public List<PopulationCityDetails> PopulatedCities = new List<PopulationCityDetails> {
        new PopulationCityDetails { Name = "Tokyo", Latitude = 35.6805245924747, Longitude = 139.76770396213337, Population = 37435191, Color = "#2EB6C8" },
        new PopulationCityDetails { Name = "Delhi", Latitude = 28.644800, Longitude = 77.216721, Population = 29399141, Color = "#4A97F4" },
        new PopulationCityDetails { Name = "Shanghai", Latitude = 31.224361, Longitude = 121.469170, Population = 26317104, Color = "#498082" },
        new PopulationCityDetails { Name = "Sao Paulo", Latitude = -23.550424484747914, Longitude = -46.646471636488315, Population = 21846507, Color = "#FB9E67" },
        new PopulationCityDetails { Name = "Mexico City", Latitude = 19.427402397418774, Longitude = -99.131123716666, Population = 21671908, Color = "#8F9DE3" },
        new PopulationCityDetails { Name = "Cairo", Latitude = 30.033333, Longitude = 31.233334, Population = 20484965, Color = "#7B9FB0" },
        new PopulationCityDetails { Name = "Dhaka", Latitude = 23.777176, Longitude = 90.399452, Population = 20283552, Color = "#4DB647" },
        new PopulationCityDetails { Name = "Mumbai", Latitude = 19.08492049646163, Longitude = 72.87449446319248, Population = 20185064, Color = "#30BEFF" },
        new PopulationCityDetails { Name = "Beijing", Latitude = 39.90395970055848, Longitude = 116.38831272088059, Population = 20035455, Color = "#Ac72AD" },
        new PopulationCityDetails { Name = "Osaka", Latitude = 34.69024500601642, Longitude = 135.50746225677142, Population = 19222665, Color = "#EFE23E" }
    };
}