OpenStreetMap in Blazor Maps Component
23 Jun 20268 minutes to read
OpenStreetMap (OSM) is a collaborative map provider that offers free, openly licensed map tiles. It serves small tile images based on requests and combines them to render the visible map area in the Maps component.
Adding OpenStreetMap
Render OSM tiles by setting the UrlTemplate property to the OSM tile server URL. For details about OSM tile servers, see the OpenStreetMap tiles documentation.
@using Syncfusion.Blazor.Maps

<SfMaps>
    <MapsLayers>
        <MapsLayer UrlTemplate="https://tile.openstreetmap.org/level/tileX/tileY.png" TValue="string"></MapsLayer>
    </MapsLayers>
</SfMaps>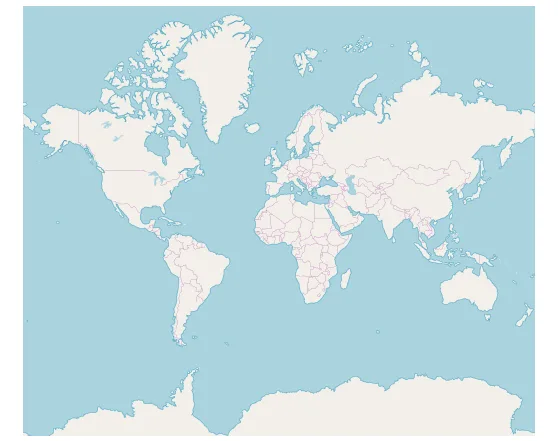
Enable zooming and panning
The OSM layer supports zooming and panning. Zooming provides a closer view of specific regions for detailed analysis, and panning moves the map to focus on a target area. To enable zooming, set the Enable property to true in MapsZoomSettings. Panning is enabled by default and can be configured using the EnablePanning property.
@using Syncfusion.Blazor.Maps

<SfMaps>
    @* To zoom and pan *@
    <MapsZoomSettings Enable="true">
        <MapsZoomToolbarSettings>
            <MapsZoomToolbarButton ToolbarItems="new List<ToolbarItem>() { ToolbarItem.Zoom, ToolbarItem.ZoomIn, ToolbarItem.ZoomOut,
            ToolbarItem.Pan, ToolbarItem.Reset }"></MapsZoomToolbarButton>
        </MapsZoomToolbarSettings>
    </MapsZoomSettings>
    <MapsLayers>
        <MapsLayer UrlTemplate="https://tile.openstreetmap.org/level/tileX/tileY.png" TValue="string"></MapsLayer>
    </MapsLayers>
</SfMaps>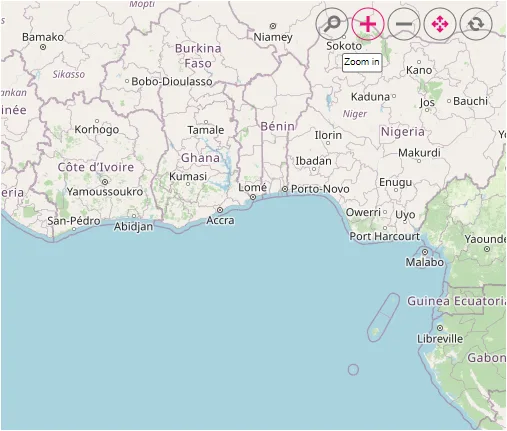
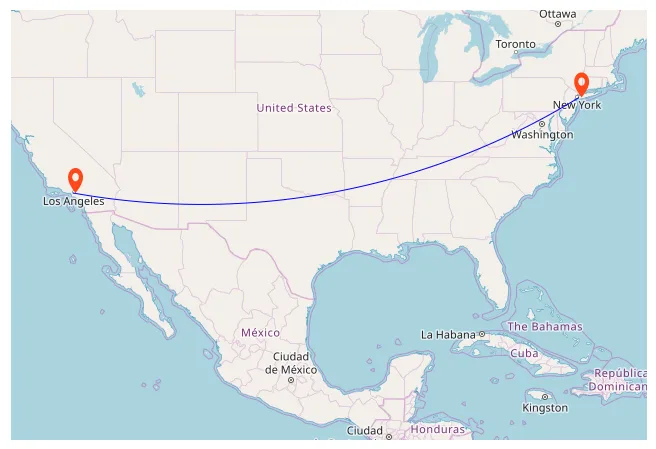
Adding markers and navigation line
Markers can be added to OSM layers by providing latitude and longitude for each location using MapsMarker. A navigation line can be drawn to highlight a path between locations by supplying coordinate arrays in MapsNavigationLine.
@using Syncfusion.Blazor.Maps

<SfMaps>
    <MapsZoomSettings ZoomFactor="4"></MapsZoomSettings>
    <MapsCenterPosition Latitude="29.394708" Longitude="-94.954653"></MapsCenterPosition>
    <MapsLayers>
        <MapsLayer UrlTemplate="https://tile.openstreetmap.org/level/tileX/tileY.png" TValue="string">
            @* Add marker *@
            <MapsMarkerSettings>
                <MapsMarker Visible="true" Height="25" Width="15" DataSource="Cities" TValue="City">
                </MapsMarker>
            </MapsMarkerSettings>
            @* Add navigation line *@
            <MapsNavigationLines>
                <MapsNavigationLine Visible="true" Color="blue" Angle="0.1" Latitude="new double[]{34.060620, 40.724546}"
                                    Longitude="new double[]{-118.330491,-73.850344}">
                </MapsNavigationLine>
            </MapsNavigationLines>
        </MapsLayer>
    </MapsLayers>
</SfMaps>

@code {
    public class City
    {
        public double Latitude { get; set; }
        public double Longitude { get; set; }
        public string Name { get; set; }
    }

    private List<City> Cities = new List<City> {
        new City { Latitude = 34.060620, Longitude = -118.330491,  Name = "California" },
        new City{ Latitude = 40.724546, Longitude = -73.850344,  Name = "New York"}
    };
}
Adding sublayer
Any GeoJSON shape can be rendered as a sublayer on top of the OSM layer to emphasize a specific continent or country. Add another layer and set the Type of MapsLayer to SubLayer.
@using Syncfusion.Blazor.Maps

<SfMaps>
    <MapsLayers>
        <MapsLayer UrlTemplate="https://tile.openstreetmap.org/level/tileX/tileY.png" TValue="string">
        </MapsLayer>
        @* To add geometry shape as sublayer *@
        <MapsLayer ShapeData='new {dataOptions = "https://cdn.syncfusion.com/maps/map-data/africa.json"}'
                   Type="Syncfusion.Blazor.Maps.Type.SubLayer" TValue="string">
            <MapsShapeSettings Fill="blue"></MapsShapeSettings>
        </MapsLayer>
    </MapsLayers>
</SfMaps>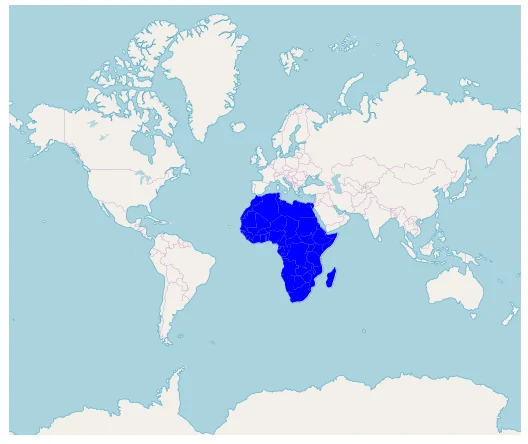
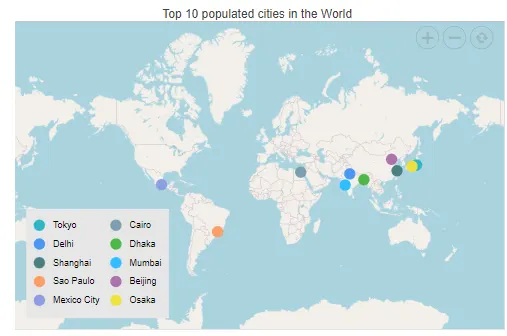
Enable legend
A legend can be added to tile maps by setting the Visible property of MapsLegendSettings to true.
@using Syncfusion.Blazor.Maps

<SfMaps Format="N0" EnableGroupingSeparator="true">
    <MapsZoomSettings Enable="true">
        <MapsZoomToolbarSettings>
            <MapsZoomToolbarTooltipSettings FontFamily="inherit"></MapsZoomToolbarTooltipSettings>
        </MapsZoomToolbarSettings>
    </MapsZoomSettings>
    <MapsLegendSettings Visible="true" Position="LegendPosition.Float" Height="123px" Width="200px" Type="LegendType.Markers" X="10" Y="247" Background="#E6E6E6" ShapePadding="10">
        <MapsLegendTextStyle FontFamily="inherit" Color="#000000" />
    </MapsLegendSettings>
    <MapsTitleSettings Text="Top 10 populated cities in the World">
        <MapsTitleTextStyle Size="16px" FontFamily="inherit" />
    </MapsTitleSettings>
    <MapsLayers>
        <MapsLayer UrlTemplate="https://a.tile.openstreetmap.org/level/tileX/tileY.png" TValue="string">
        <MapsMarkerSettings>
                <MapsMarker Visible="true" TValue="PopulationCityDetails" DataSource="@PopulatedCities" Shape="MarkerType.Circle" Fill="#FFFFFF" ColorValuePath="Color" LegendText="Name" Height="15" Width="15">
                    <MapsMarkerTooltipSettings Visible="true" ValuePath="Population" Format="City Name: ${Name}</br>Population: ${Population} million">
                        <MapsMarkerTooltipTextStyle FontFamily="inherit"></MapsMarkerTooltipTextStyle>
                    </MapsMarkerTooltipSettings>
                </MapsMarker>
            </MapsMarkerSettings>
        </MapsLayer>
    </MapsLayers>
</SfMaps>

@code {
    public class PopulationCityDetails
    {
        public string Name { get; set; }
        public double Latitude { get; set; }
        public double Longitude { get; set; }
        public double Population { get; set; }
        public string Color { get; set; }
    };

    public List<PopulationCityDetails> PopulatedCities = new List<PopulationCityDetails> {
        new PopulationCityDetails { Name = "Tokyo", Latitude = 35.6805245924747, Longitude = 139.76770396213337, Population = 37435191, Color = "#2EB6C8"},
        new PopulationCityDetails { Name = "Delhi", Latitude = 28.644800, Longitude = 77.216721, Population = 29399141, Color = "#4A97F4"},
        new PopulationCityDetails { Name = "Shanghai", Latitude = 31.224361, Longitude = 121.469170, Population = 26317104, Color = "#498082"},
        new PopulationCityDetails { Name = "Sao Paulo", Latitude = -23.550424484747914, Longitude = -46.646471636488315, Population = 21846507, Color = "#FB9E67"},
        new PopulationCityDetails { Name = "Mexico City", Latitude = 19.427402397418774, Longitude = -99.131123716666, Population = 21671908, Color = "#8F9DE3"},
        new PopulationCityDetails { Name = "Cairo ", Latitude = 30.033333, Longitude = 31.233334, Population = 20484965, Color = "#7B9FB0"},
        new PopulationCityDetails { Name = "Dhaka", Latitude = 23.777176, Longitude = 90.399452, Population = 20283552, Color = "#4DB647"},
        new PopulationCityDetails { Name = "Mumbai", Latitude = 19.08492049646163, Longitude = 72.87449446319248, Population = 20185064, Color = "#30BEFF"},
        new PopulationCityDetails { Name = "Beijing", Latitude = 39.90395970055848, Longitude = 116.38831272088059, Population = 20035455, Color = "#Ac72AD"},
        new PopulationCityDetails { Name = "Osaka", Latitude = 34.69024500601642, Longitude = 135.50746225677142, Population = 19222665, Color = "#EFE23E"}
    };
}