Other Maps in Blazor Maps Component
23 Jun 20269 minutes to read
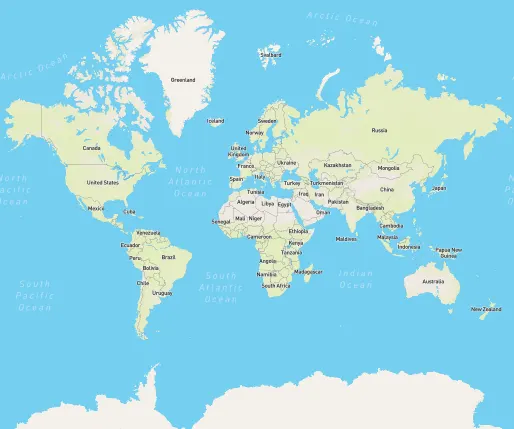
Apart from OpenStreetMap and Bing Maps, maps from other online providers can be rendered by assigning the provider’s tile URL to the UrlTemplate property. The URL template design supports any provider that follows the standard tile format shown below.
Sample Template: https://< domain_name >/maps/basic/{z}/{x}/{y}.png
- ”${z}” - It represents zoom factor (level).
- ”${x}” - It indicates tile image x-position (tileX).
- ”${y}” - It indicates tile image y-position (tileY).
If an access key is required by the provider, append it to the URL to load personalized maps with custom content and imagery.
The following example shows how to add a TomTom map. Generate an API key using the steps in the TomTom documentation and append the key to the URL.
@using Syncfusion.Blazor.Maps

<SfMaps>
    <MapsLayers>
        <MapsLayer UrlTemplate="http://api.tomtom.com/map/1/tile/basic/main/level/tileX/tileY.png?key=subscription_key" TValue="string">
        </MapsLayer>
    </MapsLayers>
</SfMaps>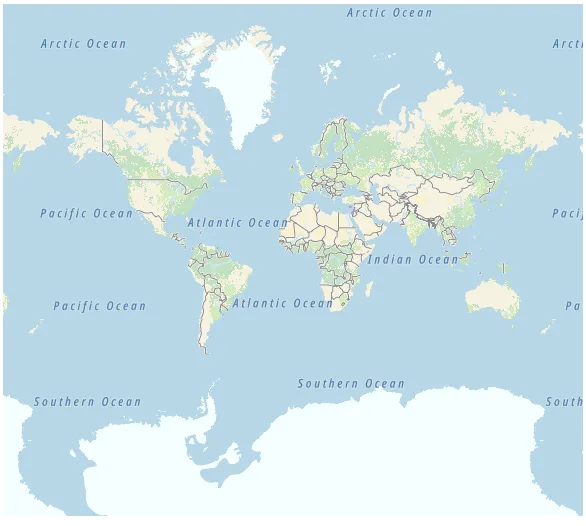
Enable zooming and panning
Tile map layers support zooming and panning. Zooming provides a closer view for detailed analysis. Panning moves the map to focus on a specific area. To enable zooming, set the Enable property to true in MapsZoomSettings. Panning is enabled by default and can be configured using the EnablePanning property.
@using Syncfusion.Blazor.Maps

<SfMaps>
    @* To zoom and pan *@
    <MapsZoomSettings Enable="true">
        <MapsZoomToolbarSettings>
            <MapsZoomToolbarButton ToolbarItems="new List<ToolbarItem>() { ToolbarItem.Zoom, ToolbarItem.ZoomIn, ToolbarItem.ZoomOut,
            ToolbarItem.Pan, ToolbarItem.Reset }"></MapsZoomToolbarButton>
        </MapsZoomToolbarSettings>
    </MapsZoomSettings>
    <MapsLayers>
        <MapsLayer UrlTemplate="http://api.tomtom.com/map/1/tile/basic/main/level/tileX/tileY.png?key=subscription_key" TValue="string">
        </MapsLayer>
    </MapsLayers>
</SfMaps>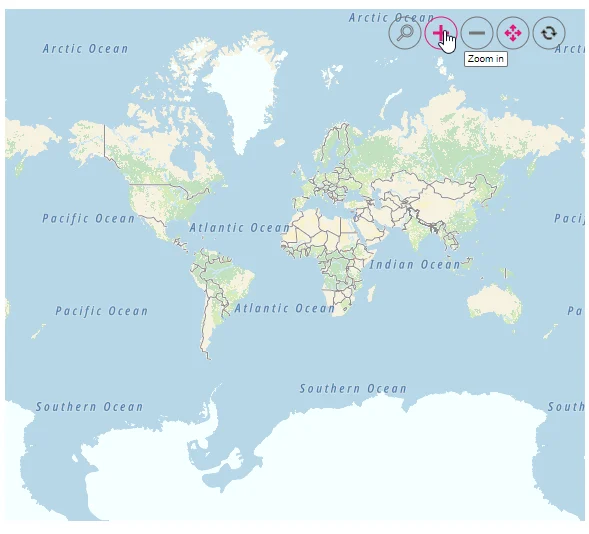
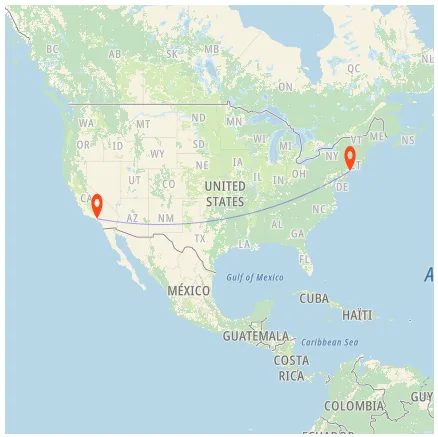
Adding markers and navigation line
Markers can be added to tile layers by providing the latitude and longitude for each location using the MapsMarker class. Navigation lines can be drawn to highlight a path between locations using MapsNavigationLine.
@using Syncfusion.Blazor.Maps

<SfMaps>
    <MapsZoomSettings ZoomFactor="4"></MapsZoomSettings>
    <MapsCenterPosition Latitude="29.394708" Longitude="-94.954653"></MapsCenterPosition>
    <MapsLayers>
        <MapsLayer UrlTemplate="http://api.tomtom.com/map/1/tile/basic/main/level/tileX/tileY.png?key=subscription_key" TValue="string">
            @* Add markers *@
            <MapsMarkerSettings>
                <MapsMarker Visible="true" Height="25" Width="15" DataSource="Cities" TValue="City">
                </MapsMarker>
            </MapsMarkerSettings>
            @* Add navigation line *@
            <MapsNavigationLines>
                <MapsNavigationLine Visible="true" Color="blue" Angle="0.1" Latitude="new double[]{34.060620, 40.724546}"
                                    Longitude="new double[]{-118.330491,-73.850344}">
                </MapsNavigationLine>
            </MapsNavigationLines>
        </MapsLayer>
    </MapsLayers>
</SfMaps>

@code {
    public class City
    {
        public double Latitude { get; set; }
        public double Longitude { get; set; }
        public string Name { get; set; }
    }

    private List<City> Cities = new List<City> {
        new City { Latitude = 34.060620, Longitude = -118.330491,  Name="California" },
        new City{ Latitude = 40.724546, Longitude = -73.850344,  Name="New York"}
    };
}
Adding sublayer
Any GeoJSON shape can be rendered as a sublayer on top of the tile layer to highlight a continent or country by adding another layer and setting the Type property of MapsLayer to SubLayer.
@using Syncfusion.Blazor.Maps

<SfMaps>
    <MapsLayers>
        <MapsLayer UrlTemplate="http://api.tomtom.com/map/1/tile/basic/main/level/tileX/tileY.png?key=subscription_key" TValue="string">
        </MapsLayer>
        @* To add geometry shape as sublayer *@
        <MapsLayer ShapeData='new {dataOptions = "https://cdn.syncfusion.com/maps/map-data/africa.json"}'
                   Type="Syncfusion.Blazor.Maps.Type.SubLayer" TValue="string">
            <MapsShapeSettings Fill="blue"></MapsShapeSettings>
        </MapsLayer>
    </MapsLayers>
</SfMaps>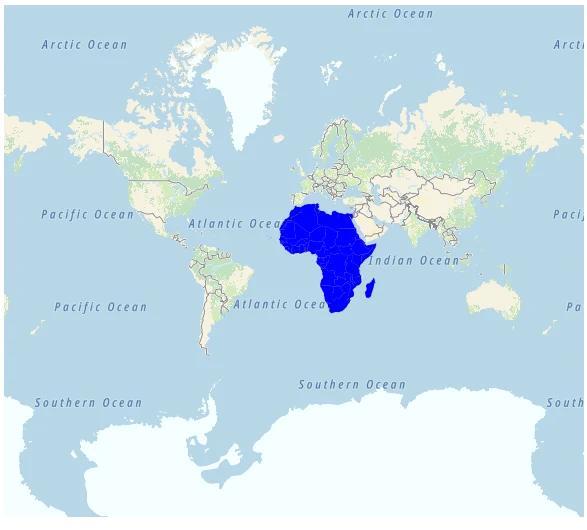
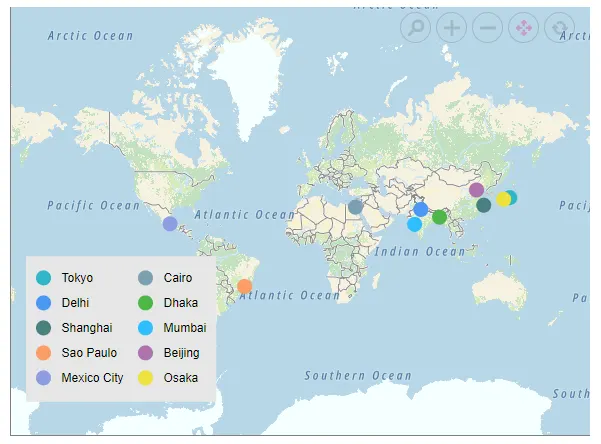
Enable legend
A legend can be added to a tile map by setting the Visible property of MapsLegendSettings to true.
@using Syncfusion.Blazor.Maps

<SfMaps Format="N0" EnableGroupingSeparator="true">
    <MapsZoomSettings Enable="true">
        <MapsZoomToolbarSettings>
            <MapsZoomToolbarTooltipSettings FontFamily="inherit"></MapsZoomToolbarTooltipSettings>
        </MapsZoomToolbarSettings>
    </MapsZoomSettings>
    <MapsLegendSettings Visible="true" Position="LegendPosition.Float" Height="123px" Width="200px" Type="LegendType.Markers" X="10" Y="247" Background="#E6E6E6" ShapePadding="10">
        <MapsLegendTextStyle FontFamily="inherit" Color="#000000" />
    </MapsLegendSettings>
    <MapsTitleSettings Text="Top 10 populated cities in the World">
        <MapsTitleTextStyle Size="16px" FontFamily="inherit" />
    </MapsTitleSettings>
    <MapsLayers>
        <MapsLayer UrlTemplate="http://api.tomtom.com/map/1/tile/basic/main/level/tileX/tileY.png?key=subscription_key" TValue="string">
        <MapsMarkerSettings>
                <MapsMarker Visible="true" TValue="PopulationCityDetails" DataSource="@PopulatedCities" Shape="MarkerType.Circle" Fill="#FFFFFF" ColorValuePath="Color" LegendText="Name" Height="15" Width="15">
                    <MapsMarkerTooltipSettings Visible="true" ValuePath="Population" Format="City Name: ${Name}</br>Population: ${Population} million">
                        <MapsMarkerTooltipTextStyle FontFamily="inherit"></MapsMarkerTooltipTextStyle>
                    </MapsMarkerTooltipSettings>
                </MapsMarker>
            </MapsMarkerSettings>
        </MapsLayer>
    </MapsLayers>
</SfMaps>

@code {
    public class PopulationCityDetails
    {
        public string Name { get; set; }
        public double Latitude { get; set; }
        public double Longitude { get; set; }
        public double Population { get; set; }
        public string Color { get; set; }
    };

    public List<PopulationCityDetails> PopulatedCities = new List<PopulationCityDetails> {
        new PopulationCityDetails { Name = "Tokyo", Latitude = 35.6805245924747, Longitude = 139.76770396213337, Population = 37435191, Color = "#2EB6C8" },
        new PopulationCityDetails { Name = "Delhi", Latitude = 28.644800, Longitude = 77.216721, Population = 29399141, Color = "#4A97F4" },
        new PopulationCityDetails { Name = "Shanghai", Latitude = 31.224361, Longitude = 121.469170, Population = 26317104, Color = "#498082" },
        new PopulationCityDetails { Name = "Sao Paulo", Latitude = -23.550424484747914, Longitude = -46.646471636488315, Population = 21846507, Color = "#FB9E67" },
        new PopulationCityDetails { Name = "Mexico City", Latitude = 19.427402397418774, Longitude = -99.131123716666, Population = 21671908, Color = "#8F9DE3" },
        new PopulationCityDetails { Name = "Cairo", Latitude = 30.033333, Longitude = 31.233334, Population = 20484965, Color = "#7B9FB0" },
        new PopulationCityDetails { Name = "Dhaka", Latitude = 23.777176, Longitude = 90.399452, Population = 20283552, Color = "#4DB647" },
        new PopulationCityDetails { Name = "Mumbai", Latitude = 19.08492049646163, Longitude = 72.87449446319248, Population = 20185064, Color = "#30BEFF" },
        new PopulationCityDetails { Name = "Beijing", Latitude = 39.90395970055848, Longitude = 116.38831272088059, Population = 20035455, Color = "#Ac72AD" },
        new PopulationCityDetails { Name = "Osaka", Latitude = 34.69024500601642, Longitude = 135.50746225677142, Population = 19222665, Color = "#EFE23E"}
    };
}
Other supportive online map service providers
The Maps component can render maps from the following online providers:
- MapBox
- ESRI
@using Syncfusion.Blazor.Maps

<SfMaps>
    <MapsLayers>
        @* Renders Mapbox map *@
        <MapsLayer UrlTemplate="https://api.mapbox.com/styles/v1/mapbox/streets-v11/tiles/level/tileX/tileY?access_token=" TValue="string">
        </MapsLayer>
        @* Renders ESRI map *@
        <!--<MapsLayer UrlTemplate="https://ibasemaps-api.arcgis.com/arcgis/rest/services/World_Imagery/MapServer/tile/level/tileY/tileX?apiKey=subscription_key" TValue="string">
        </MapsLayer>-->
    </MapsLayers>
</SfMaps>