How can I help you?
Axis in Blazor Smith Chart Component
28 Sep 20238 minutes to read
Smith Chart supports two different types of axes. They are:
- Horizontal Axis - The axis is drawn as a straight line in the horizontal direction of the Smith Chart.
- Radial Axis - The axis is drawn as a circular path.
Labels Customization
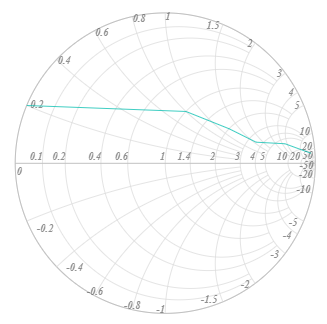
Axis labels are used to indicate what type of data is bound for the Smith Chart. The use of axis labels makes it easy to determine at which interval chart is being rendered. The axis labels for the horizontal and radial axes can be customized using the properties listed as following.
- Visible - Used to specify the visibility of the axis.
- LabelPosition - Used to place labels either inside or outside the axis line.
- LabelIntersectAction - Used to hide labels when intersecting.
- SmithChartRadialAxisLabelStyle and SmithChartHorizontalAxisLabelStyle - Used to customize properties such as FontFamily, FontWeight, FontStyle, Opacity, Color, and Size.
@using Syncfusion.Blazor.Charts

<SfSmithChart>
    <SmithChartHorizontalAxis>
        <SmithChartHorizontalAxisLabelStyle FontFamily="Times New Roman"
                                            FontWeight="bold"
                                            FontStyle="Italic"
                                            Opacity='0.75'
                                            Size="14px">
        </SmithChartHorizontalAxisLabelStyle>
    </SmithChartHorizontalAxis>
    <SmithChartRadialAxis LabelPosition='AxisLabelPosition.Inside'
                          LabelIntersectAction='SmithChartLabelIntersectAction.None'>
        <SmithChartRadialAxisLabelStyle FontFamily="Times New Roman"
                                        FontWeight="bold"
                                        FontStyle="Italic"
                                        Opacity='0.75'
                                        Size="14px">
        </SmithChartRadialAxisLabelStyle>
    </SmithChartRadialAxis>
    <SmithChartSeriesCollection>
        <SmithChartSeries DataSource='TransmissionData' Reactance="Reactance" Resistance="Resistance">
        </SmithChartSeries>
    </SmithChartSeriesCollection>
</SfSmithChart>

@code {
    public class SmithChartData
    {
        public double? Resistance { get; set; }
        public double? Reactance { get; set; }
    };
    public List<SmithChartData> TransmissionData = new List<SmithChartData> {
        new SmithChartData { Resistance= 10, Reactance= 25 },
        new SmithChartData { Resistance= 6, Reactance= 4.5 },
        new SmithChartData { Resistance= 3.5, Reactance= 1.6 },
        new SmithChartData { Resistance= 2, Reactance= 1.2 },
        new SmithChartData { Resistance= 1, Reactance= 0.8 },
        new SmithChartData { Resistance= 0, Reactance= 0.2 }
    };
}
Gridlines
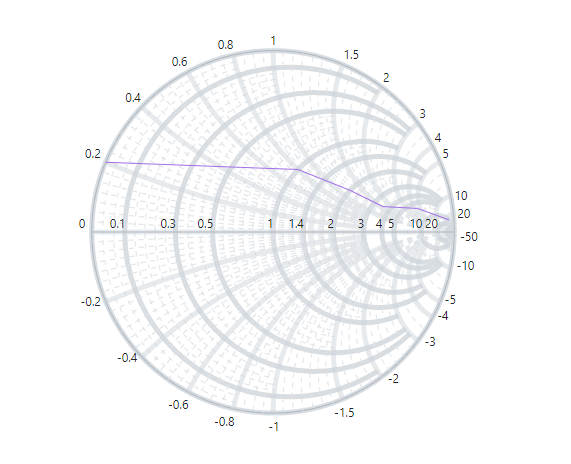
Gridlines on the horizontal and the radial axes can be used to make data in a chart easier to see. Gridlines extend from any horizontal or radial axis around the plot area of the Smith Chart. Both the horizontal and radial axes support major and minor gridlines. Major gridlines are drawn from the position in which the labels are rendered. Minor gridlines are drawn between two major gridlines using the Count property in the minor gridlines.
The following properties can be customized in both the major and minor gridlines.
- Width - Used to customize the width of the gridlines.
- DashArray - Used to customize whether the gridline has to render as normal line or dashed line.
- Visible - Used to enable or disable the visibility of the gridlines.
- Opacity - Used to customize the opacity of the major gridlines.
- Color - Used to customize the color of the major gridlines.
- Count - Used to customize the count of the minor gridlines.
@using Syncfusion.Blazor.Charts

<SfSmithChart>
    <SmithChartHorizontalAxis>
        <SmithChartHorizontalMajorGridLines Visible='true' Opacity='0.8' Width='5'>
        </SmithChartHorizontalMajorGridLines>
        <SmithChartHorizontalMinorGridLines Visible='true' DashArray="5" Count="10">
        </SmithChartHorizontalMinorGridLines>
    </SmithChartHorizontalAxis>
    <SmithChartRadialAxis>
        <SmithChartRadialMajorGridLines Visible='true' Opacity='0.5' Width='5'>
        </SmithChartRadialMajorGridLines>
        <SmithChartRadialMinorGridLines Visible='true' DashArray="5" Count="10">
        </SmithChartRadialMinorGridLines>
    </SmithChartRadialAxis>
    <SmithChartSeriesCollection>
        <SmithChartSeries DataSource='TransmissionData' Reactance="Reactance" Resistance="Resistance">
        </SmithChartSeries>
    </SmithChartSeriesCollection>
</SfSmithChart>

@code {
    public class SmithChartData
    {
        public double? Resistance { get; set; }
        public double? Reactance { get; set; }
    };
    public List<SmithChartData> TransmissionData = new List<SmithChartData> {
        new SmithChartData { Resistance= 10, Reactance= 25 },
        new SmithChartData { Resistance= 6, Reactance= 4.5 },
        new SmithChartData { Resistance= 3.5, Reactance= 1.6 },
        new SmithChartData { Resistance= 2, Reactance= 1.2 },
        new SmithChartData { Resistance= 1, Reactance= 0.8 },
        new SmithChartData { Resistance= 0, Reactance= 0.2 }
    };
}
Axis Line
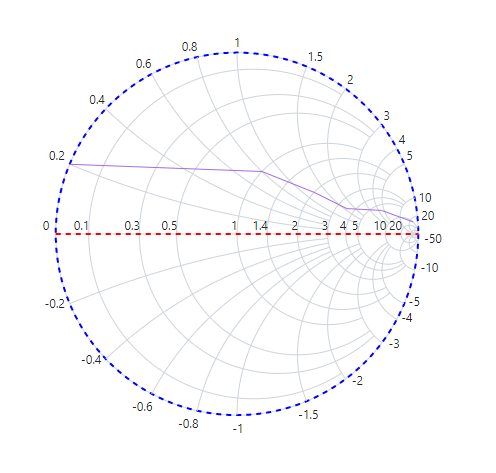
By default, the visibility of the axis line is true. Its visibility can be changed using the Visible property. Other than the visibility, the following properties can be used to customize the axis line.
- Width - Used to customize the width of the axis line.
- DashArray - Used to render the axis line as dashed line.
- Visible - Used to enable or disable the visibility of the axis line.
- Color - Used to customize the axis line color.
@using Syncfusion.Blazor.Charts

<SfSmithChart>
    <SmithChartHorizontalAxis>
        <SmithChartHorizontalAxisLine Width="2" Visible="true" DashArray="5" Color="blue">
        </SmithChartHorizontalAxisLine>
    </SmithChartHorizontalAxis>
    <SmithChartRadialAxis>
        <SmithChartRadialAxisLine Width="2" Visible="true" DashArray="5" Color="red">
        </SmithChartRadialAxisLine>
    </SmithChartRadialAxis>
    <SmithChartSeriesCollection>
        <SmithChartSeries DataSource='TransmissionData' Reactance="Reactance" Resistance="Resistance">
        </SmithChartSeries>
    </SmithChartSeriesCollection>
</SfSmithChart>

@code {
    public class SmithChartData
    {
        public double? Resistance { get; set; }
        public double? Reactance { get; set; }
    };
    public List<SmithChartData> TransmissionData = new List<SmithChartData> {
        new SmithChartData { Resistance= 10, Reactance= 25 },
        new SmithChartData { Resistance= 6, Reactance= 4.5 },
        new SmithChartData { Resistance= 3.5, Reactance= 1.6 },
        new SmithChartData { Resistance= 2, Reactance= 1.2 },
        new SmithChartData { Resistance= 1, Reactance= 0.8 },
        new SmithChartData { Resistance= 0, Reactance= 0.2 }
    };
}