Axis Customization in Blazor Sparkline Component
29 Jun 20265 minutes to read
Change the Value Type of the Sparkline Chart
The ValueType property specifies the Sparkline value type, which can be Numeric, Category, or DateTime.
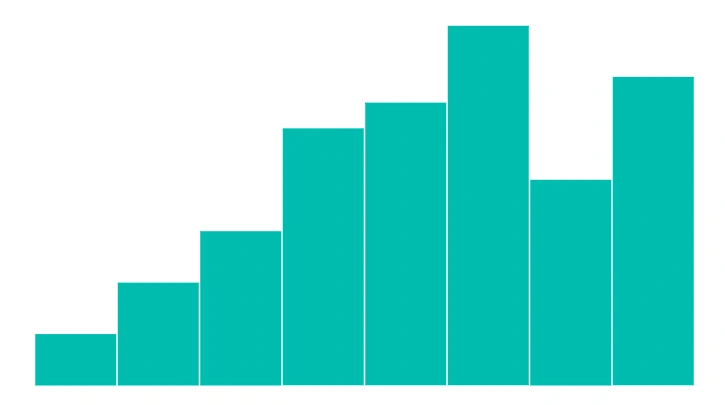
Numeric
A numeric axis value is provided by setting the ValueType property to Numeric.
@using Syncfusion.Blazor.Charts

<SfSparkline DataSource="@ExpenditureReport" TValue="ExpenditureDetails" XName="Year" YName="Expense" Type="SparklineType.Column" ValueType="SparklineValueType.Numeric" Height="250px" Width="450px">
</SfSparkline>

@code {
    public class ExpenditureDetails
    {
        public int Year { get; set; }
        public int Expense { get; set; }
    };

    public List<ExpenditureDetails> ExpenditureReport = new List<ExpenditureDetails> {
        new ExpenditureDetails{ Year = 2010, Expense = 190 },
        new ExpenditureDetails{ Year = 2011, Expense = 165 },
        new ExpenditureDetails{ Year = 2012, Expense = 158 },
        new ExpenditureDetails{ Year = 2013, Expense = 175 },
        new ExpenditureDetails{ Year = 2014, Expense = 200 },
        new ExpenditureDetails{ Year = 2015, Expense = 180 },
        new ExpenditureDetails{ Year = 2016, Expense = 210 }
    };
}
Category
A category axis value is provided by setting the ValueType property to Category.
@using Syncfusion.Blazor.Charts

<SfSparkline XName="EmployeeName"YName="WorkHours"TValue="WorkDetails"DataSource="@EmployeeWorkReport" Type="SparklineType.Column"ValueType="SparklineValueType.Category" Height="250px"Width="450px">
</SfSparkline>

@code {
    public class WorkDetails
    {
        public string EmployeeName { get; set; }
        public double WorkHours { get; set; }
    };

    public List<WorkDetails> EmployeeWorkReport = new List<WorkDetails> {
        new WorkDetails { EmployeeName = "Robert", WorkHours = 60 },
        new WorkDetails { EmployeeName = "Andrew", WorkHours = 65 },
        new WorkDetails { EmployeeName = "Suyama", WorkHours = 70 },
        new WorkDetails { EmployeeName = "Michael", WorkHours = 80 },
        new WorkDetails { EmployeeName = "Janet", WorkHours = 55 },
        new WorkDetails { EmployeeName = "Davolio", WorkHours = 90 },
        new WorkDetails { EmployeeName = "Fuller", WorkHours = 75 },
        new WorkDetails { EmployeeName = "Nancy", WorkHours = 85 }
    };
}
DateTime
A DateTime axis value is provided by setting the ValueType property to DateTime.
@using Syncfusion.Blazor.Charts

<SfSparkline XName="Date" YName="Expense" TValue="ExpenditureDetail" DataSource="@ExpenditureReports" Type="SparklineType.Column" ValueType="SparklineValueType.DateTime" Height="250px" Width="450px">
</SfSparkline>

@code {
    public class ExpenditureDetail
    {
        public DateTime Date { get; set; }
        public double Expense { get; set; }
    }

    public List<ExpenditureDetail> ExpenditureReports = new List<ExpenditureDetail>
    {
        new ExpenditureDetail { Date = new DateTime(2005, 01, 01), Expense = 21 },
        new ExpenditureDetail { Date = new DateTime(2006, 01, 01), Expense = 24 },
        new ExpenditureDetail { Date = new DateTime(2007, 01, 01), Expense = 36 },
        new ExpenditureDetail { Date = new DateTime(2008, 01, 01), Expense = 38 },
        new ExpenditureDetail { Date = new DateTime(2009, 01, 01), Expense = 54 },
        new ExpenditureDetail { Date = new DateTime(2010, 01, 01), Expense = 57 },
        new ExpenditureDetail { Date = new DateTime(2011, 01, 01), Expense = 70 }
    };
}
Change the Min and Max Values of Axis
The minimum and maximum values of the X-axis can be customized using the MinX and MaxX properties of SparklineAxisSettings. The Y-axis min and max values can be set using MinY and MaxY.
@using Syncfusion.Blazor.Charts

<SfSparkline DataSource="@ExpenditureReport" TValue="ExpenditureDetails" XName="Year" YName="Expense" Type="SparklineType.Column" ValueType="SparklineValueType.Numeric" Height="250px" Width="450px">
    <SparklineAxisSettings MinY="100" MaxY="220"></SparklineAxisSettings>
</SfSparkline>
NOTE
Refer to the code block for the ExpenditureReport property value.

Change Value of Axis
The horizontal axis line value can be customized by setting the Value property in SparklineAxisSettings.
@using Syncfusion.Blazor.Charts

<SfSparkline DataSource="@ExpenditureReport" TValue="ExpenditureDetails" XName="Year" YName="Expense" Type="SparklineType.Column" ValueType="SparklineValueType.Numeric" Height="250px" Width="450px">
    <SparklineAxisSettings Value="170"></SparklineAxisSettings>
</SfSparkline>
NOTE
Refer to the code block for the ExpenditureReport property value.

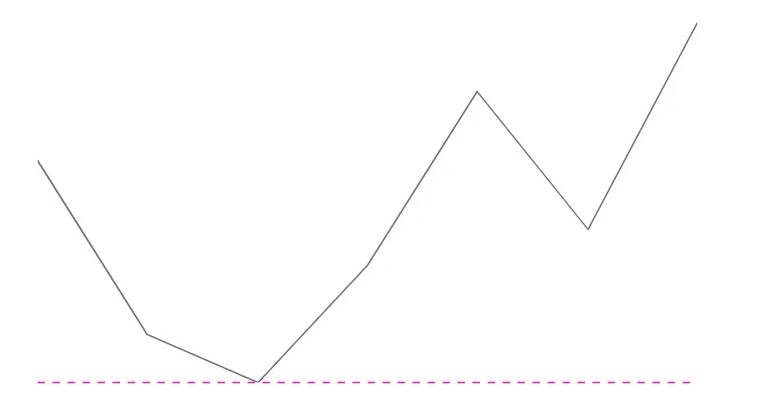
Axis Line Customization
The axis line can be enabled by setting the Visible property to true in SparklineAxisLineSettings.
NOTE
The axis line is not applicable for the WinLoss chart type.
The axis line can be customized using the following properties:
- Color - Specifies the color of the axis line.
- Opacity - Specifies the opacity for the Color of the axis line.
- Width - Specifies the width of the axis line.
- DashArray - Specifies the dash array of the axis line.
@using Syncfusion.Blazor.Charts

<SfSparkline DataSource="ExpenditureReport" TValue="ExpenditureDetails" XName="Year" YName="Expense" Type="SparklineType.Line" Height="250px" Width="450px">
    <SparklineAxisSettings>
        <SparklineAxisLineSettings Visible="true" Color="#ff14ae" DashArray="5" Opacity="1"></SparklineAxisLineSettings>
    </SparklineAxisSettings>
</SfSparkline>
NOTE
Refer to the code block for the ExpenditureReport property value.