Chart Types in Blazor Sparkline Component
4 Nov 20252 minutes to read
Different shapes can be used to represent the Sparkline Chart by specifying the Type property.
Line
The Line chart type renders the Sparkline series as a line.
@using Syncfusion.Blazor.Charts

<SfSparkline DataSource="PopulationData" TValue="PopulationReport" XName="Year" YName="Population" Width="200px" Height="150px" Type="SparklineType.Line">
</SfSparkline>

@code {
    public class PopulationReport
    {
        public int Year { get; set; }
        public int Population { get; set; }
    };

    private List<PopulationReport> PopulationData = new List<PopulationReport> {
        new  PopulationReport { Year = 2005, Population = 20090440 },
        new  PopulationReport { Year = 2006, Population = 20264080 },
        new  PopulationReport { Year = 2007, Population = 20434180 },
        new  PopulationReport { Year = 2008, Population = 21007310 },
        new  PopulationReport { Year = 2009, Population = 21262640 },
        new  PopulationReport { Year = 2010, Population = 21515750 },
        new  PopulationReport { Year = 2011, Population = 21766710 },
        new  PopulationReport { Year = 2012, Population = 22015580 },
        new  PopulationReport { Year = 2013, Population = 22262500 },
        new  PopulationReport { Year = 2014, Population = 22507620 }
    };
}
Column
The Column chart type renders the Sparkline series as columns.
@using Syncfusion.Blazor.Charts

<SfSparkline DataSource="PopulationData" TValue="PopulationReport" XName="Year" YName="Population" Width="500px" Height="150px" Type="SparklineType.Column">
</SfSparkline>
NOTE
Refer to the code block for the PopulationData property value.

Pie
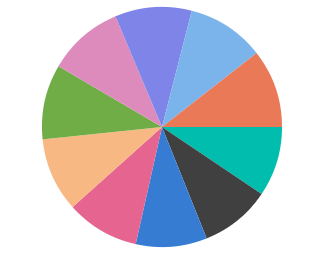
The Pie chart type renders the Sparkline series as a pie chart.
@using Syncfusion.Blazor.Charts

<SfSparkline DataSource="PopulationData" TValue="PopulationReport" XName="Year" YName="Population" Width="500px" Height="250px" Type="SparklineType.Pie">
</SfSparkline>
NOTE
Refer to the code block for the PopulationData property value.

WinLoss
The WinLoss chart type renders the Sparkline series as WinLoss.
@using Syncfusion.Blazor.Charts

<SfSparkline DataSource="new int[]{12, 15, -10, 13, 15, 6, -12, 17, 13, 0, 8, -10}" Width="500px" Height="200px" Type="SparklineType.WinLoss">
</SfSparkline>
Area
The Area chart type renders the Sparkline series as an area chart.
@using Syncfusion.Blazor.Charts

<SfSparkline DataSource="PopulationData" TValue="PopulationReport" XName="Year" YName="Population" Width="500px" Height="100px" Type="SparklineType.Area">
</SfSparkline>
NOTE
Refer to the code block for the PopulationData property value.
