How can I help you?
Data Labels in Blazor Sparkline Component
4 Nov 20254 minutes to read
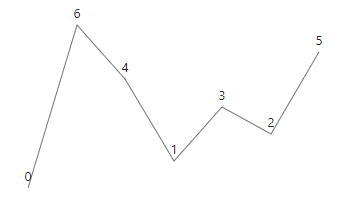
To improve readability, data labels display the value of data points.
Enable Data Label
The Visible property in SparklineDataLabelSettings enables data labels by specifying a collection of special points. The following special points are applicable:
- All – Data label for all points
- Start – Data label for start points
- End – Data label for end points
- High – Data label for high points
- Low – Data label for low points
- Negative – Data label for negative points
- None – Data label for all points are disabled
@using Syncfusion.Blazor.Charts

<SfSparkline DataSource="new int[]{ 0, 6, 4, 1, 3, 2, 5 }" Type="SparklineType.Line" Height="200px" Width="350px">
    <SparklineAxisSettings MinX="-1" MaxX="7" MaxY="7" MinY="-1"></SparklineAxisSettings>
    <SparklineDataLabelSettings Visible="new List<VisibleType>() { VisibleType.All }"></SparklineDataLabelSettings>
</SfSparkline>
Data Label Customization
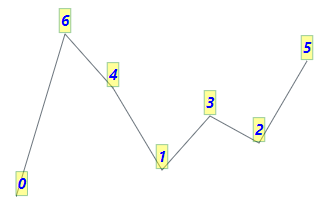
The following properties can be used to customize Sparkline data labels:
- Fill – Specifies color for the Data Label
- Opacity – Specifies opacity of the data label Fill color
- EdgeLabelMode – Specifies controlling option when the label comes in the edge. Available options are the Shift, the None and the Hide
- SparklineFont – Customize the Data Label font family, font style, font weight, color, opacity and size
- SparklineDataLabelBorder – Specifies the color and the width for the Data Label border
- SparklineDataLabelOffset – Specifies the label offset position from its default position
@using Syncfusion.Blazor.Charts

<SfSparkline DataSource="new int[]{ 0, 6, 4, 1, 3, 2, 5 }" Type="SparklineType.Line" Height="200px" Width="350px">
    <SparklineAxisSettings MinX="-1" MaxX="7" MaxY="7" MinY="-1"></SparklineAxisSettings>
    <SparklineDataLabelSettings Visible="new List<VisibleType>() { VisibleType.All }" Fill="yellow" Opacity="0.4" EdgeLabelMode="EdgeLabelMode.Shift">
        <SparklineFont Color="blue" FontStyle="italic" FontWeight="bold" Size="15" Opacity="0.8">
        </SparklineFont>
        <SparklineDataLabelBorder Color="green" Width="1">
        </SparklineDataLabelBorder>
    </SparklineDataLabelSettings>
</SfSparkline>
Format
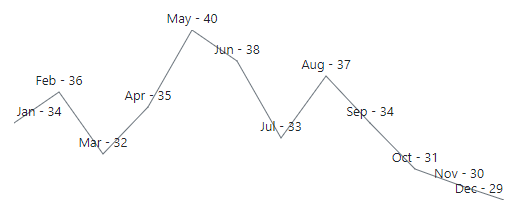
The data label text can be formatted by specifying the property name from the data source to the Format property in SparklineDataLabelSettings. By default, the data label text is based on the YName property.
@using Syncfusion.Blazor.Charts

<SfSparkline DataSource="ClimateData" TValue="WeatherReport" XName="Month" YName="Celsius" ValueType="SparklineValueType.Category" Height="200px" Width="500px">
    <SparklineDataLabelSettings Visible="new List<VisibleType> { VisibleType.All}" Format="${Month} - ${Celsius}" EdgeLabelMode="EdgeLabelMode.Shift">
    </SparklineDataLabelSettings>
    <SparklinePadding Top="25"></SparklinePadding>
</SfSparkline>

@code {
    public class WeatherReport
    {
        public string Month { get; set; }
        public double Celsius { get; set; }
    };

    public List<WeatherReport> ClimateData = new List<WeatherReport> {
        new  WeatherReport { Month = "Jan", Celsius = 34 },
        new  WeatherReport { Month = "Feb", Celsius = 36 },
        new  WeatherReport { Month = "Mar", Celsius = 32 },
        new  WeatherReport { Month = "Apr", Celsius = 35 },
        new  WeatherReport { Month = "May", Celsius = 40 },
        new  WeatherReport { Month = "Jun", Celsius = 38 },
        new  WeatherReport { Month = "Jul", Celsius = 33 },
        new  WeatherReport { Month = "Aug", Celsius = 37 },
        new  WeatherReport { Month = "Sep", Celsius = 34 },
        new  WeatherReport { Month = "Oct", Celsius = 31 },
        new  WeatherReport { Month = "Nov", Celsius = 30 },
        new  WeatherReport { Month = "Dec", Celsius = 29}
    };
}