Axis Customization in Blazor Stock Chart Component
29 Jun 202613 minutes to read
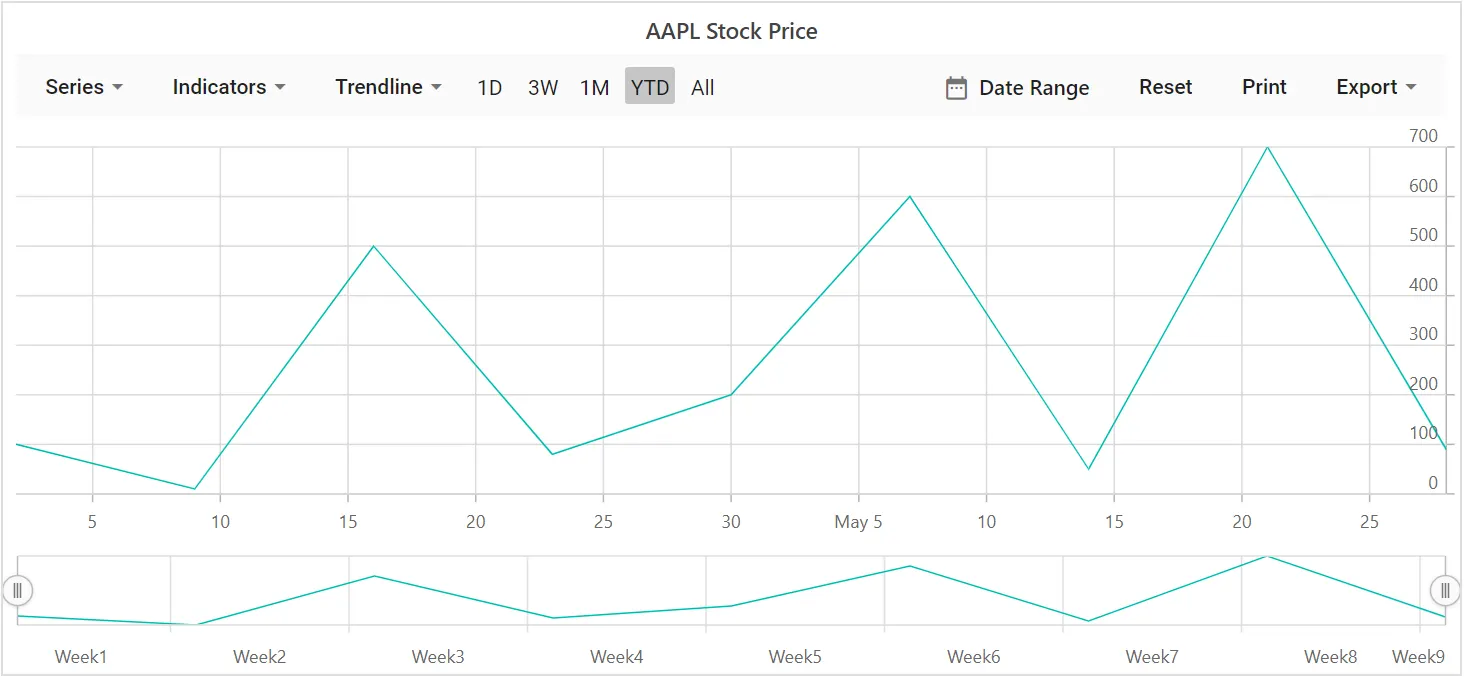
Title
Add a chart title using the Title property to provide quick information about the plotted data. Customize the title style using the TitleStyle property.
@using Syncfusion.Blazor.Charts

<SfStockChart Title="AAPL Stock Price">
    <StockChartSeriesCollection>
        <StockChartSeries DataSource="@StockDetails" Type="ChartSeriesType.Line" XName="Date" YName="Y"></StockChartSeries>
    </StockChartSeriesCollection>
</SfStockChart>

@code {
    public class ChartData
    {
        public DateTime Date { get; set; }
        public Double Y { get; set; }
    }

    public List<ChartData> StockDetails = new List<ChartData>
    {
          new ChartData { Date = new DateTime(2012, 04, 02), Y = 100 },
          new ChartData { Date = new DateTime(2012, 04, 09), Y = 10 },
          new ChartData { Date = new DateTime(2012, 04, 16), Y = 500 },
          new ChartData { Date = new DateTime(2012, 04, 23), Y = 80 },
          new ChartData { Date = new DateTime(2012, 04, 30), Y = 200 },
          new ChartData { Date = new DateTime(2012, 05, 07), Y = 600 },
          new ChartData { Date = new DateTime(2012, 05, 14), Y = 50 },
          new ChartData { Date = new DateTime(2012, 05, 21), Y = 700 },
          new ChartData { Date = new DateTime(2012, 05, 28), Y = 90 }
    };
}
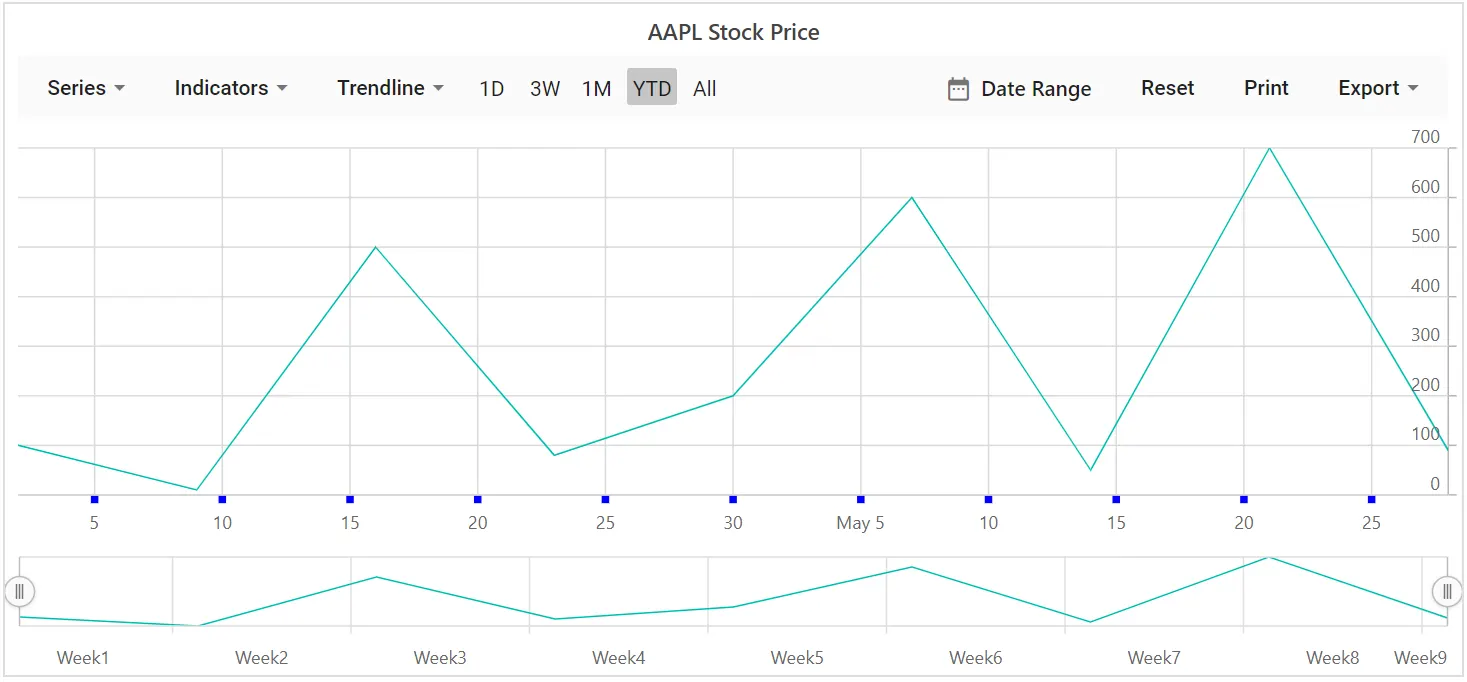
Tick Lines Customization
Customize the Width and Color of minor and major tick lines using the MajorTickLines and MinorTickLines properties on the axis.
@using Syncfusion.Blazor.Charts

<SfStockChart Title="AAPL Stock Price">
    <StockChartPrimaryXAxis>
        <StockChartAxisMajorTickLines Width="5" Color="blue"></StockChartAxisMajorTickLines>
        <StockChartAxisMinorTickLines Width="0" Color="red"></StockChartAxisMinorTickLines>
    </StockChartPrimaryXAxis>

    <StockChartSeriesCollection>
        <StockChartSeries DataSource="@StockDetails" Type="ChartSeriesType.Line" XName="Date" YName="Y"></StockChartSeries>
    </StockChartSeriesCollection>
</SfStockChart>

@code {
    public class ChartData
    {
        public DateTime Date { get; set; }
        public Double Y { get; set; }
    }

    public List<ChartData> StockDetails = new List<ChartData>
    {
        new ChartData { Date = new DateTime(2012, 04, 02), Y = 100 },
        new ChartData { Date = new DateTime(2012, 04, 09), Y = 10 },
        new ChartData { Date = new DateTime(2012, 04, 16), Y = 500 },
        new ChartData { Date = new DateTime(2012, 04, 23), Y = 80 },
        new ChartData { Date = new DateTime(2012, 04, 30), Y = 200 },
        new ChartData { Date = new DateTime(2012, 05, 07), Y = 600 },
        new ChartData { Date = new DateTime(2012, 05, 14), Y = 50 },
        new ChartData { Date = new DateTime(2012, 05, 21), Y = 700 },
        new ChartData { Date = new DateTime(2012, 05, 28), Y = 90 }
    };
}
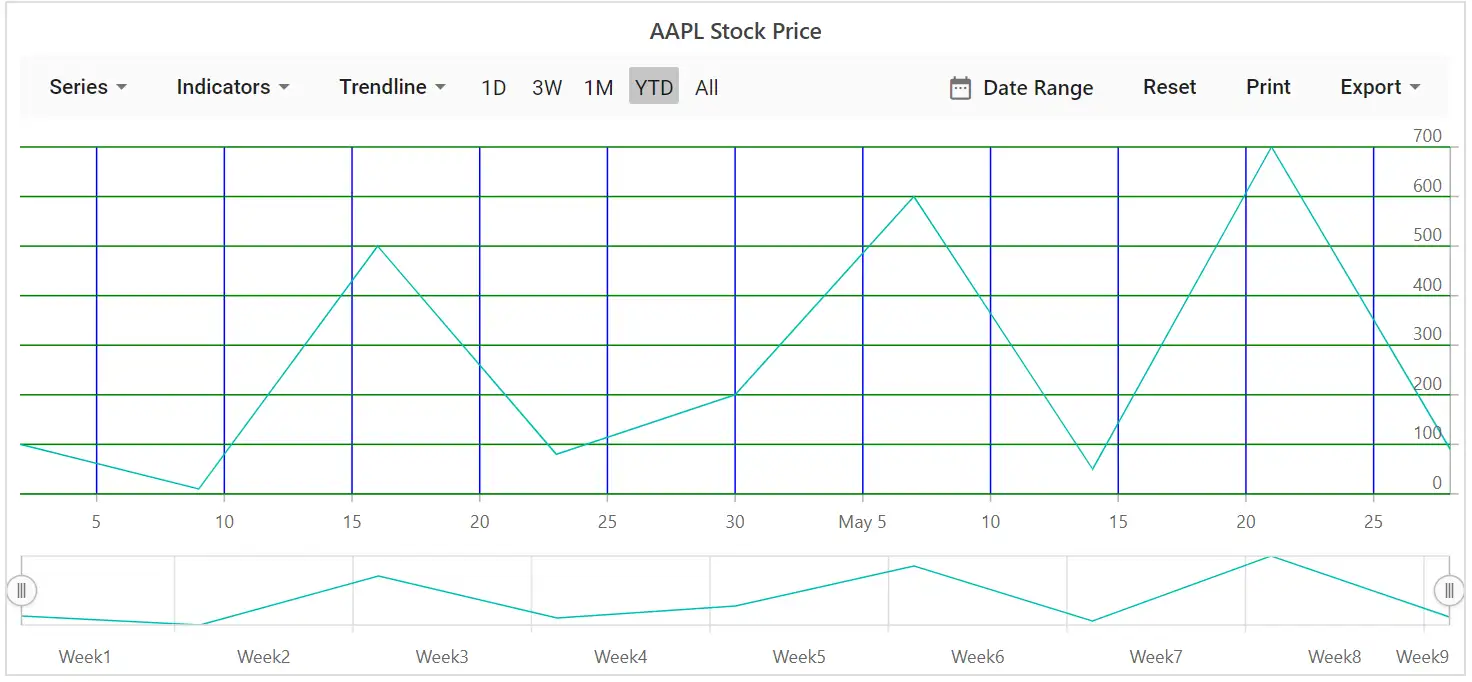
Grid Lines Customization
Customize the Width, Color, and DashArray of minor and major grid lines using the MajorGridLines and MinorGridLines properties on the axis.
@using Syncfusion.Blazor.Charts

<SfStockChart Title="AAPL Stock Price">
    <StockChartPrimaryXAxis>
        <StockChartAxisMajorGridLines Width="1" Color="blue"></StockChartAxisMajorGridLines>
        <StockChartAxisMinorGridLines Width="0" Color="red"></StockChartAxisMinorGridLines>
    </StockChartPrimaryXAxis>

    <StockChartPrimaryYAxis>
        <StockChartAxisMajorGridLines Width="1" Color="green"></StockChartAxisMajorGridLines>
        <StockChartAxisMinorGridLines Width="0" Color="red"></StockChartAxisMinorGridLines>
    </StockChartPrimaryYAxis>

    <StockChartSeriesCollection>
        <StockChartSeries DataSource="@StockDetails" Type="ChartSeriesType.Line" XName="Date" YName="Y"></StockChartSeries>
    </StockChartSeriesCollection>
</SfStockChart>

@code {
    public class ChartData
    {
        public DateTime Date { get; set; }
        public Double Y { get; set; }
    }

    public List<ChartData> StockDetails = new List<ChartData>
    {
        new ChartData { Date = new DateTime(2012, 04, 02), Y = 100 },
        new ChartData { Date = new DateTime(2012, 04, 09), Y = 10 },
        new ChartData { Date = new DateTime(2012, 04, 16), Y = 500 },
        new ChartData { Date = new DateTime(2012, 04, 23), Y = 80 },
        new ChartData { Date = new DateTime(2012, 04, 30), Y = 200 },
        new ChartData { Date = new DateTime(2012, 05, 07), Y = 600 },
        new ChartData { Date = new DateTime(2012, 05, 14), Y = 50 },
        new ChartData { Date = new DateTime(2012, 05, 21), Y = 700 },
        new ChartData { Date = new DateTime(2012, 05, 28), Y = 90}
    };
}
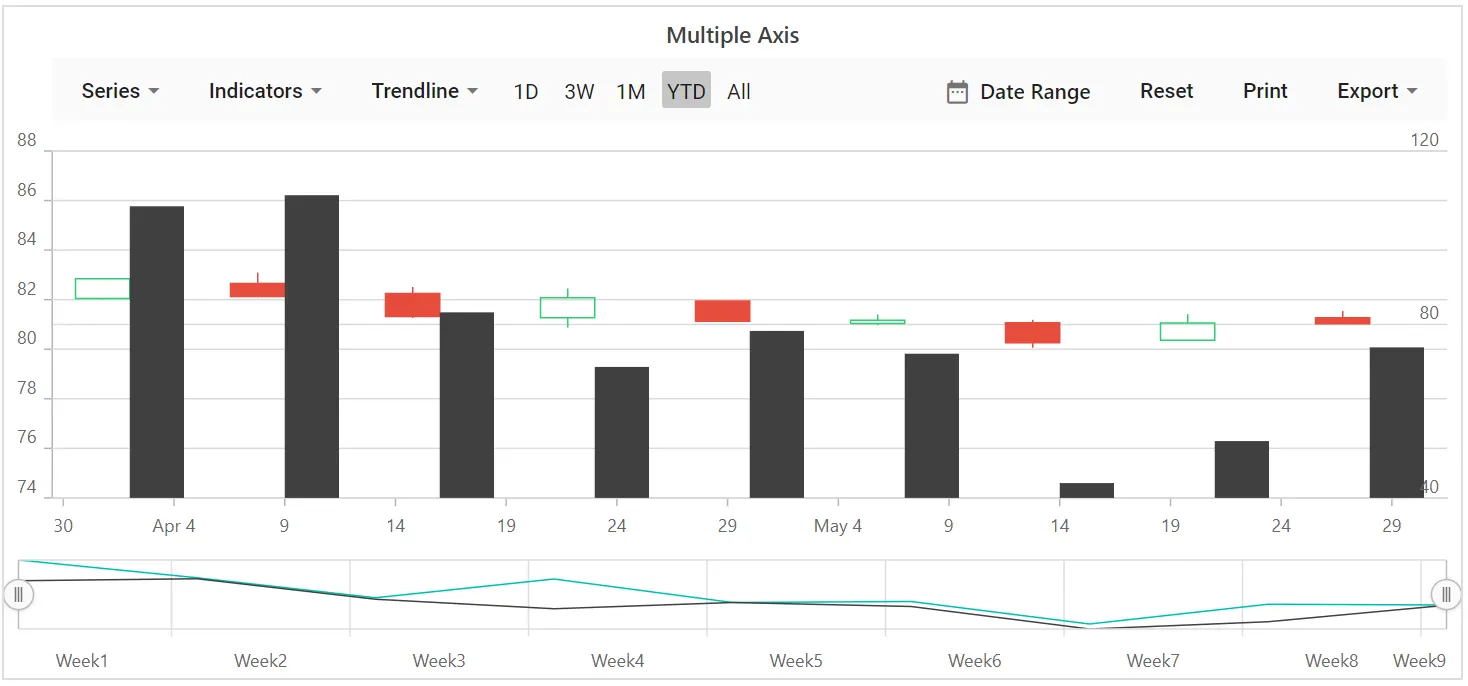
Multiple Axis
In addition to the primary X and Y axes, multiple additional axes can be added to the chart. A series can be associated with an axis by mapping the series to the axis using the axis’s unique Name.
@using Syncfusion.Blazor.Charts

<SfStockChart Title="Multiple Axis">
    <StockChartAxes>
        <StockChartAxis RowIndex="0" Name="yAxis"></StockChartAxis>
    </StockChartAxes>

    <StockChartPrimaryXAxis>
        <StockChartAxisMajorGridLines Width="0"></StockChartAxisMajorGridLines>
    </StockChartPrimaryXAxis>

    <StockChartPrimaryYAxis Interval="40">
        <StockChartAxisLineStyle Color="Transparent"></StockChartAxisLineStyle>
        <StockChartAxisMajorTickLines Width="0" Color="Transparent"></StockChartAxisMajorTickLines>
    </StockChartPrimaryYAxis>

    <StockChartCrosshairSettings Enable="true"></StockChartCrosshairSettings>

    <StockChartSeriesCollection>
        <StockChartSeries DataSource="@StockDetails" Type="ChartSeriesType.Candle" XName="Date" High="High" Low="Low" Open="Open" Close="Close" Name="Apple"></StockChartSeries>
        <StockChartSeries DataSource="@StockDetails" Type="ChartSeriesType.Column" YAxisName="yAxis" XName="Date" YName="Low" Name="Google"></StockChartSeries>
    </StockChartSeriesCollection>
</SfStockChart>

@code {
    public class ChartData
    {
        public DateTime Date { get; set; }
        public Double Open { get; set; }
        public Double Low { get; set; }
        public Double Close { get; set; }
        public Double High { get; set; }
        public Double Volume { get; set; }
    }

    public List<ChartData> StockDetails = new List<ChartData>
    {
        new ChartData { Date = new DateTime(2012, 04, 02), Open = 85.9757, High = 90.6657, Low = 85.7685, Close = 90.5257, Volume = 660187068 },
        new ChartData { Date = new DateTime(2012, 04, 09), Open = 89.4471, High = 92, Low = 86.2157, Close = 86.4614, Volume = 912634864 },
        new ChartData { Date = new DateTime(2012, 04, 16), Open = 87.1514, High = 88.6071, Low = 81.4885, Close = 81.8543, Volume = 1221746066 },
        new ChartData { Date = new DateTime(2012, 04, 23), Open = 81.5157, High = 88.2857, Low = 79.2857, Close = 86.1428, Volume = 965935749 },
        new ChartData { Date = new DateTime(2012, 04, 30), Open = 85.4, High = 85.4857, Low = 80.7385, Close = 80.75, Volume = 615249365 },
        new ChartData { Date = new DateTime(2012, 05, 07), Open = 80.2143, High = 82.2685, Low = 79.8185, Close = 80.9585, Volume = 541742692 },
        new ChartData { Date = new DateTime(2012, 05, 14), Open = 80.3671, High = 81.0728, Low = 74.5971, Close = 75.7685, Volume = 708126233 },
        new ChartData { Date = new DateTime(2012, 05, 21), Open = 76.3571, High = 82.3571, Low = 76.2928, Close = 80.3271, Volume = 682076215 },
        new ChartData { Date = new DateTime(2012, 05, 28), Open = 81.5571, High = 83.0714, Low = 80.0743, Close = 80.1414, Volume = 480059584 }
    };
}
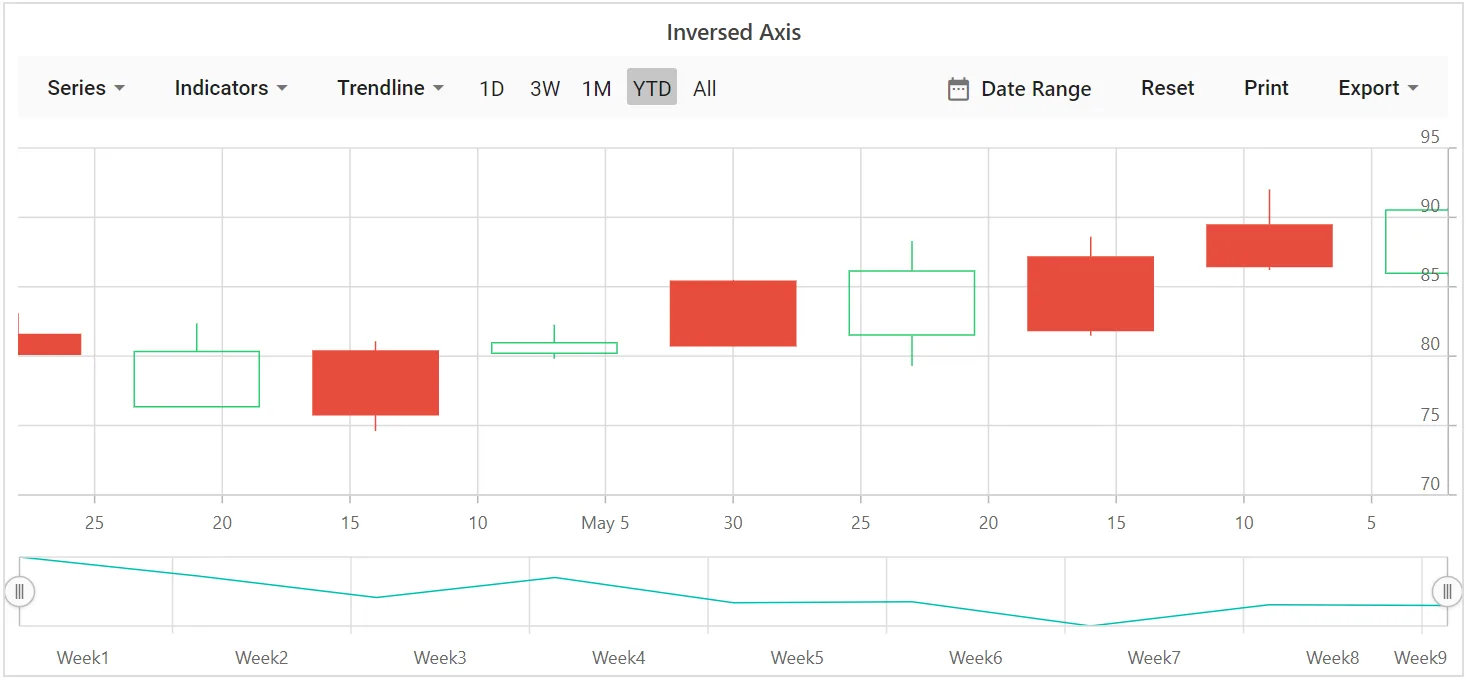
Inversed Axis
When an axis is inversed, the highest value of the axis is placed closer to the origin and the lowest value farther from it. To render an axis in an inversed manner, set IsInversed to true.
@using Syncfusion.Blazor.Charts

<SfStockChart Title="Inversed Axis">
    <StockChartPrimaryXAxis IsInversed="true"></StockChartPrimaryXAxis>

    <StockChartSeriesCollection>
        <StockChartSeries DataSource="@StockDetails" Type="ChartSeriesType.Candle" XName="Date" High="High" Low="Low" Open="Open" Close="Close" Name="Apple"></StockChartSeries>
    </StockChartSeriesCollection>
</SfStockChart>

@code {
    public class ChartData
    {
        public DateTime Date { get; set; }
        public Double Open { get; set; }
        public Double Low { get; set; }
        public Double Close { get; set; }
        public Double High { get; set; }
        public Double Volume { get; set; }
    }

    public List<ChartData> StockDetails = new List<ChartData>
    {
        new ChartData { Date = new DateTime(2012, 04, 02), Open = 85.9757, High = 90.6657, Low = 85.7685, Close = 90.5257, Volume = 660187068 },
        new ChartData { Date = new DateTime(2012, 04, 09), Open = 89.4471, High = 92, Low = 86.2157, Close = 86.4614, Volume = 912634864 },
        new ChartData { Date = new DateTime(2012, 04, 16), Open = 87.1514, High = 88.6071, Low = 81.4885, Close = 81.8543, Volume = 1221746066 },
        new ChartData { Date = new DateTime(2012, 04, 23), Open = 81.5157, High = 88.2857, Low = 79.2857, Close = 86.1428, Volume = 965935749 },
        new ChartData { Date = new DateTime(2012, 04, 30), Open = 85.4, High = 85.4857, Low = 80.7385, Close = 80.75, Volume = 615249365 },
        new ChartData { Date = new DateTime(2012, 05, 07), Open = 80.2143, High = 82.2685, Low = 79.8185, Close = 80.9585, Volume = 541742692 },
        new ChartData { Date = new DateTime(2012, 05, 14), Open = 80.3671, High = 81.0728, Low = 74.5971, Close = 75.7685, Volume = 708126233 },
        new ChartData { Date = new DateTime(2012, 05, 21), Open = 76.3571, High = 82.3571, Low = 76.2928, Close = 80.3271, Volume = 682076215 },
        new ChartData { Date = new DateTime(2012, 05, 28), Open = 81.5571, High = 83.0714, Low = 80.0743, Close = 80.1414, Volume = 480059584 }
    };
}
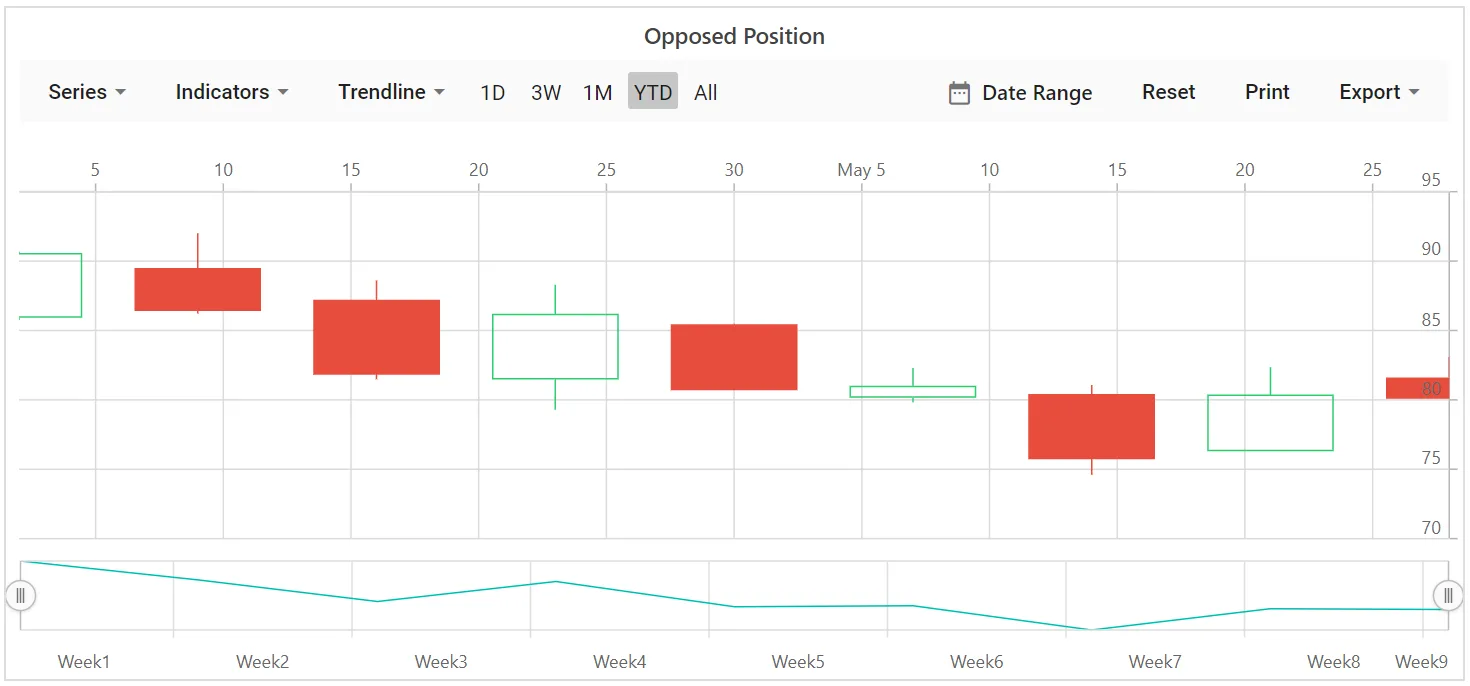
Opposed Position
To place an axis opposite from its original position, set OpposedPosition to true.
@using Syncfusion.Blazor.Charts

<SfStockChart Title="AAPL Stock Price">
    <StockChartPrimaryXAxis OpposedPosition="true"></StockChartPrimaryXAxis>

    <StockChartSeriesCollection>
        <StockChartSeries DataSource="@StockDetails" Type="ChartSeriesType.Line" XName="Date" High="High" Low="Low" Open="Open" Close="Close"></StockChartSeries>
    </StockChartSeriesCollection>
</SfStockChart>

@code {
    public class ChartData
    {
        public DateTime Date { get; set; }
        public Double Open { get; set; }
        public Double Low { get; set; }
        public Double Close { get; set; }
        public Double High { get; set; }
        public Double Volume { get; set; }
    }

    public List<ChartData> StockDetails = new List<ChartData>
    {
        new ChartData { Date = new DateTime(2012, 04, 02), Open = 85.9757, High = 90.6657, Low = 85.7685, Close = 90.5257, Volume = 660187068 },
        new ChartData { Date = new DateTime(2012, 04, 09), Open = 89.4471, High = 92, Low = 86.2157, Close = 86.4614, Volume = 912634864 },
        new ChartData { Date = new DateTime(2012, 04, 16), Open = 87.1514, High = 88.6071, Low = 81.4885, Close = 81.8543, Volume = 1221746066 },
        new ChartData { Date = new DateTime(2012, 04, 23), Open = 81.5157, High = 88.2857, Low = 79.2857, Close = 86.1428, Volume = 965935749 },
        new ChartData { Date = new DateTime(2012, 04, 30), Open = 85.4, High = 85.4857, Low = 80.7385, Close = 80.75, Volume = 615249365 },
        new ChartData { Date = new DateTime(2012, 05, 07), Open = 80.2143, High = 82.2685, Low = 79.8185, Close = 80.9585, Volume = 541742692 },
        new ChartData { Date = new DateTime(2012, 05, 14), Open = 80.3671, High = 81.0728, Low = 74.5971, Close = 75.7685, Volume = 708126233 },
        new ChartData { Date = new DateTime(2012, 05, 21), Open = 76.3571, High = 82.3571, Low = 76.2928, Close = 80.3271, Volume = 682076215 },
        new ChartData { Date = new DateTime(2012, 05, 28), Open = 81.5571, High = 83.0714, Low = 80.0743, Close = 80.1414, Volume = 480059584 }
    };
}