Stock Chart Dimensions in Blazor Stock Chart Component
29 Jun 20267 minutes to read
Size for Container
The stock chart adapts to its container size. Set the container dimensions with inline styles or CSS, as shown below.
@using Syncfusion.Blazor.Charts

<div style="height:450px;width:970px">
    <SfStockChart Title="AAPL Stock Price">
        <StockChartSeriesCollection>
            <StockChartSeries DataSource="@StockDetails" Type="ChartSeriesType.Candle" XName="Date" High="High" Low="Low" Open="Open" Close="Close" Volume="Volume"></StockChartSeries>
        </StockChartSeriesCollection>
    </SfStockChart>
</div>

@code {
    public class ChartData
    {
        public DateTime Date { get; set; }
        public Double Open { get; set; }
        public Double Low { get; set; }
        public Double Close { get; set; }
        public Double High { get; set; }
        public Double Volume { get; set; }
    }

    public List<ChartData> StockDetails = new List<ChartData>
    {
        new ChartData { Date = new DateTime(2012, 04, 02), Open= 85.9757, High = 90.6657,Low = 85.7685, Close = 90.5257,Volume = 660187068},
        new ChartData { Date = new DateTime(2012, 04, 09), Open= 89.4471, High = 92,Low = 86.2157, Close = 86.4614,Volume = 912634864},
        new ChartData { Date = new DateTime(2012, 04, 16), Open= 87.1514, High = 88.6071,Low = 81.4885, Close = 81.8543,Volume = 1221746066},
        new ChartData { Date = new DateTime(2012, 04, 23), Open= 81.5157, High = 88.2857,Low = 79.2857, Close = 86.1428,Volume = 965935749},
        new ChartData { Date = new DateTime(2012, 04, 30), Open= 85.4, High =  85.4857,Low = 80.7385, Close = 80.75,Volume = 615249365},
        new ChartData { Date = new DateTime(2012, 05, 07), Open= 80.2143, High = 82.2685,Low = 79.8185, Close = 80.9585,Volume = 541742692},
        new ChartData { Date = new DateTime(2012, 05, 14), Open= 80.3671, High = 81.0728,Low = 74.5971, Close = 75.7685,Volume = 708126233},
        new ChartData { Date = new DateTime(2012, 05, 21), Open= 76.3571, High = 82.3571,Low = 76.2928, Close = 80.3271,Volume = 682076215},
        new ChartData { Date = new DateTime(2012, 05, 28), Open= 81.5571, High = 83.0714,Low = 80.0743, Close = 80.1414,Volume = 480059584}
   };
}
Size for Stock Chart
Set the stock chart size directly using the Width and Height properties.
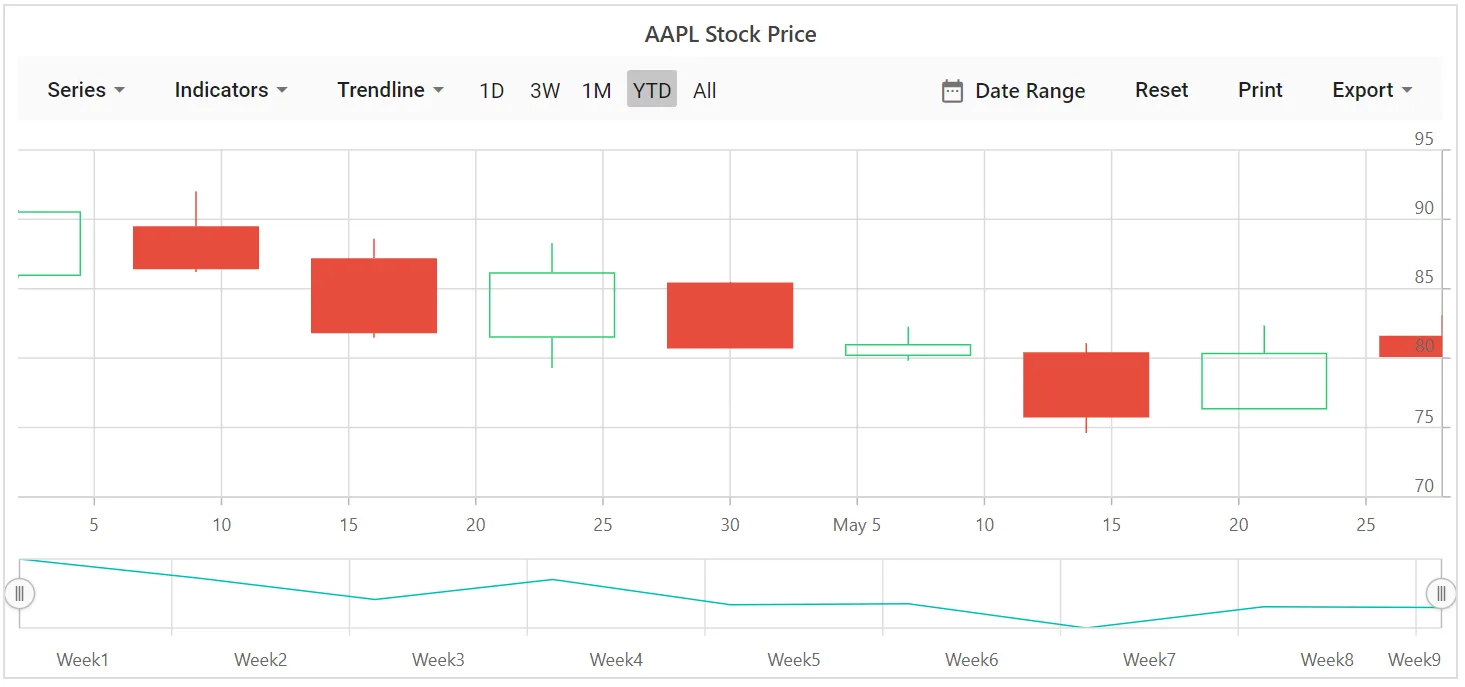
In Pixels
@using Syncfusion.Blazor.Charts

<SfStockChart Title="AAPL Stock Price" Width="970px" Height="350px">
    <StockChartSeriesCollection>
        <StockChartSeries DataSource="@StockDetails" Type="ChartSeriesType.Candle" XName="Date" High="High" Low="Low" Open="Open" Close="Close" Volume="Volume"></StockChartSeries>
    </StockChartSeriesCollection>
</SfStockChart>

@code {
    public class ChartData
    {
        public DateTime Date { get; set; }
        public Double Open { get; set; }
        public Double Low { get; set; }
        public Double Close { get; set; }
        public Double High { get; set; }
        public Double Volume { get; set; }
    }

    public List<ChartData> StockDetails = new List<ChartData>
    {
        new ChartData { Date = new DateTime(2012, 04, 02), Open = 85.9757, High = 90.6657, Low = 85.7685, Close = 90.5257, Volume = 660187068 },
        new ChartData { Date = new DateTime(2012, 04, 09), Open = 89.4471, High = 92, Low = 86.2157, Close = 86.4614, Volume = 912634864 },
        new ChartData { Date = new DateTime(2012, 04, 16), Open = 87.1514, High = 88.6071, Low = 81.4885, Close = 81.8543, Volume = 1221746066 },
        new ChartData { Date = new DateTime(2012, 04, 23), Open = 81.5157, High = 88.2857, Low = 79.2857, Close = 86.1428, Volume = 965935749 },
        new ChartData { Date = new DateTime(2012, 04, 30), Open = 85.4, High = 85.4857, Low = 80.7385, Close = 80.75, Volume = 615249365 },
        new ChartData { Date = new DateTime(2012, 05, 07), Open = 80.2143, High = 82.2685, Low = 79.8185, Close = 80.9585, Volume = 541742692 },
        new ChartData { Date = new DateTime(2012, 05, 14), Open = 80.3671, High = 81.0728, Low = 74.5971, Close = 75.7685, Volume = 708126233 },
        new ChartData { Date = new DateTime(2012, 05, 21), Open = 76.3571, High = 82.3571, Low = 76.2928, Close = 80.3271, Volume = 682076215 },
        new ChartData { Date = new DateTime(2012, 05, 28), Open = 81.5571, High = 83.0714, Low = 80.0743, Close = 80.1414, Volume = 480059584 }
   };
}![]()
In Percentage
When values are specified in percentages, the stock chart sizes relative to its container. For example, a height of ‘50%’ renders at half the container height.
@using Syncfusion.Blazor.Charts

<SfStockChart Title="AAPL Stock Price" Width="100%" Height="90%">
    <StockChartSeriesCollection>
        <StockChartSeries DataSource="@StockDetails" Type="ChartSeriesType.Candle" XName="Date" High="High" Low="Low" Open="Open" Close="Close" Volume="Volume"></StockChartSeries>
    </StockChartSeriesCollection>
</SfStockChart>

@code {
    public class ChartData
    {
        public DateTime Date { get; set; }
        public Double Open { get; set; }
        public Double Low { get; set; }
        public Double Close { get; set; }
        public Double High { get; set; }
        public Double Volume { get; set; }
    }

    public List<ChartData> StockDetails = new List<ChartData>
    {
        new ChartData { Date = new DateTime(2012, 04, 02), Open = 85.9757, High = 90.6657, Low = 85.7685, Close = 90.5257, Volume = 660187068 },
        new ChartData { Date = new DateTime(2012, 04, 09), Open = 89.4471, High = 92, Low = 86.2157, Close = 86.4614, Volume = 912634864 },
        new ChartData { Date = new DateTime(2012, 04, 16), Open = 87.1514, High = 88.6071, Low = 81.4885, Close = 81.8543, Volume = 1221746066 },
        new ChartData { Date = new DateTime(2012, 04, 23), Open = 81.5157, High = 88.2857, Low = 79.2857, Close = 86.1428, Volume = 965935749 },
        new ChartData { Date = new DateTime(2012, 04, 30), Open = 85.4, High = 85.4857, Low = 80.7385, Close = 80.75, Volume = 615249365 },
        new ChartData { Date = new DateTime(2012, 05, 07), Open = 80.2143, High = 82.2685, Low = 79.8185, Close = 80.9585, Volume = 541742692 },
        new ChartData { Date = new DateTime(2012, 05, 14), Open = 80.3671, High = 81.0728, Low = 74.5971, Close = 75.7685, Volume = 708126233 },
        new ChartData { Date = new DateTime(2012, 05, 21), Open = 76.3571, High = 82.3571, Low = 76.2928, Close = 80.3271, Volume = 682076215 },
        new ChartData { Date = new DateTime(2012, 05, 28), Open = 81.5571, High = 83.0714, Low = 80.0743, Close = 80.1414, Volume = 480059584 }
   };
}
NOTE
If no size is specified, a default height of 450px is used and the width matches the window size.