How can I help you?
Legend in Blazor Stock Chart Component
29 Jun 202624 minutes to read
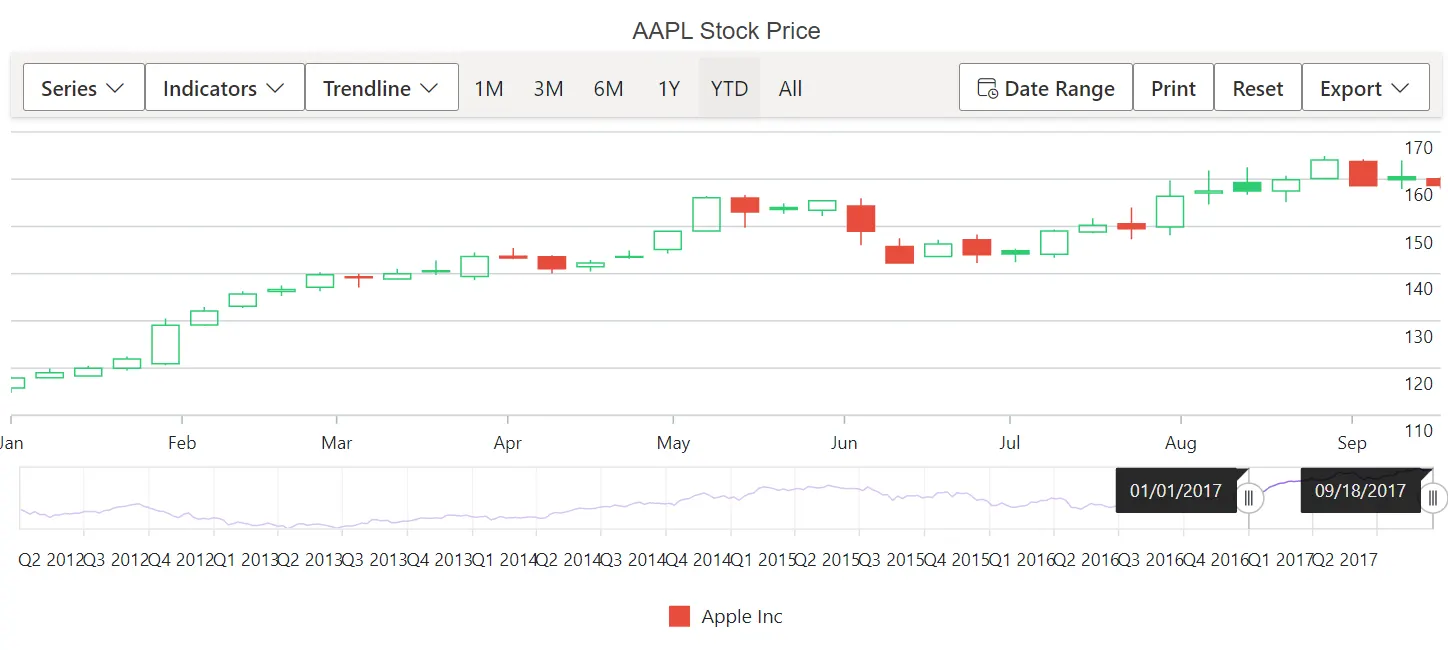
The legend describes the series rendered in the Stock Chart. Enable the legend by setting the Visible option in StockChartLegendSettings.
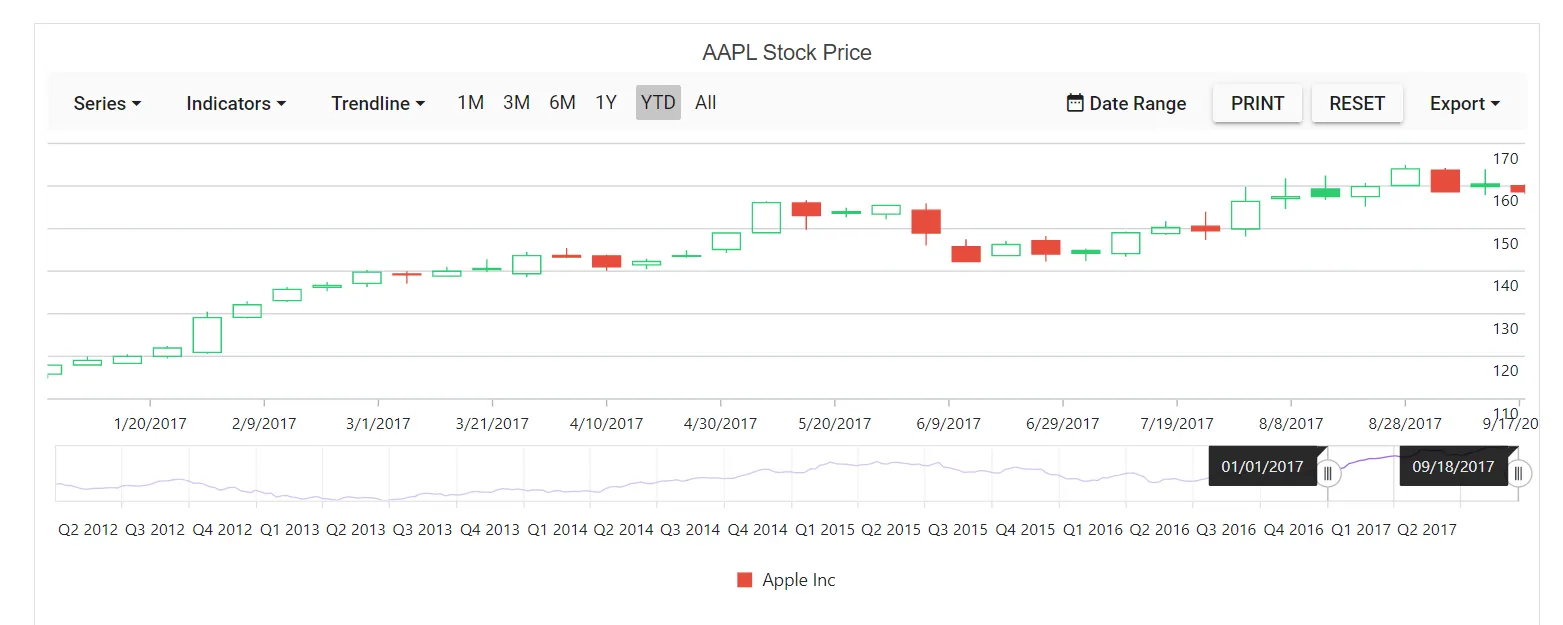
Enable Legend
To display the legend, set the Visible property in StockChartLegendSettings to true.
@using Syncfusion.Blazor.Charts

<SfStockChart Title="AAPL Stock Price">
    <StockChartLegendSettings Visible="true"></StockChartLegendSettings>
    <StockChartSeriesCollection>
        <StockChartSeries DataSource="@StockDetails" XName="Date" High="High" Low="Low" Open="Open" Close="Close" Name="Apple  Inc" Type="ChartSeriesType.Candle"></StockChartSeries>
    </StockChartSeriesCollection>
</SfStockChart>

@code {
    public class ChartData
    {
        public DateTime Date { get; set; }
        public Double Open { get; set; }
        public Double Low { get; set; }
        public Double Close { get; set; }
        public Double High { get; set; }
        public Double Volume { get; set; }
    }

    public List<ChartData> StockDetails = new List<ChartData>
    {
        new ChartData { Date = new DateTime(2012, 04, 02), Open = 85.9757, High = 90.6657, Low = 85.7685, Close = 90.5257, Volume = 660187068 },
        new ChartData { Date = new DateTime(2012, 04, 09), Open = 89.4471, High = 92, Low = 86.2157, Close = 86.4614, Volume = 912634864 },
        new ChartData { Date = new DateTime(2012, 04, 16), Open = 87.1514, High = 88.6071, Low = 81.4885, Close = 81.8543, Volume = 1221746066 },
        new ChartData { Date = new DateTime(2012, 04, 23), Open = 81.5157, High = 88.2857, Low = 79.2857, Close = 86.1428, Volume = 965935749 },
        new ChartData { Date = new DateTime(2012, 04, 30), Open = 85.4, High = 85.4857, Low = 80.7385, Close = 80.75, Volume = 615249365 }
   };
}
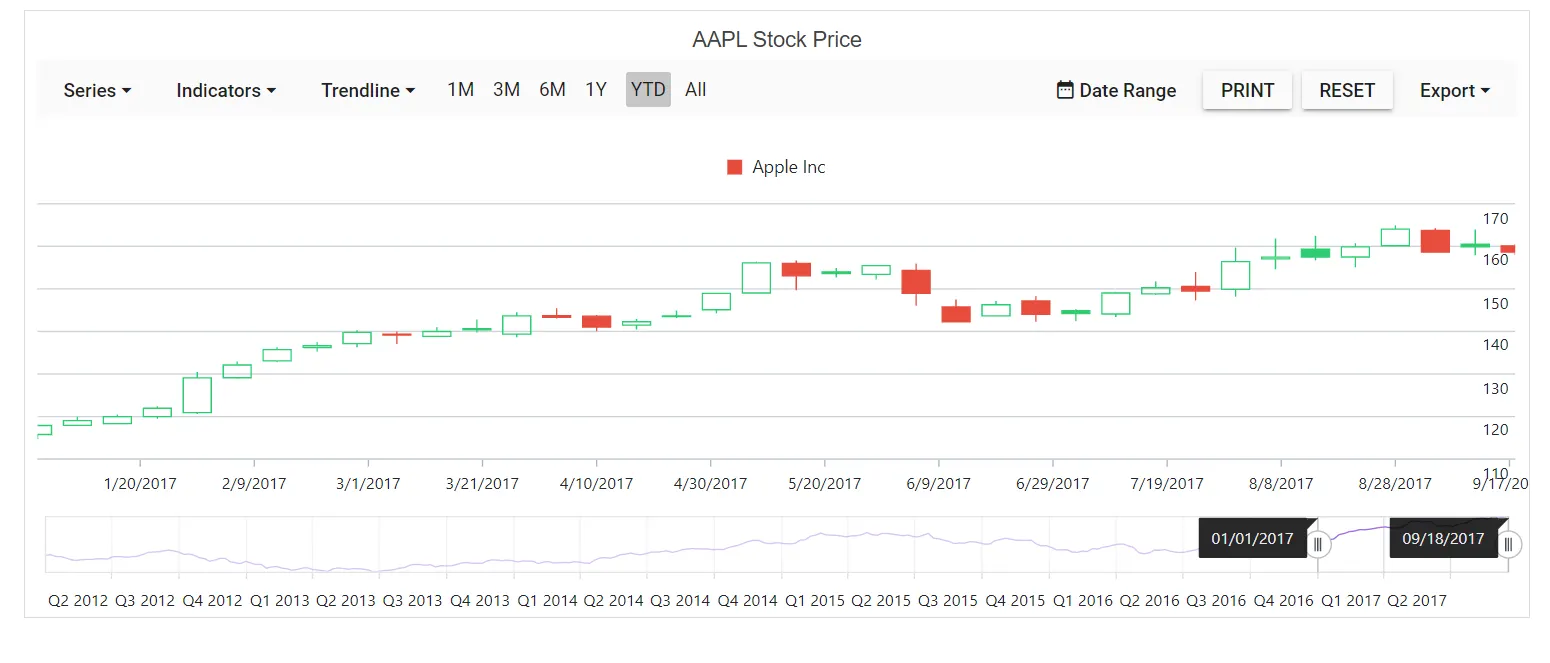
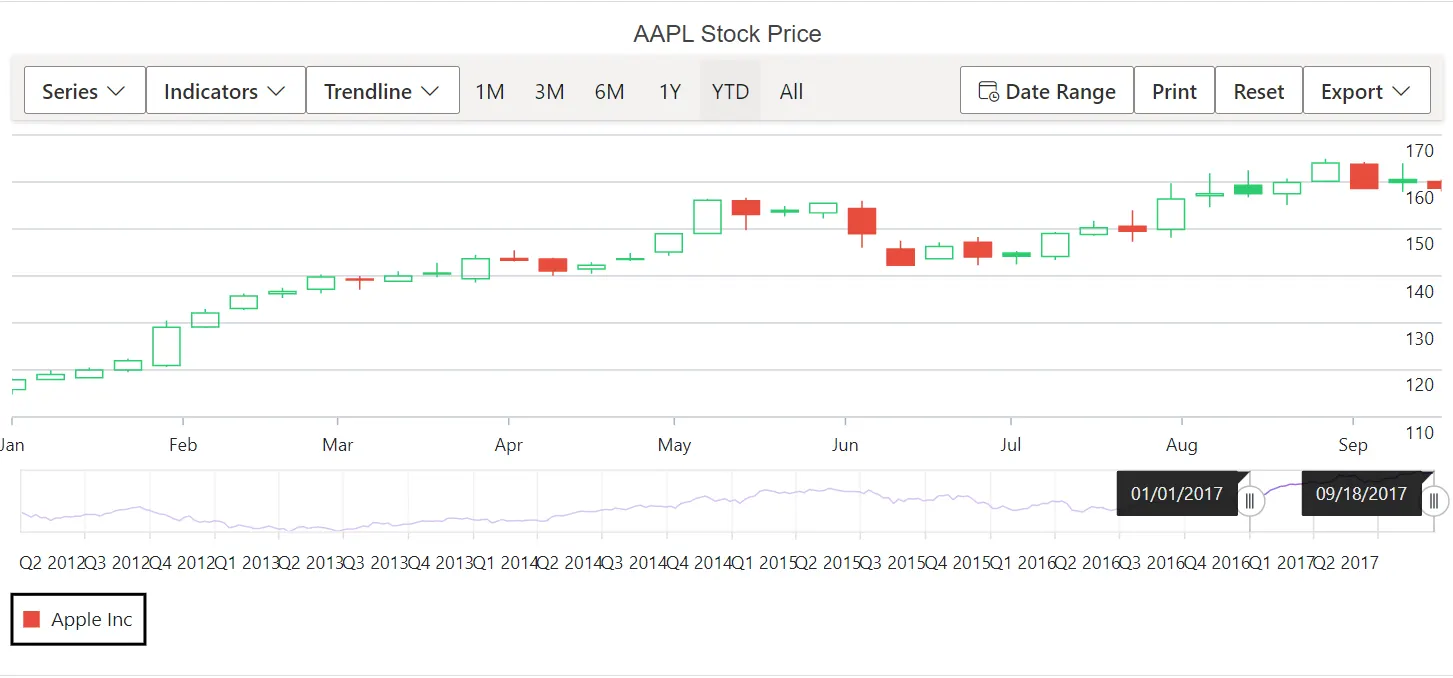
Legend Position
Use the Position property to place the legend at the Left, Right, Top, Bottom, or Custom position. By default, the legend appears at the Bottom of the Stock Chart.
@using Syncfusion.Blazor.Charts

<SfStockChart Title="AAPL Stock Price">
    <StockChartLegendSettings Visible="true" Position="LegendPosition.Top"></StockChartLegendSettings>
    <StockChartSeriesCollection>
        <StockChartSeries DataSource="@StockDetails" XName="Date" High="High" Low="Low" Open="Open" Close="Close" Name="Apple Inc" Type="ChartSeriesType.Candle"></StockChartSeries>
    </StockChartSeriesCollection>
</SfStockChart>

@code {
    public class ChartData
    {
        public DateTime Date { get; set; }
        public Double Open { get; set; }
        public Double Low { get; set; }
        public Double Close { get; set; }
        public Double High { get; set; }
        public Double Volume { get; set; }
    }

    public List<ChartData> StockDetails = new List<ChartData>
    {
        new ChartData { Date = new DateTime(2012, 04, 02), Open = 85.9757, High = 90.6657, Low = 85.7685, Close = 90.5257, Volume = 660187068 },
        new ChartData { Date = new DateTime(2012, 04, 09), Open = 89.4471, High = 92, Low = 86.2157, Close = 86.4614, Volume = 912634864 },
        new ChartData { Date = new DateTime(2012, 04, 16), Open = 87.1514, High = 88.6071, Low = 81.4885, Close = 81.8543, Volume = 1221746066 },
        new ChartData { Date = new DateTime(2012, 04, 23), Open = 81.5157, High = 88.2857, Low = 79.2857, Close = 86.1428, Volume = 965935749 },
        new ChartData { Date = new DateTime(2012, 04, 30), Open = 85.4, High = 85.4857, Low = 80.7385, Close = 80.75, Volume = 615249365 }
   };
}
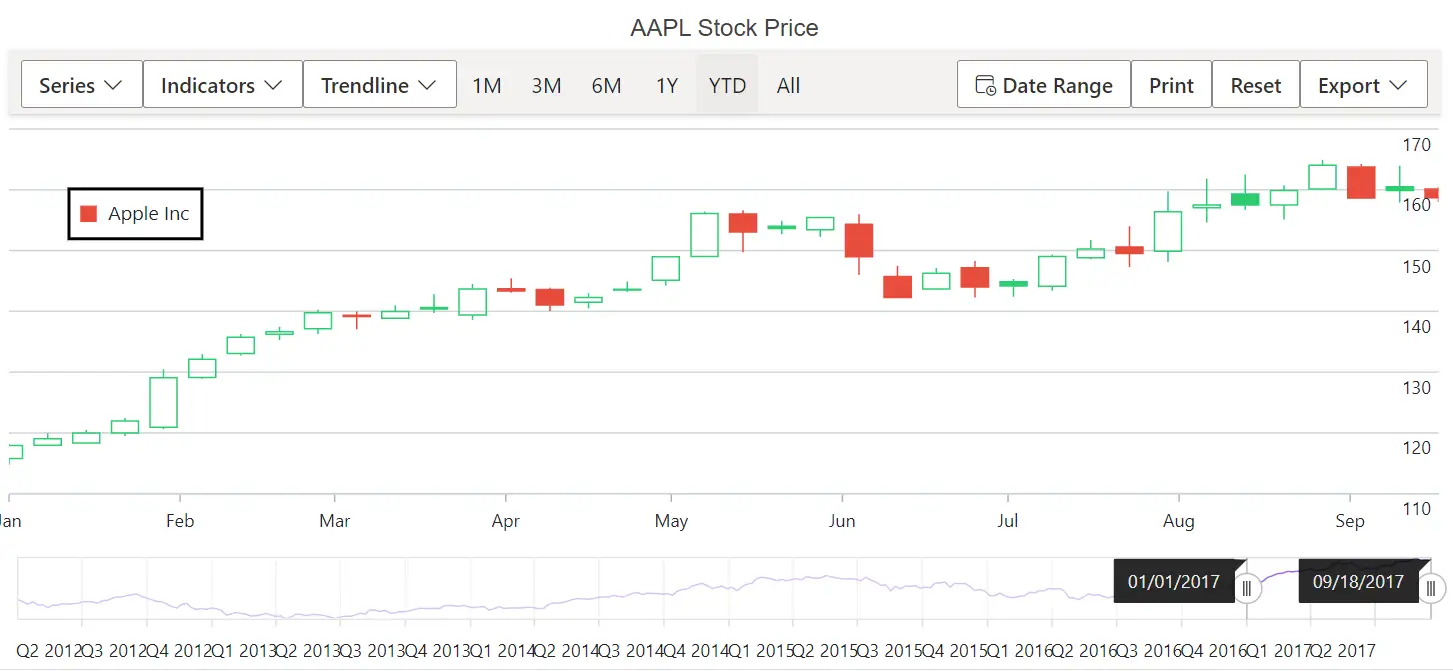
The Custom position allows placing the legend anywhere within the Stock Chart using x and y coordinates.
@using Syncfusion.Blazor.Charts

<SfStockChart Title="AAPL Stock Price">
    <StockChartLegendSettings Visible="true" Position="LegendPosition.Custom">
        <StockChartLocation X="50" Y="50"></StockChartLocation>
        <StockChartLegendBorder Color="Black" Width="2"></StockChartLegendBorder>
    </StockChartLegendSettings>
    <StockChartSeriesCollection>
        <StockChartSeries DataSource="@StockDetails" XName="Date" High="High" Low="Low" Open="Open" Close="Close" Name="Apple Inc" Type="ChartSeriesType.Candle"></StockChartSeries>
    </StockChartSeriesCollection>
</SfStockChart>

@code {
    public class ChartData
    {
        public DateTime Date { get; set; }
        public Double Open { get; set; }
        public Double Low { get; set; }
        public Double Close { get; set; }
        public Double High { get; set; }
        public Double Volume { get; set; }
    }

    public List<ChartData> StockDetails = new List<ChartData>
    {
        new ChartData { Date = new DateTime(2012, 04, 02), Open = 85.9757, High = 90.6657, Low = 85.7685, Close = 90.5257, Volume = 660187068 },
        new ChartData { Date = new DateTime(2012, 04, 09), Open = 89.4471, High = 92, Low = 86.2157, Close = 86.4614, Volume = 912634864 },
        new ChartData { Date = new DateTime(2012, 04, 16), Open = 87.1514, High = 88.6071, Low = 81.4885, Close = 81.8543, Volume = 1221746066 },
        new ChartData { Date = new DateTime(2012, 04, 23), Open = 81.5157, High = 88.2857, Low = 79.2857, Close = 86.1428, Volume = 965935749 },
        new ChartData { Date = new DateTime(2012, 04, 30), Open = 85.4, High = 85.4857, Low = 80.7385, Close = 80.75, Volume = 615249365 }
   };
}
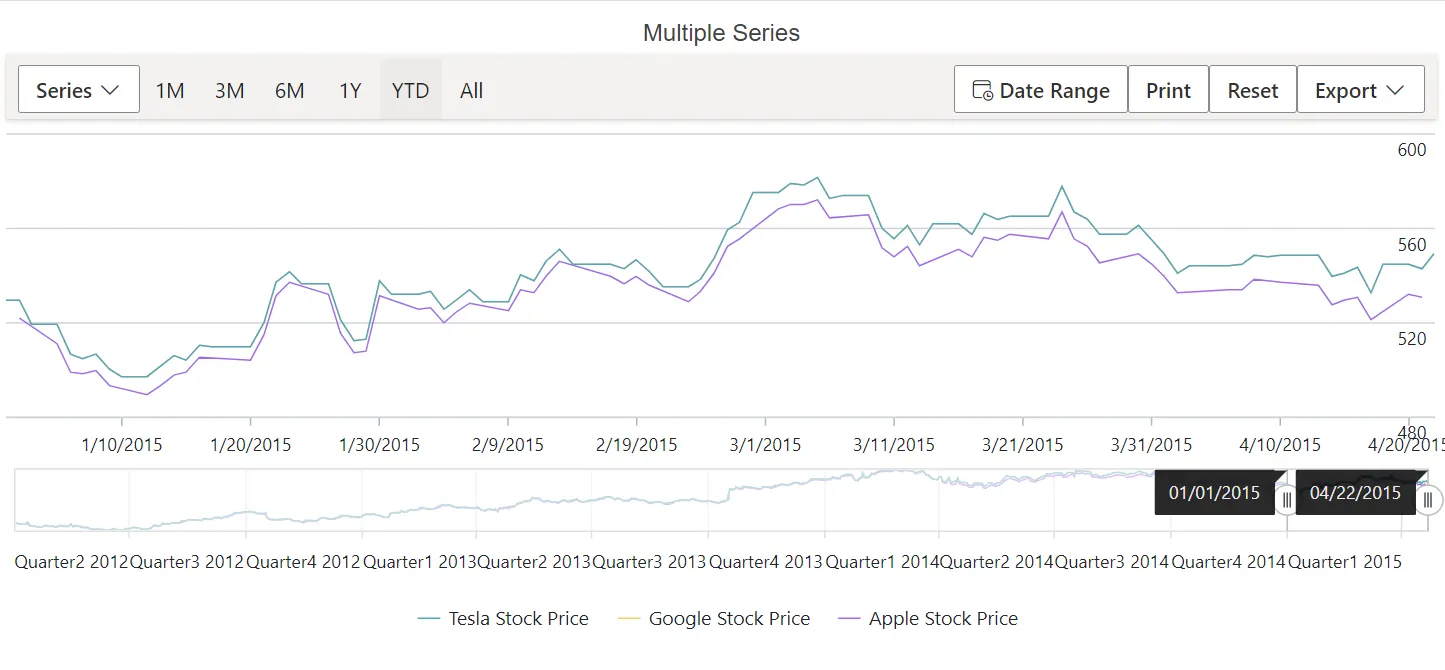
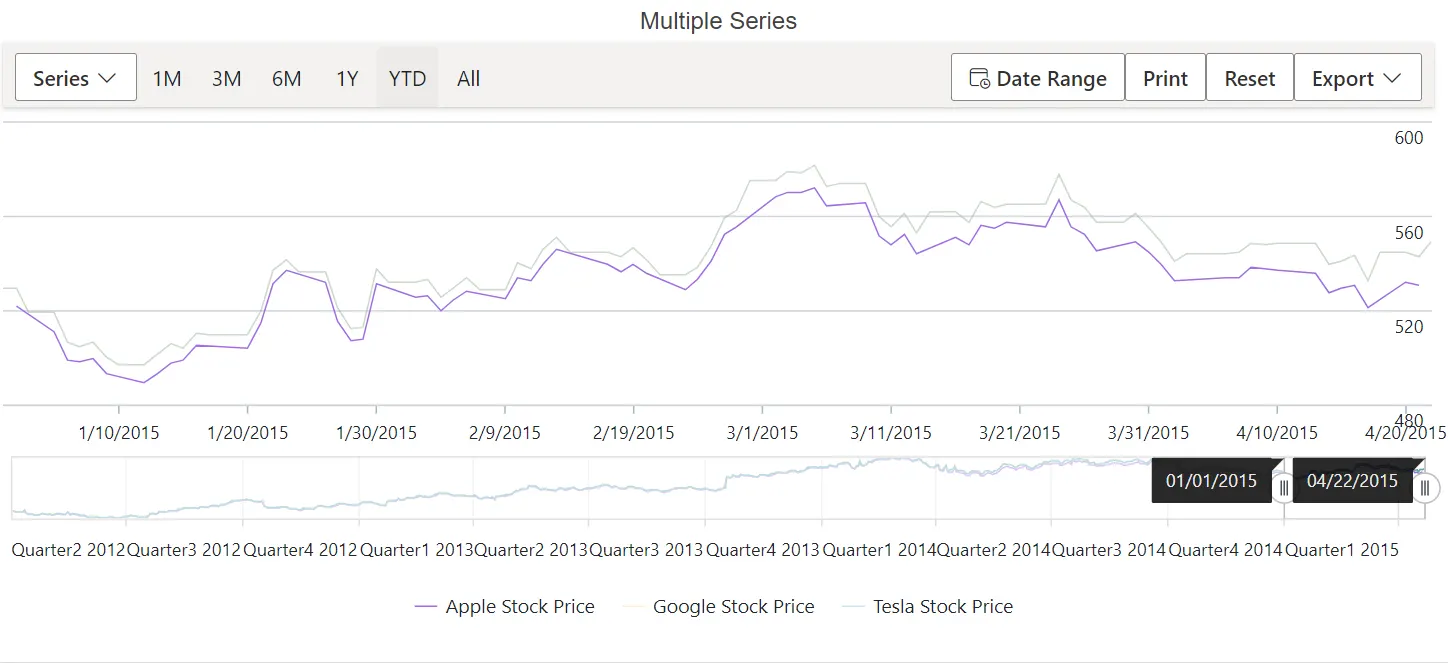
Reverse Legend
Reverse the order of legend items using the Reversed property. By default, the legend entry for the first series appears first.
@using Syncfusion.Blazor.Charts

<SfStockChart Title="AAPL Stock Price">
    <StockChartLegendSettings Visible="true" Reversed="true">
    </StockChartLegendSettings>
    <StockChartSeriesCollection>

        <StockChartSeries DataSource="@StockDetails" Type="ChartSeriesType.Line" XName="Date" High="High" Low="Low" Open="Open" Close="Close" Name="Apple Stock Price"></StockChartSeries>

        <StockChartSeries DataSource="@StockDetails" Type="ChartSeriesType.Line" XName="Date" High="High" Low="Low" Open="Open" Close="Close" Name="Google Stock Price"></StockChartSeries>

        <StockChartSeries DataSource="@StockDetails" Type="ChartSeriesType.Spline"XName="Date" High="High" Low="Low" Open="Open" Close="Close" Name="Tesla Stock Price"></StockChartSeries>

    </StockChartSeriesCollection>
</SfStockChart>

@code {
    public class ChartData
    {
        public DateTime Date { get; set; }
        public Double Open { get; set; }
        public Double Low { get; set; }
        public Double Close { get; set; }
        public Double High { get; set; }
        public Double Volume { get; set; }
    }

    public List<ChartData> StockDetails = new List<ChartData>
    {
        new ChartData { Date = new DateTime(2012, 04, 02), Open = 85.9757, High = 90.6657, Low = 85.7685, Close = 90.5257, Volume = 660187068 },
        new ChartData { Date = new DateTime(2012, 04, 09), Open = 89.4471, High = 92, Low = 86.2157, Close = 86.4614, Volume = 912634864 },
        new ChartData { Date = new DateTime(2012, 04, 16), Open = 87.1514, High = 88.6071, Low = 81.4885, Close = 81.8543, Volume = 1221746066 },
        new ChartData { Date = new DateTime(2012, 04, 23), Open = 81.5157, High = 88.2857, Low = 79.2857, Close = 86.1428, Volume = 965935749 },
        new ChartData { Date = new DateTime(2012, 04, 30), Open = 85.4, High = 85.4857, Low = 80.7385, Close = 80.75, Volume = 615249365 }
   };
}
Legend Alignment
Use the Alignment property to align the legend to Center, Far, or Near.
@using Syncfusion.Blazor.Charts

<SfStockChart Title="AAPL Stock Price">
    <StockChartLegendSettings Visible="true" Alignment="Alignment.Near">
    <StockChartLegendBorder Color="Black" Width="2"></StockChartLegendBorder>
    </StockChartLegendSettings>
    <StockChartSeriesCollection>
        <StockChartSeries DataSource="@StockDetails"  XName="Date" High="High" Low="Low" Open="Open" Close="Close" Name="Apple Inc" Type="ChartSeriesType.Candle"></StockChartSeries>
    </StockChartSeriesCollection>
</SfStockChart>

@code {
    public class ChartData
    {
        public DateTime Date { get; set; }
        public Double Open { get; set; }
        public Double Low { get; set; }
        public Double Close { get; set; }
        public Double High { get; set; }
        public Double Volume { get; set; }
    }

    public List<ChartData> StockDetails = new List<ChartData>
    {
        new ChartData { Date = new DateTime(2012, 04, 02), Open = 85.9757, High = 90.6657, Low = 85.7685, Close = 90.5257, Volume = 660187068 },
        new ChartData { Date = new DateTime(2012, 04, 09), Open = 89.4471, High = 92, Low = 86.2157, Close = 86.4614, Volume = 912634864 },
        new ChartData { Date = new DateTime(2012, 04, 16), Open = 87.1514, High = 88.6071, Low = 81.4885, Close = 81.8543, Volume = 1221746066 },
        new ChartData { Date = new DateTime(2012, 04, 23), Open = 81.5157, High = 88.2857, Low = 79.2857, Close = 86.1428, Volume = 965935749 },
        new ChartData { Date = new DateTime(2012, 04, 30), Open = 85.4, High = 85.4857, Low = 80.7385, Close = 80.75, Volume = 615249365 }
   };
}
Legend Customization
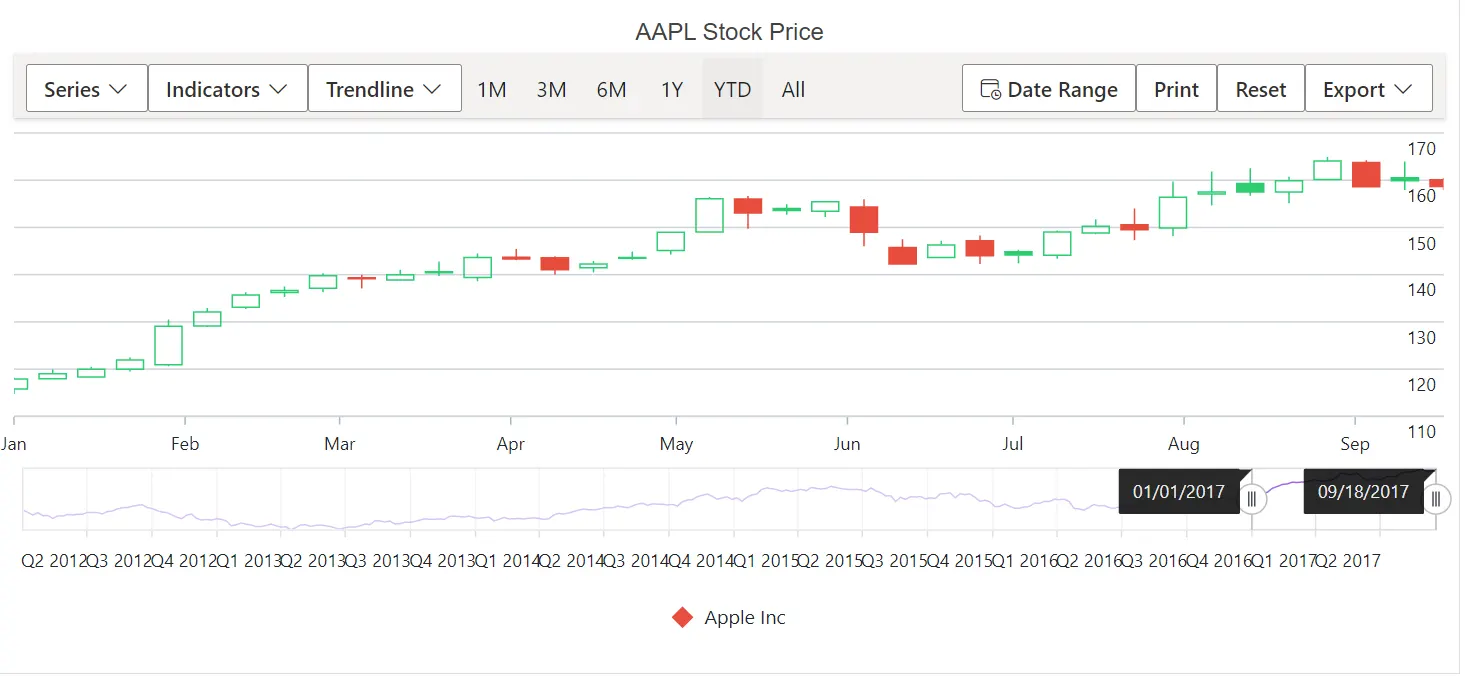
Legend Shape
The LegendShape property in the Series changes the legend icon shape. The default icon shape is based on SeriesType.
@using Syncfusion.Blazor.Charts

<SfStockChart Title="AAPL Stock Price">
    <StockChartLegendSettings Visible="true" ShapeHeight="13" ShapeWidth="13">
    </StockChartLegendSettings>
    <StockChartSeriesCollection>
        <StockChartSeries DataSource="@StockDetails" XName="Date" High="High" Low="Low" Open="Open" Close="Close" Name="Apple Inc" Type="ChartSeriesType.Candle"  LegendShape="LegendShape.Diamond"></StockChartSeries>
    </StockChartSeriesCollection>
</SfStockChart>

@code {
    public class ChartData
    {
        public DateTime Date { get; set; }
        public Double Open { get; set; }
        public Double Low { get; set; }
        public Double Close { get; set; }
        public Double High { get; set; }
        public Double Volume { get; set; }
    }

    public List<ChartData> StockDetails = new List<ChartData>
    {
        new ChartData { Date = new DateTime(2012, 04, 02), Open = 85.9757, High = 90.6657, Low = 85.7685, Close = 90.5257, Volume = 660187068 },
        new ChartData { Date = new DateTime(2012, 04, 09), Open = 89.4471, High = 92, Low = 86.2157, Close = 86.4614, Volume = 912634864 },
        new ChartData { Date = new DateTime(2012, 04, 16), Open = 87.1514, High = 88.6071, Low = 81.4885, Close = 81.8543, Volume = 1221746066 },
        new ChartData { Date = new DateTime(2012, 04, 23), Open = 81.5157, High = 88.2857, Low = 79.2857, Close = 86.1428, Volume = 965935749 },
        new ChartData { Date = new DateTime(2012, 04, 30), Open = 85.4, High = 85.4857, Low = 80.7385, Close = 80.75, Volume = 615249365 }
   };
}
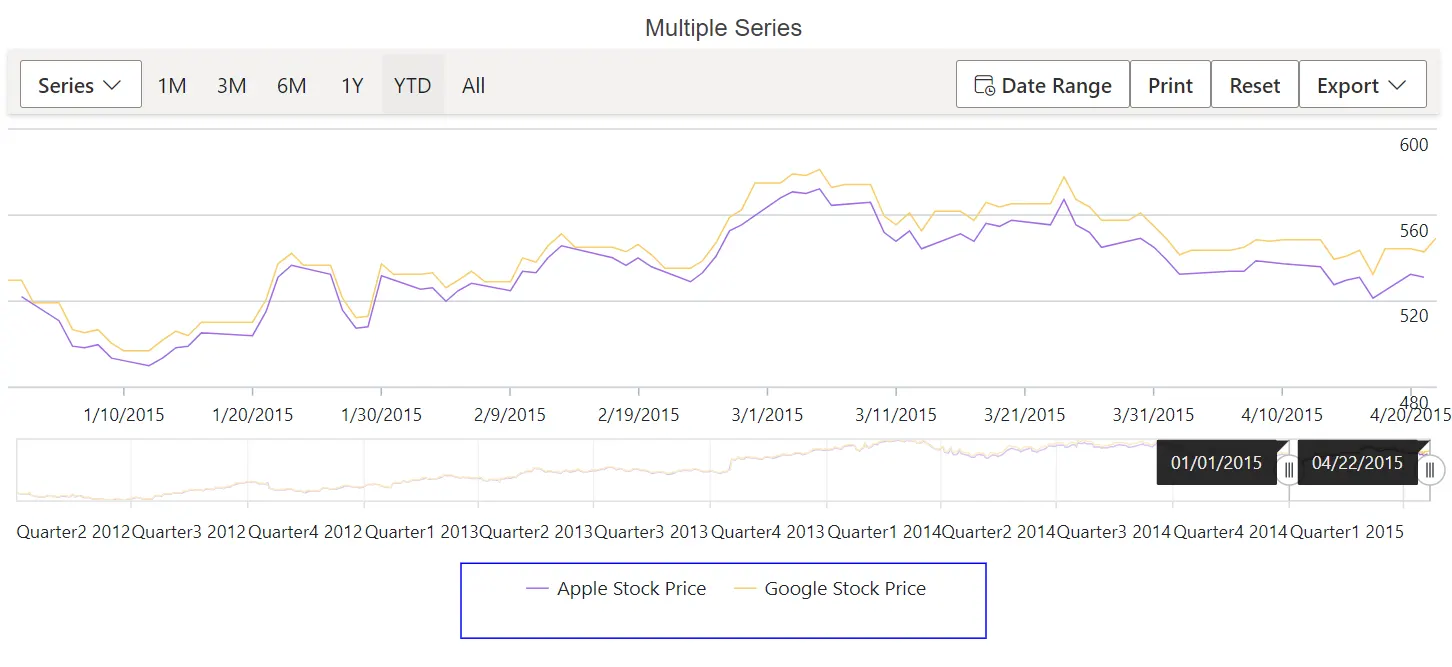
Legend Size
When placed at the top or bottom, the legend occupies approximately 20%–25% of the chart height; when positioned at the left or right, it occupies approximately 20%–25% of the chart width. Use the Width and Height properties to adjust the legend size.
@using Syncfusion.Blazor.Charts

<SfStockChart Title="AAPL Stock Price">
    <StockChartLegendSettings Visible="true" Height="50" Width="300">
        <StockChartLegendBorder Color="blue" Width="1"></StockChartLegendBorder>
    </StockChartLegendSettings>
    <StockChartSeriesCollection>
        <StockChartSeries DataSource="@StockDetails" Type="ChartSeriesType.Line" XName="Date" High="High" Low="Low" Open="Open" Close="Close" Name="Apple Stock Price"></StockChartSeries>
        <StockChartSeries DataSource="@StockDetails" Type="ChartSeriesType.Line" XName="Date" High="High" Low="Low" Open="Open" Close="Close" Name="Google Stock Price"></StockChartSeries>
    </StockChartSeriesCollection>
</SfStockChart>

@code {
    public class ChartData
    {
        public DateTime Date { get; set; }
        public Double Open { get; set; }
        public Double Low { get; set; }
        public Double Close { get; set; }
        public Double High { get; set; }
        public Double Volume { get; set; }
    }

    public List<ChartData> StockDetails = new List<ChartData>
    {
        new ChartData { Date = new DateTime(2012, 04, 02), Open = 85.9757, High = 90.6657, Low = 85.7685, Close = 90.5257, Volume = 660187068 },
        new ChartData { Date = new DateTime(2012, 04, 09), Open = 89.4471, High = 92, Low = 86.2157, Close = 86.4614, Volume = 912634864 },
        new ChartData { Date = new DateTime(2012, 04, 16), Open = 87.1514, High = 88.6071, Low = 81.4885, Close = 81.8543, Volume = 1221746066 },
        new ChartData { Date = new DateTime(2012, 04, 23), Open = 81.5157, High = 88.2857, Low = 79.2857, Close = 86.1428, Volume = 965935749 },
        new ChartData { Date = new DateTime(2012, 04, 30), Open = 85.4, High = 85.4857, Low = 80.7385, Close = 80.75, Volume = 615249365 }
   };
}
Legend Shape Size
Use the ShapeHeight and ShapeWidth properties to control the legend icon dimensions.
@using Syncfusion.Blazor.Charts

<SfStockChart Title="AAPL Stock Price">
    <StockChartLegendSettings Visible="true" Height="50" Width="300" ShapeHeight="15" ShapeWidth="15">
    </StockChartLegendSettings>
    <StockChartSeriesCollection>
        <StockChartSeries DataSource="@StockDetails" XName="Date" High="High" Low="Low" Open="Open" Close="Close" Name="Apple Inc" Type="ChartSeriesType.Candle"></StockChartSeries>
    </StockChartSeriesCollection>
</SfStockChart>

@code {
    public class ChartData
    {
        public DateTime Date { get; set; }
        public Double Open { get; set; }
        public Double Low { get; set; }
        public Double Close { get; set; }
        public Double High { get; set; }
        public Double Volume { get; set; }
    }

    public List<ChartData> StockDetails = new List<ChartData>
    {
        new ChartData { Date = new DateTime(2012, 04, 02), Open = 85.9757, High = 90.6657, Low = 85.7685, Close = 90.5257, Volume = 660187068 },
        new ChartData { Date = new DateTime(2012, 04, 09), Open = 89.4471, High = 92, Low = 86.2157, Close = 86.4614, Volume = 912634864 },
        new ChartData { Date = new DateTime(2012, 04, 16), Open = 87.1514, High = 88.6071, Low = 81.4885, Close = 81.8543, Volume = 1221746066 },
        new ChartData { Date = new DateTime(2012, 04, 23), Open = 81.5157, High = 88.2857, Low = 79.2857, Close = 86.1428, Volume = 965935749 },
        new ChartData { Date = new DateTime(2012, 04, 30), Open = 85.4, High = 85.4857, Low = 80.7385, Close = 80.75, Volume = 615249365 }
   };
}
Legend Item Padding
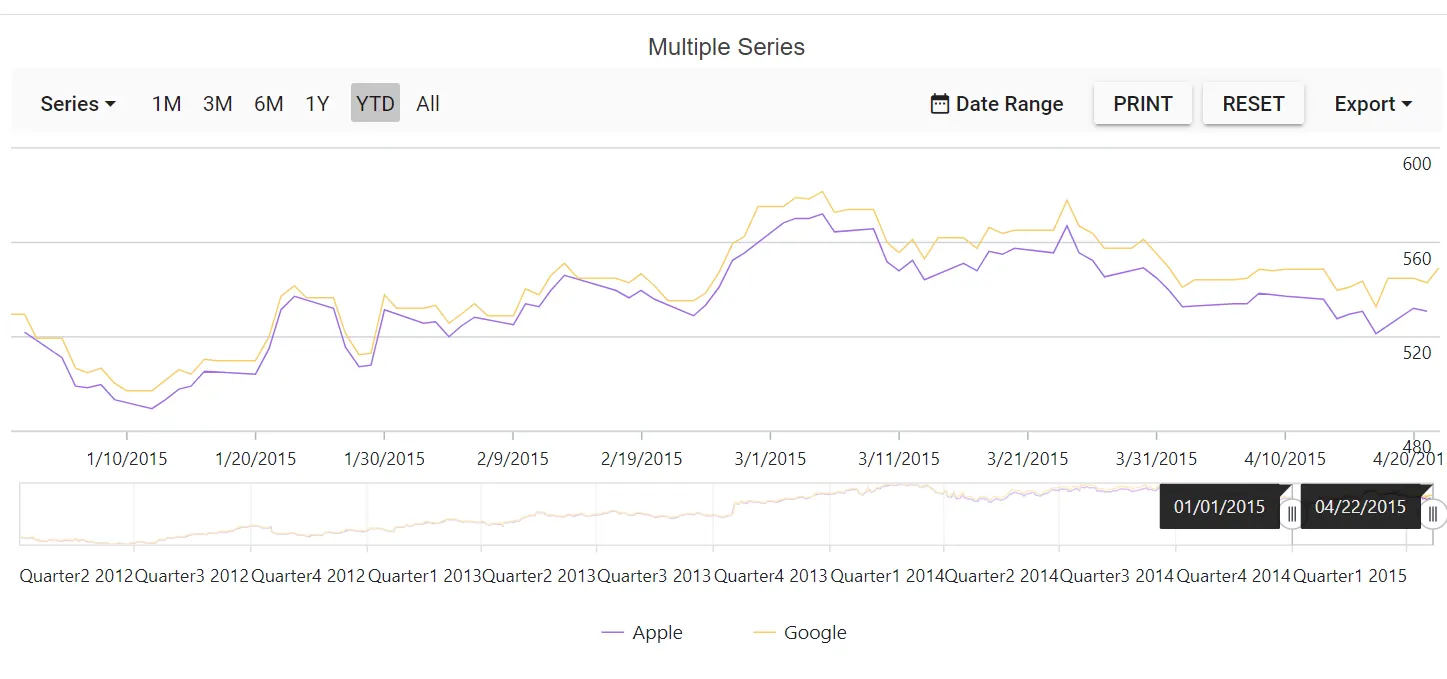
Use the ItemPadding property to adjust spacing between legend items.
@using Syncfusion.Blazor.Charts

<SfStockChart Title="AAPL Stock Price">
    <StockChartLegendSettings Visible="true" ItemPadding="30">
    </StockChartLegendSettings>
    <StockChartSeriesCollection>
        <StockChartSeries DataSource="@StockDetails" Type="ChartSeriesType.Line" XName="Date" High="High" Low="Low" Open="Open" Close="Close" Name="Apple"></StockChartSeries>
        <StockChartSeries DataSource="@StockDetails" Type="ChartSeriesType.Line" XName="Date" High="High" Low="Low" Open="Open" Close="Close" Name="Google"></StockChartSeries>
    </StockChartSeriesCollection>
</SfStockChart>

@code {
    public class ChartData
    {
        public DateTime Date { get; set; }
        public Double Open { get; set; }
        public Double Low { get; set; }
        public Double Close { get; set; }
        public Double High { get; set; }
        public Double Volume { get; set; }
    }

    public List<ChartData> StockDetails = new List<ChartData>
    {
        new ChartData { Date = new DateTime(2012, 04, 02), Open = 85.9757, High = 90.6657, Low = 85.7685, Close = 90.5257, Volume = 660187068 },
        new ChartData { Date = new DateTime(2012, 04, 09), Open = 89.4471, High = 92, Low = 86.2157, Close = 86.4614, Volume = 912634864 },
        new ChartData { Date = new DateTime(2012, 04, 16), Open = 87.1514, High = 88.6071, Low = 81.4885, Close = 81.8543, Volume = 1221746066 },
        new ChartData { Date = new DateTime(2012, 04, 23), Open = 81.5157, High = 88.2857, Low = 79.2857, Close = 86.1428, Volume = 965935749 },
        new ChartData { Date = new DateTime(2012, 04, 30), Open = 85.4, High = 85.4857, Low = 80.7385, Close = 80.75, Volume = 615249365 }
   };
}
Legend Paging
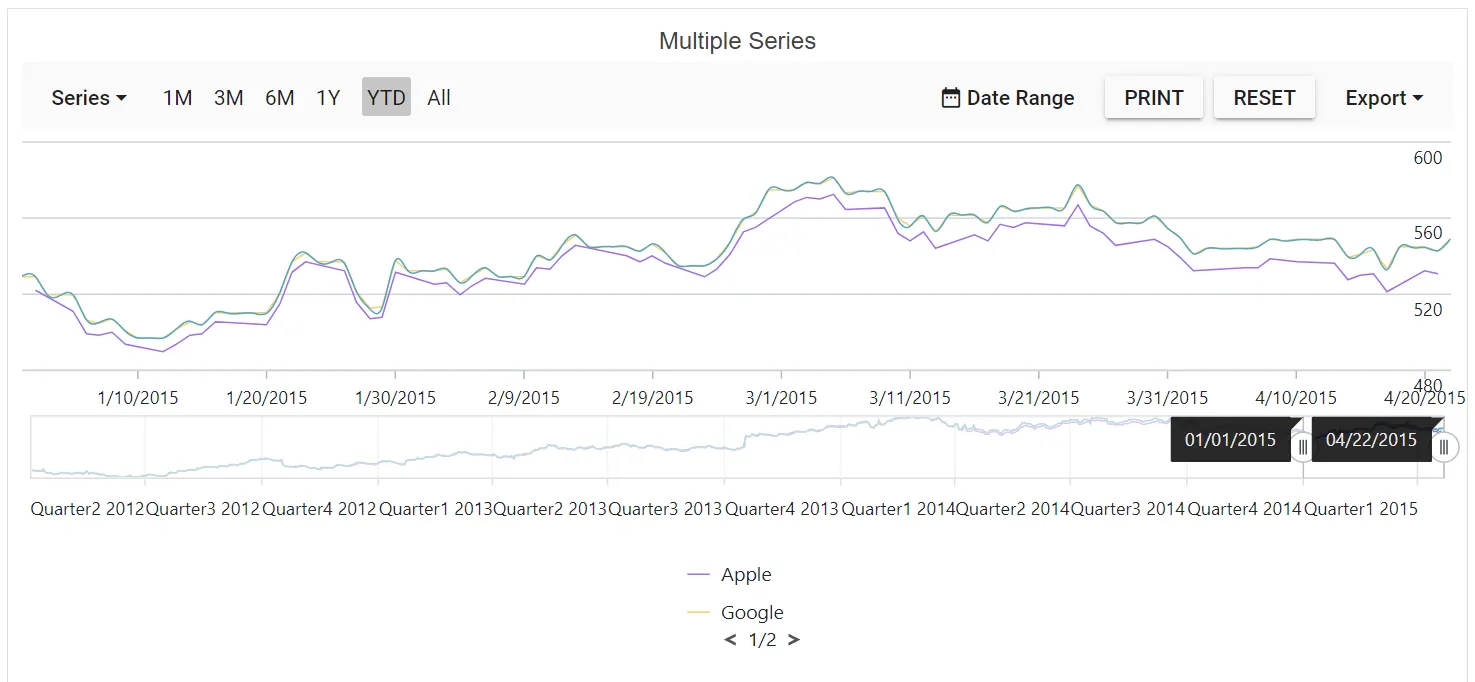
When legend items exceed the available bounds, paging is enabled automatically. End users can navigate between pages using the navigation buttons.
@using Syncfusion.Blazor.Charts

<SfStockChart Title="AAPL Stock Price">
    <StockChartLegendSettings Visible="true" Width="100" Height="70" Padding="10" ShapePadding="10">
    </StockChartLegendSettings>
    <StockChartSeriesCollection>
        <StockChartSeries DataSource="@StockDetails" Type="ChartSeriesType.Line" XName="Date" High="High" Low="Low" Open="Open" Close="Close" Name="Apple"></StockChartSeries>
        <StockChartSeries DataSource="@StockDetails" Type="ChartSeriesType.Line" XName="Date" High="High" Low="Low" Open="Open" Close="Close" Name="Google"></StockChartSeries>
        <StockChartSeries DataSource="@StockDetails" Type="ChartSeriesType.Spline" XName="Date" High="High" Low="Low" Open="Open" Close="Close" Name="Tesla"></StockChartSeries>
    </StockChartSeriesCollection>
</SfStockChart>

@code {
    public class ChartData
    {
        public DateTime Date { get; set; }
        public Double Open { get; set; }
        public Double Low { get; set; }
        public Double Close { get; set; }
        public Double High { get; set; }
        public Double Volume { get; set; }
    }

    public List<ChartData> StockDetails = new List<ChartData>
    {
        new ChartData { Date = new DateTime(2012, 04, 02), Open = 85.9757, High = 90.6657, Low = 85.7685, Close = 90.5257, Volume = 660187068 },
        new ChartData { Date = new DateTime(2012, 04, 09), Open = 89.4471, High = 92, Low = 86.2157, Close = 86.4614, Volume = 912634864 },
        new ChartData { Date = new DateTime(2012, 04, 16), Open = 87.1514, High = 88.6071, Low = 81.4885, Close = 81.8543, Volume = 1221746066 },
        new ChartData { Date = new DateTime(2012, 04, 23), Open = 81.5157, High = 88.2857, Low = 79.2857, Close = 86.1428, Volume = 965935749 },
        new ChartData { Date = new DateTime(2012, 04, 30), Open = 85.4, High = 85.4857, Low = 80.7385, Close = 80.75, Volume = 615249365 }
   };
}
Legend Text Wrap
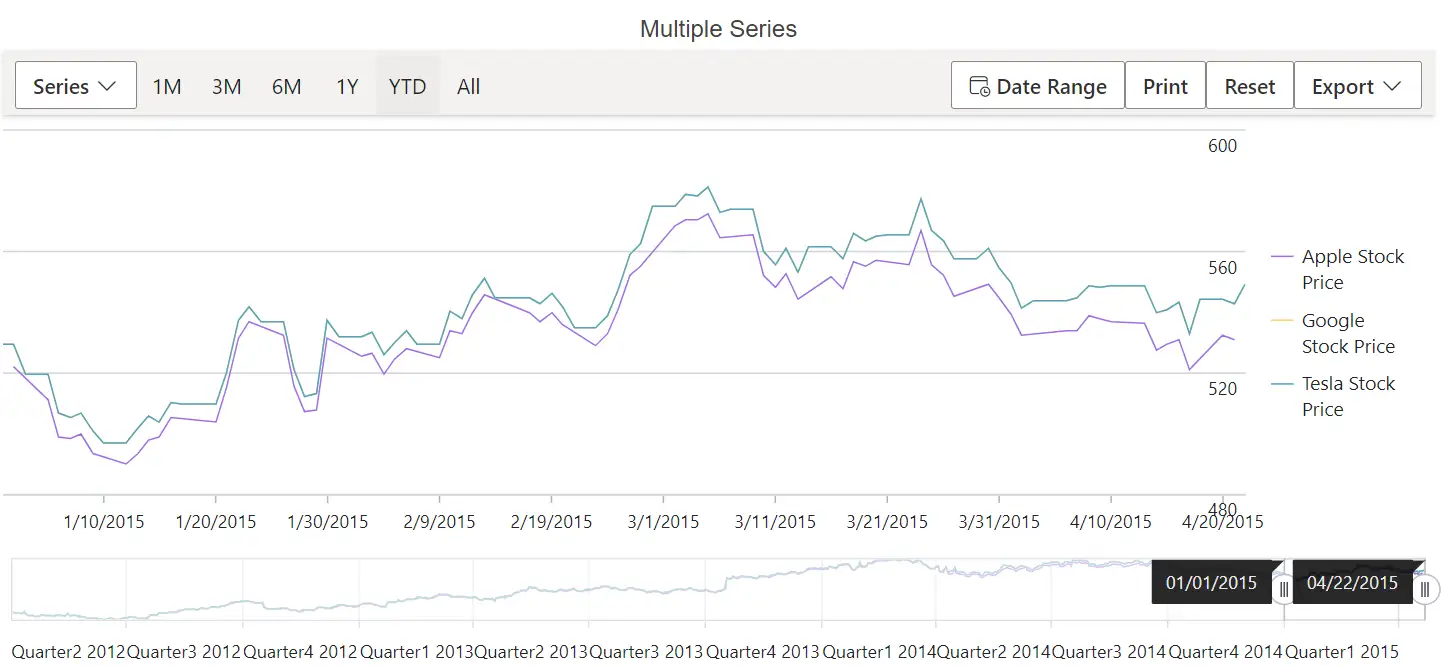
When legend text exceeds the container, enable wrapping using the TextWrap property. Wrapping can also be controlled using the MaxLabelWidth property.
@using Syncfusion.Blazor.Charts

<SfStockChart Title="AAPL Stock Price">
    <StockChartLegendSettings Visible="true" Position="@LegendPosition.Right" TextWrap="@TextWrap.Wrap" MaxLabelWidth="70">
    </StockChartLegendSettings>
    <StockChartSeriesCollection>
        <StockChartSeries DataSource="@StockDetails" Type="ChartSeriesType.Line" XName="Date" High="High" Low="Low" Open="Open" Close="Close" Name="Apple Stock Price"></StockChartSeries>
        <StockChartSeries DataSource="@StockDetails" Type="ChartSeriesType.Line" XName="Date" High="High" Low="Low" Open="Open" Close="Close" Name="Google Stock Price"></StockChartSeries>
        <StockChartSeries DataSource="@StockDetails" Type="ChartSeriesType.Spline" XName="Date" High="High" Low="Low" Open="Open" Close="Close" Name="Tesla Stock Price"></StockChartSeries>
    </StockChartSeriesCollection>
</SfStockChart>

@code {
    public class ChartData
    {
        public DateTime Date { get; set; }
        public Double Open { get; set; }
        public Double Low { get; set; }
        public Double Close { get; set; }
        public Double High { get; set; }
        public Double Volume { get; set; }
    }

    public List<ChartData> StockDetails = new List<ChartData>
    {
        new ChartData { Date = new DateTime(2012, 04, 02), Open = 85.9757, High = 90.6657, Low = 85.7685, Close = 90.5257, Volume = 660187068 },
        new ChartData { Date = new DateTime(2012, 04, 09), Open = 89.4471, High = 92, Low = 86.2157, Close = 86.4614, Volume = 912634864 },
        new ChartData { Date = new DateTime(2012, 04, 16), Open = 87.1514, High = 88.6071, Low = 81.4885, Close = 81.8543, Volume = 1221746066 },
        new ChartData { Date = new DateTime(2012, 04, 23), Open = 81.5157, High = 88.2857, Low = 79.2857, Close = 86.1428, Volume = 965935749 },
        new ChartData { Date = new DateTime(2012, 04, 30), Open = 85.4, High = 85.4857, Low = 80.7385, Close = 80.75, Volume = 615249365 }
   };
}
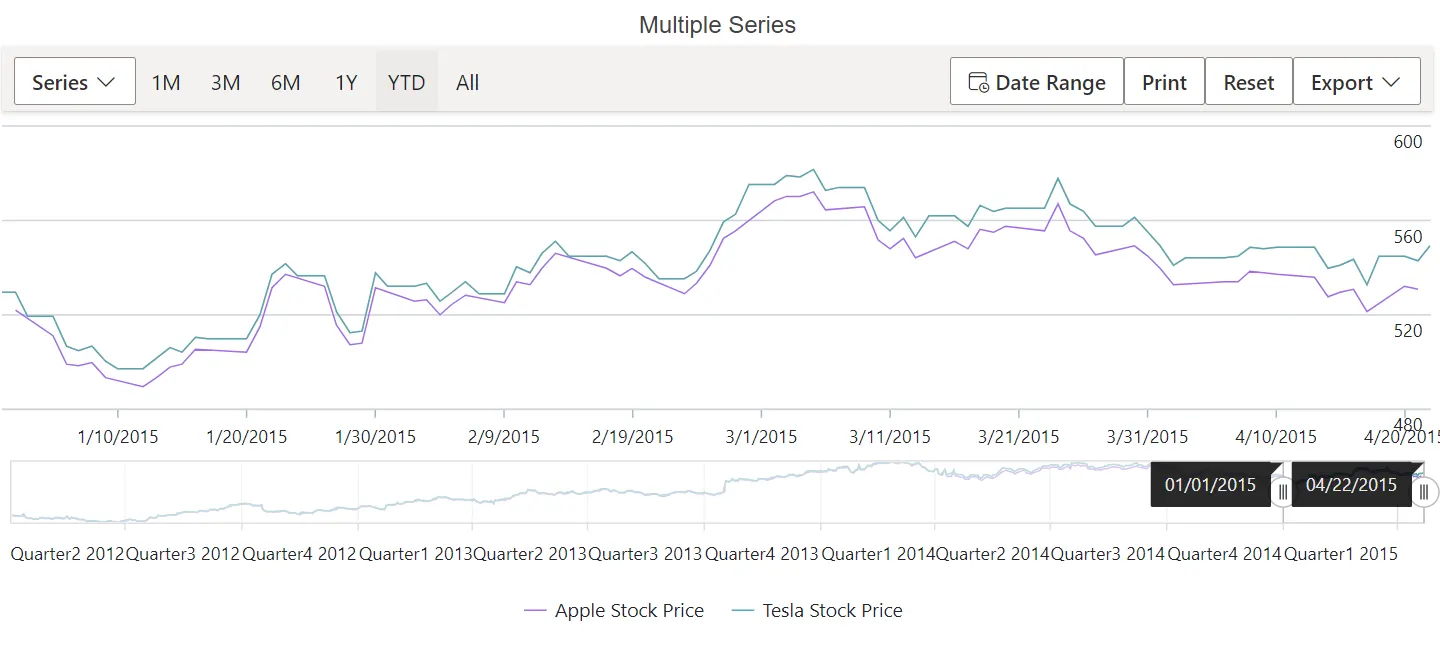
Series selection based on legend
By default, clicking a legend item collapses the visibility of the corresponding series. The ToggleVisibility property disables this behavior when set to false.
@using Syncfusion.Blazor.Charts

<SfStockChart Title="AAPL Stock Price" SelectionMode="SelectionMode.Series">
    <StockChartLegendSettings Visible="true"  ToggleVisibility="false">
    </StockChartLegendSettings>
    <StockChartSeriesCollection>
        <StockChartSeries DataSource="@StockDetails" Type="ChartSeriesType.Line" XName="Date" High="High" Low="Low" Open="Open" Close="Close" Name="Apple Stock Price"></StockChartSeries>
        <StockChartSeries DataSource="@StockDetails" Type="ChartSeriesType.Line" XName="Date" High="High" Low="Low" Open="Open" Close="Close" Name="Google Stock Price"></StockChartSeries>
        <StockChartSeries DataSource="@StockDetails" Type="ChartSeriesType.Spline" XName="Date" High="High" Low="Low" Open="Open" Close="Close" Name="Tesla Stock Price"></StockChartSeries>
    </StockChartSeriesCollection>
</SfStockChart>

@code {
    public class ChartData
    {
        public DateTime Date { get; set; }
        public Double Open { get; set; }
        public Double Low { get; set; }
        public Double Close { get; set; }
        public Double High { get; set; }
        public Double Volume { get; set; }
    }

    public List<ChartData> StockDetails = new List<ChartData>
    {
        new ChartData { Date = new DateTime(2012, 04, 02), Open = 85.9757, High = 90.6657, Low = 85.7685, Close = 90.5257, Volume = 660187068 },
        new ChartData { Date = new DateTime(2012, 04, 09), Open = 89.4471, High = 92, Low = 86.2157, Close = 86.4614, Volume = 912634864 },
        new ChartData { Date = new DateTime(2012, 04, 16), Open = 87.1514, High = 88.6071, Low = 81.4885, Close = 81.8543, Volume = 1221746066 },
        new ChartData { Date = new DateTime(2012, 04, 23), Open = 81.5157, High = 88.2857, Low = 79.2857, Close = 86.1428, Volume = 965935749 },
        new ChartData { Date = new DateTime(2012, 04, 30), Open = 85.4, High = 85.4857, Low = 80.7385, Close = 80.75, Volume = 615249365 }
   };
}
Hiding legend item
The series Name is used as the legend text by default. Skip the legend for a specific series by providing an empty string for the Name property.
@using Syncfusion.Blazor.Charts

<SfStockChart Title="AAPL Stock Price" SelectionMode="SelectionMode.Series">
    <StockChartLegendSettings Visible="true"  ToggleVisibility="true">
    </StockChartLegendSettings>
    <StockChartSeriesCollection>
        <StockChartSeries DataSource="@StockDetails" Type="ChartSeriesType.Line" XName="Date" High="High" Low="Low" Open="Open" Close="Close" Name="Apple Stock Price"></StockChartSeries>
        <StockChartSeries DataSource="@StockDetails" Type="ChartSeriesType.Line" XName="Date" High="High" Low="Low" Open="Open" Close="Close" Name="Google Stock Price"></StockChartSeries>
        <StockChartSeries DataSource="@StockDetails" Type="ChartSeriesType.Spline" XName="Date" High="High" Low="Low" Open="Open" Close="Close" Name="Tesla Stock Price"></StockChartSeries>
    </StockChartSeriesCollection>
</SfStockChart>

@code {
    public class ChartData
    {
        public DateTime Date { get; set; }
        public Double Open { get; set; }
        public Double Low { get; set; }
        public Double Close { get; set; }
        public Double High { get; set; }
        public Double Volume { get; set; }
    }

    public List<ChartData> StockDetails = new List<ChartData>
    {
        new ChartData { Date = new DateTime(2012, 04, 02), Open = 85.9757, High = 90.6657, Low = 85.7685, Close = 90.5257, Volume = 660187068 },
        new ChartData { Date = new DateTime(2012, 04, 09), Open = 89.4471, High = 92, Low = 86.2157, Close = 86.4614, Volume = 912634864 },
        new ChartData { Date = new DateTime(2012, 04, 16), Open = 87.1514, High = 88.6071, Low = 81.4885, Close = 81.8543, Volume = 1221746066 },
        new ChartData { Date = new DateTime(2012, 04, 23), Open = 81.5157, High = 88.2857, Low = 79.2857, Close = 86.1428, Volume = 965935749 },
        new ChartData { Date = new DateTime(2012, 04, 30), Open = 85.4, High = 85.4857, Low = 80.7385, Close = 80.75, Volume = 615249365 }
   };
}
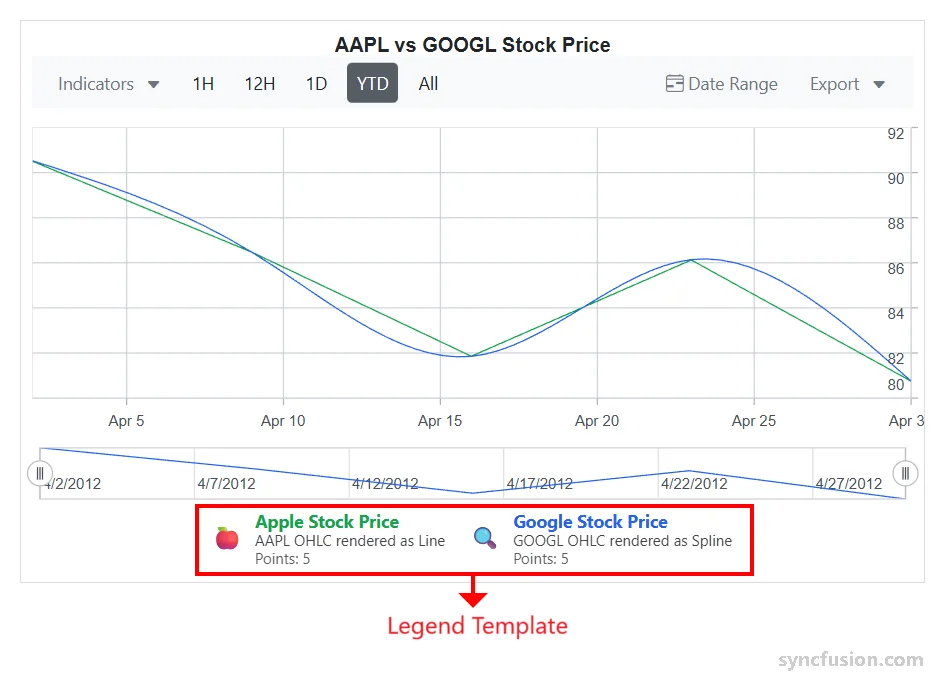
Legend Template
Legend templates allow you to replace default legend icons and text with custom HTML or Blazor markup for each series. This enables branded styles, richer content (icons, multi-line text, badges), improved readability, and localization.
To use, add a LegendItemTemplate inside any StockChartSeries you want to customize. The rendered content becomes the legend item and can be styled with CSS. Legend interactions (click to toggle series) remain unless ToggleVisibility is set to false. Templates work with all legend positions, alignments, and paging.
@using Syncfusion.Blazor.Charts

@* Initialize the stock chart component and configure its essential features *@
<SfStockChart Title="AAPL vs GOOGL Stock Price"
              SelectionMode="SelectionMode.Series">

    @* Display the legend and allow toggling series visibility on interaction *@
    <StockChartLegendSettings Visible="true" ToggleVisibility="true" />

    <StockChartSeriesCollection>

        @* Define the first series using OHLC fields and render it as a line to show trend *@
        <StockChartSeries DataSource="@StockDetails" Type="ChartSeriesType.Line" XName="Date" High="High" Low="Low" Open="Open" Close="Close" Name="Apple Stock Price" Fill="@AppleColor">
            @* This legend item contains an emoji indicator, a color swatch, a descriptive label, and a dynamic point count *@
            <LegendItemTemplate>
                <div style="display:flex; align-items:center; gap:10px; padding:6px 0;">
                    <span style="font-size:18px;">🍎</span>
                    <div style="display:flex; flex-direction:column; line-height:1.2;">
                        <span style="font-family:'Segoe UI'; font-size:14px; font-weight:700; color:@AppleColor;">
                            Apple Stock Price
                        </span>
                        <span style="font-size:12px; opacity:0.85;">
                            AAPL OHLC rendered as Line
                        </span>
                        <span style="font-size:12px; opacity:0.75;">
                            Points: @StockDetails.Count
                        </span>
                    </div>
                </div>
            </LegendItemTemplate>
        </StockChartSeries>

        @* Define the second series using the same OHLC fields and render it as a spline for a smoothed trend *@
        <StockChartSeries DataSource="@StockDetails" Type="ChartSeriesType.Spline" XName="Date" High="High" Low="Low" Open="Open" Close="Close" Name="Google Stock Price" Fill="@GoogleColor">
            @* This legend item presents an emoji indicator, a color swatch, a descriptive label, and a dynamic point count *@
            <LegendItemTemplate>
                <div style="display:flex; align-items:center; gap:10px; padding:6px 0;">
                    <span style="font-size:18px;">🔍</span>
                    <div style="display:flex; flex-direction:column; line-height:1.2;">
                        <span style="font-family:'Segoe UI'; font-size:14px; font-weight:700; color:@GoogleColor;">
                            Google Stock Price
                        </span>
                        <span style="font-size:12px; opacity:0.85;">
                            GOOGL OHLC rendered as Spline
                        </span>
                        <span style="font-size:12px; opacity:0.75;">
                            Points: @StockDetails.Count
                        </span>
                    </div>
                </div>
            </LegendItemTemplate>
        </StockChartSeries>

    </StockChartSeriesCollection>
</SfStockChart>

@code {
    private string AppleColor => "#16a34a";
    private string GoogleColor => "#2563eb";

    public class ChartData
    {
        public DateTime Date { get; set; }
        public double Open { get; set; }
        public double Low { get; set; }
        public double Close { get; set; }
        public double High { get; set; }
        public double Volume { get; set; }
    }

    public List<ChartData> StockDetails = new List<ChartData>
    {
        new ChartData { Date = new DateTime(2012, 04, 02), Open = 85.9757, High = 90.6657, Low = 85.7685, Close = 90.5257, Volume = 660187068 },
        new ChartData { Date = new DateTime(2012, 04, 09), Open = 89.4471, High = 92,       Low = 86.2157, Close = 86.4614, Volume = 912634864 },
        new ChartData { Date = new DateTime(2012, 04, 16), Open = 87.1514, High = 88.6071, Low = 81.4885, Close = 81.8543, Volume = 1221746066 },
        new ChartData { Date = new DateTime(2012, 04, 23), Open = 81.5157, High = 88.2857, Low = 79.2857, Close = 86.1428, Volume = 965935749 },
        new ChartData { Date = new DateTime(2012, 04, 30), Open = 85.4,    High = 85.4857, Low = 80.7385, Close = 80.75,   Volume = 615249365 }
    };
}