Period Selector in Blazor Stock Chart Component
29 Jun 20266 minutes to read
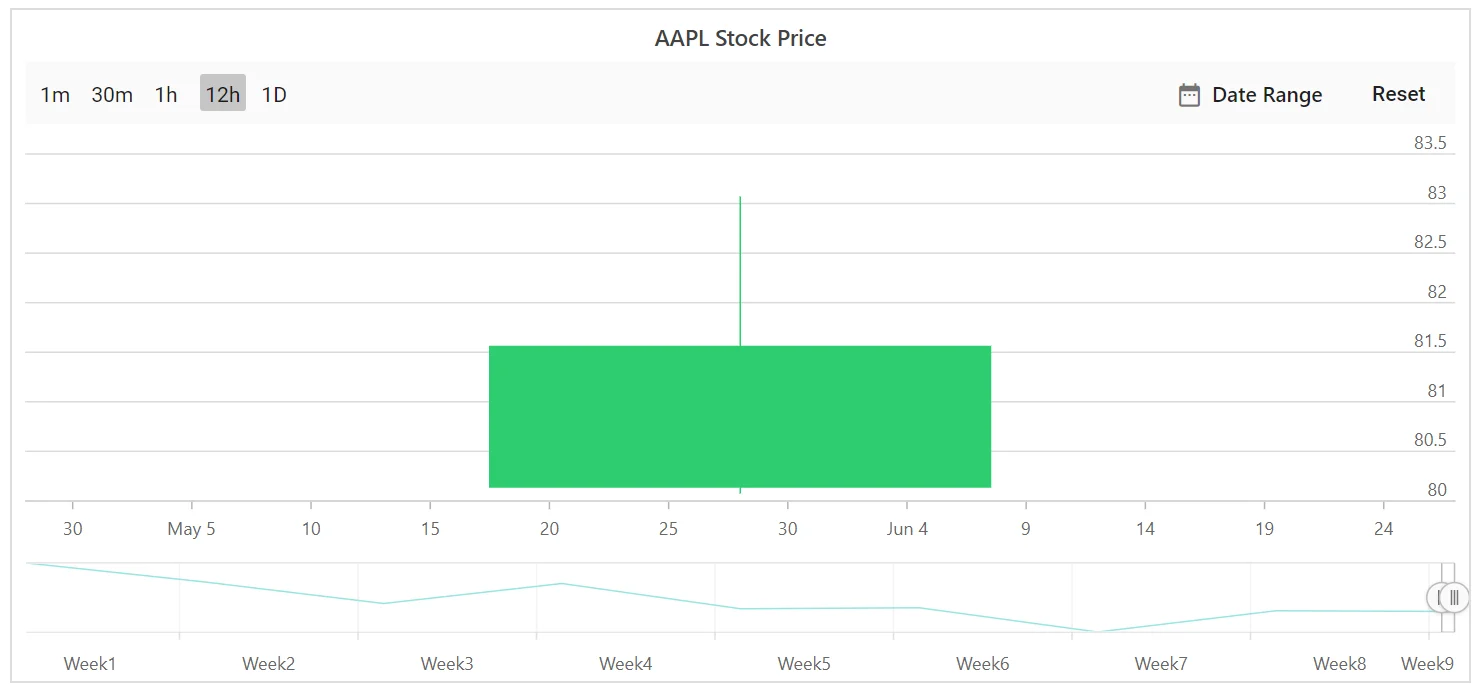
The period selector enables selecting a range with specified periods. The period selector is enabled by default in the stock chart.
Periods
Periods is an array of objects that defines the range of Periods. The Interval property specifies the count value of the button, and the Text property specifies the text displayed on the button. The IntervalType property customizes the intervals of the buttons and supports the following types:
- Auto
- Years
- Quarter
- Months
- Weeks
- Days
- Hours
- Minutes
- Seconds
@using Syncfusion.Blazor.Charts

<SfStockChart Title="AAPL Stock Price" IndicatorType="@IndicatorType" TrendlineType="@TrendlineType" SeriesType="@SeriesType" ExportType="@ExportType">
    <StockChartPeriods>
        <StockChartPeriod IntervalType=RangeIntervalType.Minutes Interval="1" Text='1m'></StockChartPeriod>
        <StockChartPeriod IntervalType=RangeIntervalType.Minutes Interval="30" Text='30m'></StockChartPeriod>
        <StockChartPeriod IntervalType=RangeIntervalType.Hours Interval="1" Text='1h'></StockChartPeriod>
        <StockChartPeriod IntervalType=RangeIntervalType.Hours Interval="12" Text='12h' Selected="true"></StockChartPeriod>
        <StockChartPeriod Text="1D"></StockChartPeriod>
    </StockChartPeriods>
    <StockChartCrosshairSettings Enable="true"></StockChartCrosshairSettings>
    <StockChartPrimaryXAxis>
        <StockChartAxisMajorGridLines Color="Transparent"></StockChartAxisMajorGridLines>
    </StockChartPrimaryXAxis>
    <StockChartPrimaryYAxis>
        <StockChartAxisLineStyle Color="Transparent"></StockChartAxisLineStyle>
        <StockChartAxisMajorTickLines Color="Transparent" Width="0"></StockChartAxisMajorTickLines>
    </StockChartPrimaryYAxis>
    <StockChartSeriesCollection>
        <StockChartSeries DataSource="@StockDetails" Type="ChartSeriesType.Candle" XName="Date" High="High" Low="Low" Open="Open" Close="Close" Name="google"></StockChartSeries>
    </StockChartSeriesCollection>
</SfStockChart>

@code {
    public List<TechnicalIndicators> IndicatorType = new List<TechnicalIndicators>() { };
    public List<TrendlineTypes> TrendlineType = new List<TrendlineTypes>() { };
    public List<ExportType> ExportType = new List<ExportType>() { };
    public List<ChartSeriesType> SeriesType = new List<ChartSeriesType>() { };

    public class ChartData
    {
        public DateTime Date { get; set; }
        public Double Open { get; set; }
        public Double Low { get; set; }
        public Double Close { get; set; }
        public Double High { get; set; }
        public Double Volume { get; set; }
    }

    public List<ChartData> StockDetails = new List<ChartData>
    {
        new ChartData { Date = new DateTime(2012, 04, 02), Open = 85.9757, High = 90.6657, Low = 85.7685, Close = 90.5257, Volume = 660187068 },
        new ChartData { Date = new DateTime(2012, 04, 09), Open = 89.4471, High = 92, Low = 86.2157, Close = 86.4614, Volume = 912634864 },
        new ChartData { Date = new DateTime(2012, 04, 16), Open = 87.1514, High = 88.6071, Low = 81.4885, Close = 81.8543, Volume = 1221746066 },
        new ChartData { Date = new DateTime(2012, 04, 23), Open = 81.5157, High = 88.2857, Low = 79.2857, Close = 86.1428, Volume = 965935749 },
        new ChartData { Date = new DateTime(2012, 04, 30), Open = 85.4, High = 85.4857, Low = 80.7385, Close = 80.75, Volume = 615249365 },
        new ChartData { Date = new DateTime(2012, 05, 07), Open = 80.2143, High = 82.2685, Low = 79.8185, Close = 80.9585, Volume = 541742692 },
        new ChartData { Date = new DateTime(2012, 05, 14), Open = 80.3671, High = 81.0728, Low = 74.5971, Close = 75.7685, Volume = 708126233 },
        new ChartData { Date = new DateTime(2012, 05, 21), Open = 76.3571, High = 82.3571, Low = 76.2928, Close = 80.3271, Volume = 682076215 },
        new ChartData { Date = new DateTime(2012, 05, 28), Open = 81.5571, High = 83.0714, Low = 80.0743, Close = 80.1414, Volume = 480059584 }
   };
}
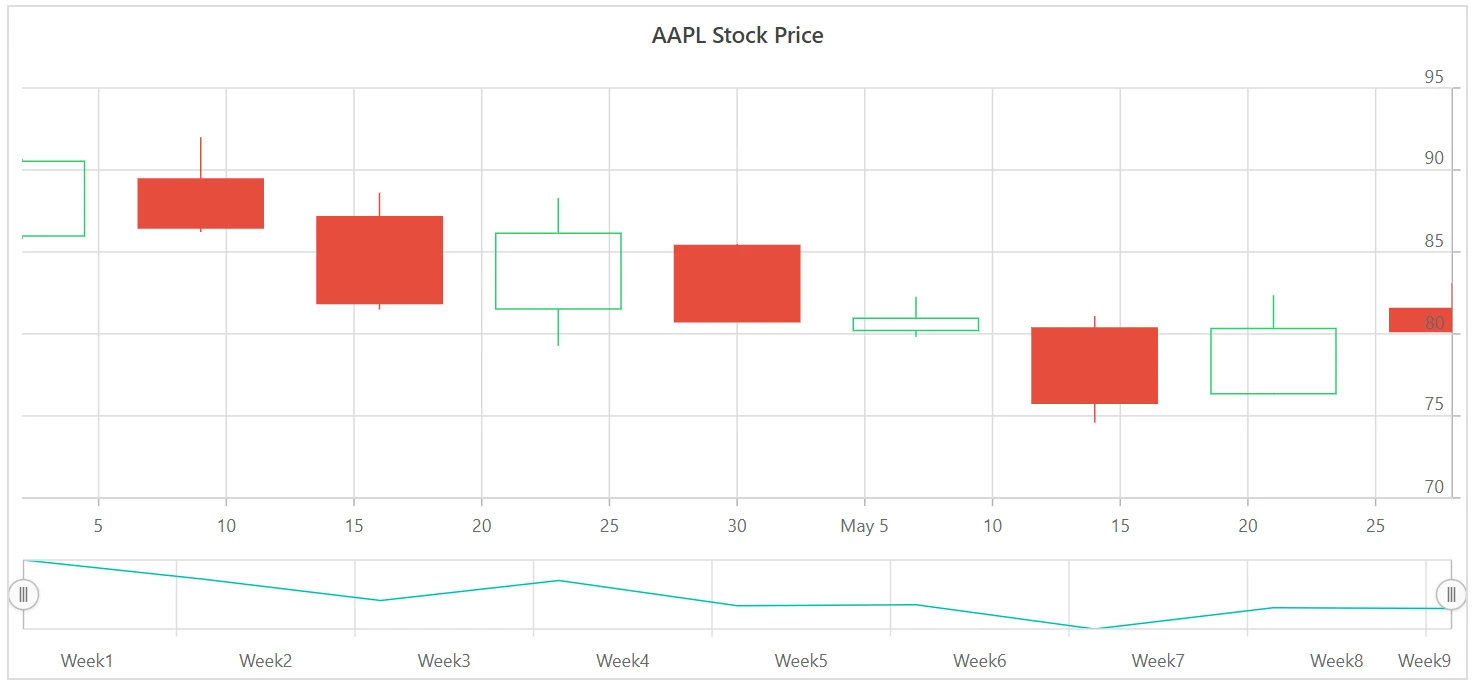
Visibility of period selector
The EnablePeriodSelector property toggles the visibility of the period selector.
@using Syncfusion.Blazor.Charts

<SfStockChart Title="AAPL Stock Price" EnablePeriodSelector="false">
    <StockChartSeriesCollection>
        <StockChartSeries DataSource="@StockDetails" Type="ChartSeriesType.Candle" XName="Date" High="High" Low="Low" Open="Open" Close="Close" Volume="Volume" Name="google"></StockChartSeries>
    </StockChartSeriesCollection>
</SfStockChart>

@code {
    public class ChartData
    {
        public DateTime Date { get; set; }
        public Double Open { get; set; }
        public Double Low { get; set; }
        public Double Close { get; set; }
        public Double High { get; set; }
        public Double Volume { get; set; }
    }

    public List<ChartData> StockDetails = new List<ChartData>
    {
        new ChartData { Date = new DateTime(2012, 04, 02), Open = 85.9757, High = 90.6657, Low = 85.7685, Close = 90.5257, Volume = 660187068 },
        new ChartData { Date = new DateTime(2012, 04, 09), Open = 89.4471, High = 92, Low = 86.2157, Close = 86.4614, Volume = 912634864 },
        new ChartData { Date = new DateTime(2012, 04, 16), Open = 87.1514, High = 88.6071, Low = 81.4885, Close = 81.8543, Volume = 1221746066 },
        new ChartData { Date = new DateTime(2012, 04, 23), Open = 81.5157, High = 88.2857, Low = 79.2857, Close = 86.1428, Volume = 965935749 },
        new ChartData { Date = new DateTime(2012, 04, 30), Open = 85.4, High = 85.4857, Low = 80.7385, Close = 80.75, Volume = 615249365 },
        new ChartData { Date = new DateTime(2012, 05, 07), Open = 80.2143, High = 82.2685, Low = 79.8185, Close = 80.9585, Volume = 541742692 },
        new ChartData { Date = new DateTime(2012, 05, 14), Open = 80.3671, High = 81.0728, Low = 74.5971, Close = 75.7685, Volume = 708126233 },
        new ChartData { Date = new DateTime(2012, 05, 21), Open = 76.3571, High = 82.3571, Low = 76.2928, Close = 80.3271, Volume = 682076215 },
        new ChartData { Date = new DateTime(2012, 05, 28), Open = 81.5571, High = 83.0714, Low = 80.0743, Close = 80.1414, Volume = 480059584 }
    };
}