Tooltip in Blazor Stock Chart Component
29 Jun 202611 minutes to read
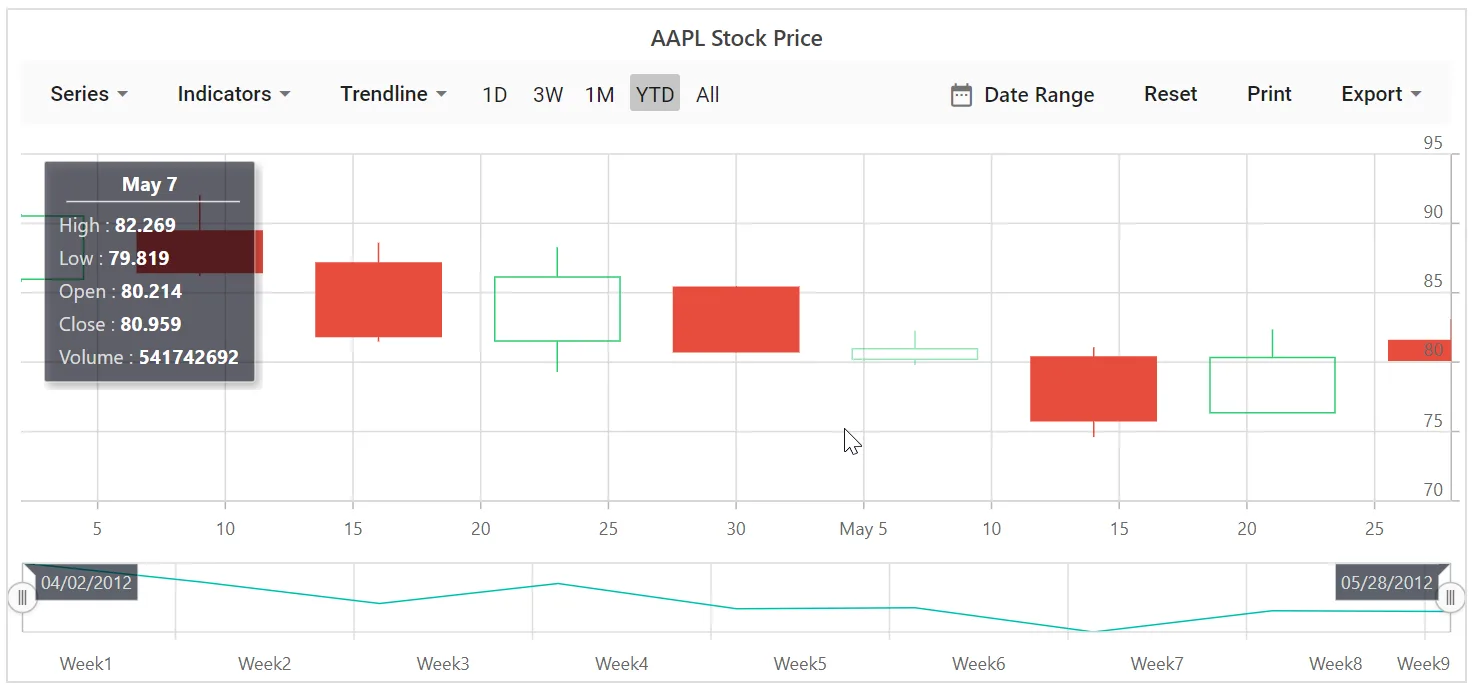
The Stock Chart displays data point details using a tooltip when the pointer hovers over a point.
Default tooltip
By default, the tooltip is disabled. Enable it by setting the Enable property to true.
@using Syncfusion.Blazor.Charts

<SfStockChart Title="AAPL Stock Price">
    <StockChartTooltipSettings Enable="true">
    </StockChartTooltipSettings>

    <StockChartSeriesCollection>
        <StockChartSeries DataSource="@StockDetails" Type="ChartSeriesType.Candle" XName="Date" High="High" Low="Low" Open="Open" Close="Close" Volume="Volume" Name="Google"></StockChartSeries>
    </StockChartSeriesCollection>
</SfStockChart>

@code {
    public class ChartData
    {
        public DateTime Date { get; set; }
        public Double Open { get; set; }
        public Double Low { get; set; }
        public Double Close { get; set; }
        public Double High { get; set; }
        public Double Volume { get; set; }
    }

    public List<ChartData> StockDetails = new List<ChartData>
    {
        new ChartData { Date = new DateTime(2012, 04, 02), Open = 85.9757, High = 90.6657, Low = 85.7685, Close = 90.5257, Volume = 660187068 },
        new ChartData { Date = new DateTime(2012, 04, 09), Open = 89.4471, High = 92, Low = 86.2157, Close = 86.4614, Volume = 912634864 },
        new ChartData { Date = new DateTime(2012, 04, 16), Open = 87.1514, High = 88.6071, Low = 81.4885, Close = 81.8543, Volume = 1221746066 },
        new ChartData { Date = new DateTime(2012, 04, 23), Open = 81.5157, High = 88.2857, Low = 79.2857, Close = 86.1428, Volume = 965935749 },
        new ChartData { Date = new DateTime(2012, 04, 30), Open = 85.4, High = 85.4857, Low = 80.7385, Close = 80.75, Volume = 615249365 },
        new ChartData { Date = new DateTime(2012, 05, 07), Open = 80.2143, High = 82.2685, Low = 79.8185, Close = 80.9585, Volume = 541742692 },
        new ChartData { Date = new DateTime(2012, 05, 14), Open = 80.3671, High = 81.0728, Low = 74.5971, Close = 75.7685, Volume = 708126233 },
        new ChartData { Date = new DateTime(2012, 05, 21), Open = 76.3571, High = 82.3571, Low = 76.2928, Close = 80.3271, Volume = 682076215 },
        new ChartData { Date = new DateTime(2012, 05, 28), Open = 81.5571, High = 83.0714, Low = 80.0743, Close = 80.1414, Volume = 480059584 }
   };
}
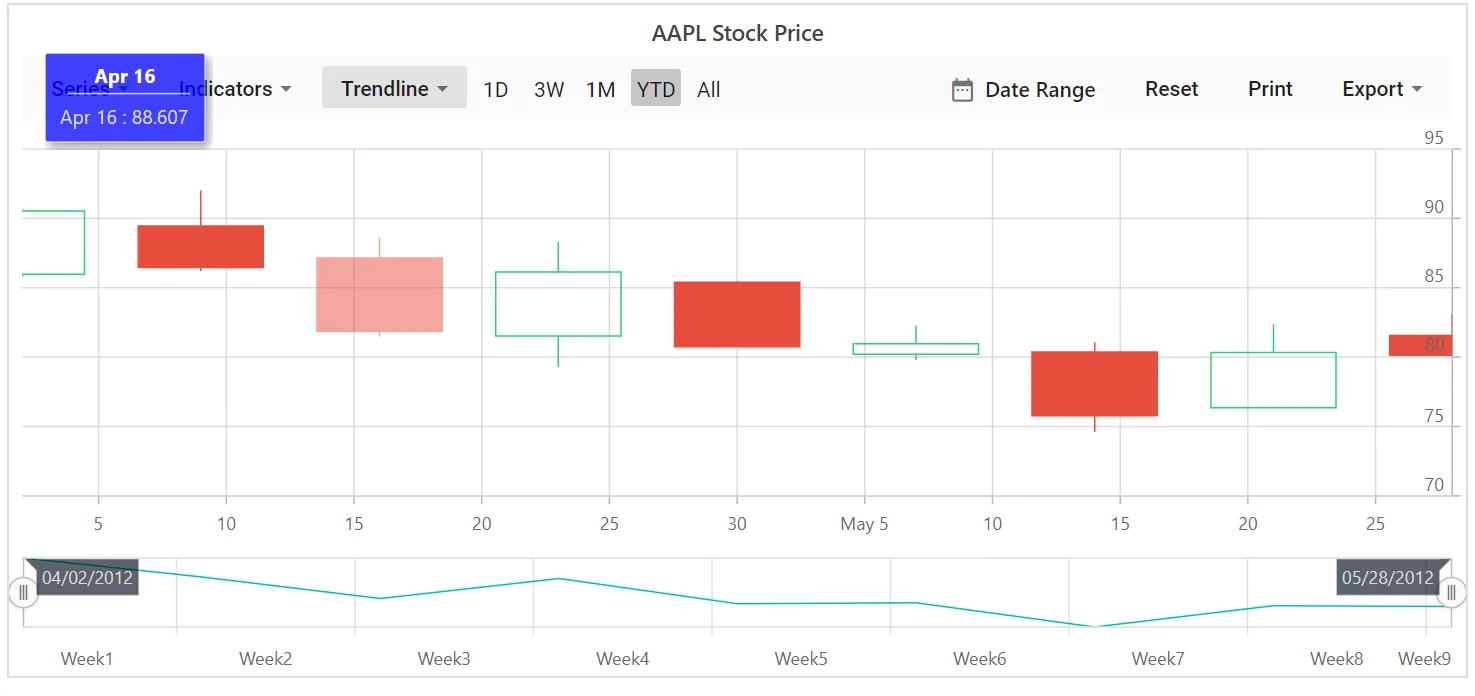
Format the tooltip
By default, the tooltip shows the x and y values of a point. Additional information can be displayed using a format template. For example, the format ${point.x} : ${point.high} shows the x-value and the high value.
@using Syncfusion.Blazor.Charts

<SfStockChart Title="AAPL Stock Price">
    <StockChartTooltipSettings Enable="true" Format="<b>${point.x} : ${point.high}</b>">
    </StockChartTooltipSettings>

    <StockChartSeriesCollection>
        <StockChartSeries DataSource="@StockDetails" Type="ChartSeriesType.Candle" XName="Date" High="High" Low="Low" Open="Open" Close="Close" Volume="Volume" Name="google"></StockChartSeries>
    </StockChartSeriesCollection>
</SfStockChart>

@code {
    public class ChartData
    {
        public DateTime Date { get; set; }
        public Double Open { get; set; }
        public Double Low { get; set; }
        public Double Close { get; set; }
        public Double High { get; set; }
        public Double Volume { get; set; }
    }

    public List<ChartData> StockDetails = new List<ChartData>
    {
        new ChartData { Date = new DateTime(2012, 04, 02), Open = 85.9757, High = 90.6657, Low = 85.7685, Close = 90.5257, Volume = 660187068 },
        new ChartData { Date = new DateTime(2012, 04, 09), Open = 89.4471, High = 92, Low = 86.2157, Close = 86.4614, Volume = 912634864 },
        new ChartData { Date = new DateTime(2012, 04, 16), Open = 87.1514, High = 88.6071, Low = 81.4885, Close = 81.8543, Volume = 1221746066 },
        new ChartData { Date = new DateTime(2012, 04, 23), Open = 81.5157, High = 88.2857, Low = 79.2857, Close = 86.1428, Volume = 965935749 },
        new ChartData { Date = new DateTime(2012, 04, 30), Open = 85.4, High = 85.4857, Low = 80.7385, Close = 80.75, Volume = 615249365 },
        new ChartData { Date = new DateTime(2012, 05, 07), Open = 80.2143, High = 82.2685, Low = 79.8185, Close = 80.9585, Volume = 541742692 },
        new ChartData { Date = new DateTime(2012, 05, 14), Open = 80.3671, High = 81.0728, Low = 74.5971, Close = 75.7685, Volume = 708126233 },
        new ChartData { Date = new DateTime(2012, 05, 21), Open = 76.3571, High = 82.3571, Low = 76.2928, Close = 80.3271, Volume = 682076215 },
        new ChartData { Date = new DateTime(2012, 05, 28), Open = 81.5571, High = 83.0714, Low = 80.0743, Close = 80.1414, Volume = 480059584 }
   };
}
Customize the appearance of tooltip
The Fill and Border properties customize the tooltip background and border. The TextStyle property customizes the tooltip text font.
@using Syncfusion.Blazor.Charts

<SfStockChart Title="AAPL Stock Price">
    <StockChartTooltipSettings Enable="true" Format="${point.x} : ${point.high}" Fill="#7bb4eb">
    </StockChartTooltipSettings>

    <StockChartSeriesCollection>
        <StockChartSeries DataSource="@StockDetails" Type="ChartSeriesType.Candle" XName="Date" High="High" Low="Low" Open="Open" Close="Close" Volume="Volume" Name="Google"></StockChartSeries>
    </StockChartSeriesCollection>
</SfStockChart>

@code {
    public class ChartData
    {
        public DateTime Date { get; set; }
        public Double Open { get; set; }
        public Double Low { get; set; }
        public Double Close { get; set; }
        public Double High { get; set; }
        public Double Volume { get; set; }
    }

    public List<ChartData> StockDetails = new List<ChartData>
    {
        new ChartData { Date = new DateTime(2012, 04, 02), Open = 85.9757, High = 90.6657, Low = 85.7685, Close = 90.5257, Volume = 660187068 },
        new ChartData { Date = new DateTime(2012, 04, 09), Open = 89.4471, High = 92, Low = 86.2157, Close = 86.4614, Volume = 912634864 },
        new ChartData { Date = new DateTime(2012, 04, 16), Open = 87.1514, High = 88.6071, Low = 81.4885, Close = 81.8543, Volume = 1221746066 },
        new ChartData { Date = new DateTime(2012, 04, 23), Open = 81.5157, High = 88.2857, Low = 79.2857, Close = 86.1428, Volume = 965935749 },
        new ChartData { Date = new DateTime(2012, 04, 30), Open = 85.4, High = 85.4857, Low = 80.7385, Close = 80.75, Volume = 615249365 },
        new ChartData { Date = new DateTime(2012, 05, 07), Open = 80.2143, High = 82.2685, Low = 79.8185, Close = 80.9585, Volume = 541742692 },
        new ChartData { Date = new DateTime(2012, 05, 14), Open = 80.3671, High = 81.0728, Low = 74.5971, Close = 75.7685, Volume = 708126233 },
        new ChartData { Date = new DateTime(2012, 05, 21), Open = 76.3571, High = 82.3571, Low = 76.2928, Close = 80.3271, Volume = 682076215 },
        new ChartData { Date = new DateTime(2012, 05, 28), Open = 81.5571, High = 83.0714, Low = 80.0743, Close = 80.1414, Volume = 480059584 }
   };
}
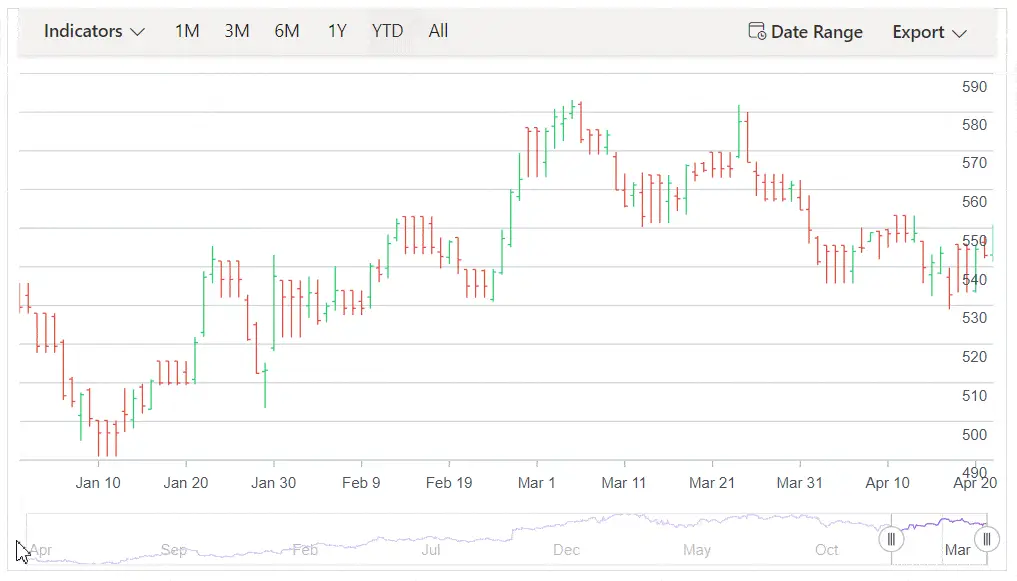
Tooltip position
By default, the tooltip aligns to the left side of the Stock Chart. To move the tooltip with the pointer across data points, set Nearest to the TooltipPosition property in the StockChartTooltipSetting.
@using Syncfusion.Blazor.Charts

<SfStockChart>
    <StockChartPrimaryXAxis>
        <StockChartAxisMajorGridLines Width="0"></StockChartAxisMajorGridLines>
        <StockChartAxisCrosshairTooltip Enable="true"></StockChartAxisCrosshairTooltip>
    </StockChartPrimaryXAxis>
    <StockChartPrimaryYAxis LabelFormat="n0">
        <StockChartAxisLineStyle Width="0"></StockChartAxisLineStyle>
        <StockChartAxisMajorTickLines Width="0"></StockChartAxisMajorTickLines>
    </StockChartPrimaryYAxis>
    <StockChartTooltipSettings Enable="true" TooltipPosition="TooltipPosition.Nearest"></StockChartTooltipSettings>
    <StockChartCrosshairSettings Enable="true"></StockChartCrosshairSettings>
    <StockChartSeriesCollection>
        <StockChartSeries DataSource="@StockDetails" Type="ChartSeriesType.HiloOpenClose" XName="Date" High="High" Low="Low" Open="Open" Close="Close" Volume="Volume"></StockChartSeries>
    </StockChartSeriesCollection>
    <StockChartChartArea>
        <StockChartChartAreaBorder Width="0"></StockChartChartAreaBorder>
    </StockChartChartArea>
</SfStockChart>

@code {
    public class ChartData
    {
        public DateTime Date { get; set; }
        public Double Open { get; set; }
        public Double Low { get; set; }
        public Double Close { get; set; }
        public Double High { get; set; }
        public Double Volume { get; set; }
    }

    public List<ChartData> StockDetails = new List<ChartData>
    {
        new ChartData { Date = new DateTime(2012, 04, 02), Open = 85.9757, High = 90.6657, Low = 85.7685, Close = 90.5257, Volume = 660187068 },
        new ChartData { Date = new DateTime(2012, 04, 09), Open = 89.4471, High = 92, Low = 86.2157, Close = 86.4614, Volume = 912634864 },
        new ChartData { Date = new DateTime(2012, 04, 16), Open = 87.1514, High = 88.6071, Low = 81.4885, Close = 81.8543, Volume = 1221746066 },
        new ChartData { Date = new DateTime(2012, 04, 23), Open = 81.5157, High = 88.2857, Low = 79.2857, Close = 86.1428, Volume = 965935749 },
        new ChartData { Date = new DateTime(2012, 04, 30), Open = 85.4, High = 85.4857, Low = 80.7385, Close = 80.75, Volume = 615249365 },
        new ChartData { Date = new DateTime(2012, 05, 07), Open = 80.2143, High = 82.2685, Low = 79.8185, Close = 80.9585, Volume = 541742692 },
        new ChartData { Date = new DateTime(2012, 05, 14), Open = 80.3671, High = 81.0728, Low = 74.5971, Close = 75.7685, Volume = 708126233 },
        new ChartData { Date = new DateTime(2012, 05, 21), Open = 76.3571, High = 82.3571, Low = 76.2928, Close = 80.3271, Volume = 682076215 },
        new ChartData { Date = new DateTime(2012, 05, 28), Open = 81.5571, High = 83.0714, Low = 80.0743, Close = 80.1414, Volume = 480059584 }
   };
}
NOTE
Refer to the Blazor Stock Charts feature tour page for a summary of key features and explore the Blazor Stock Chart example to learn about chart types and time based data visualization at equal intervals.