Working with Data in Blazor Stock Chart Component
29 Jun 202624 minutes to read
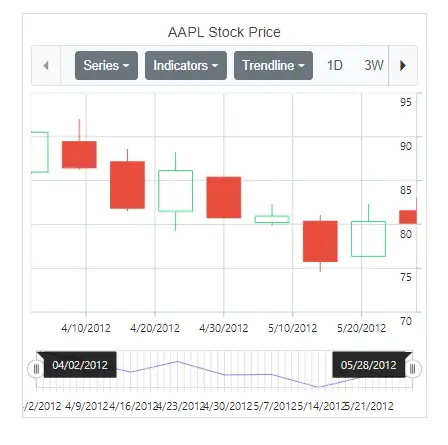
The Stock Chart uses SfDataManager, which supports RESTful JSON services and IEnumerable binding. The DataSource can be set using either the SfDataManager component or a list of business objects.
It supports the following data binding methods:
- List binding
- Remote data
List binding
To perform list binding, assign an IEnumerable object to the DataSource property. The list data source can also be provided using SfDataManager or by adding the SfDataManager component. Map the fields in the list to the
XName, High, Low, Open and Close
properties.
@using Syncfusion.Blazor.Charts

<SfStockChart Title="AAPL Stock Price">
    <StockChartSeriesCollection>
        <StockChartSeries DataSource="@StockDetails" Type="ChartSeriesType.Candle" XName="Date" High="High" Low="Low" Open="Open" Close="Close" Volume="Volume" Name="Google"></StockChartSeries>
    </StockChartSeriesCollection>
</SfStockChart>

@code {
    public class ChartData
    {
        public DateTime Date { get; set; }
        public Double Open { get; set; }
        public Double Low { get; set; }
        public Double Close { get; set; }
        public Double High { get; set; }
        public Double Volume{ get; set; }
    }

    public List<ChartData> StockDetails = new List<ChartData>
    {
         new ChartData { Date = new DateTime(2012, 04, 02), Open = 85.9757, High = 90.6657, Low = 85.7685, Close = 90.5257, Volume = 660187068 },
         new ChartData { Date = new DateTime(2012, 04, 09), Open = 89.4471, High = 92, Low = 86.2157, Close = 86.4614, Volume = 912634864 },
         new ChartData { Date = new DateTime(2012, 04, 16), Open = 87.1514, High = 88.6071, Low = 81.4885, Close = 81.8543, Volume = 1221746066 },
         new ChartData { Date = new DateTime(2012, 04, 23), Open = 81.5157, High = 88.2857, Low = 79.2857, Close = 86.1428, Volume = 965935749 },
         new ChartData { Date = new DateTime(2012, 04, 30), Open = 85.4, High =  85.4857, Low = 80.7385, Close = 80.75, Volume = 615249365 },
         new ChartData { Date = new DateTime(2012, 05, 07), Open = 80.2143, High = 82.2685, Low = 79.8185, Close = 80.9585, Volume = 541742692 },
         new ChartData { Date = new DateTime(2012, 05, 14), Open = 80.3671, High = 81.0728, Low = 74.5971, Close = 75.7685, Volume = 708126233 },
         new ChartData { Date = new DateTime(2012, 05, 21), Open = 76.3571, High = 82.3571, Low = 76.2928, Close = 80.3271, Volume = 682076215 },
         new ChartData { Date = new DateTime(2012, 05, 28), Open = 81.5571, High = 83.0714, Low = 80.0743, Close = 80.1414, Volume = 480059584 }
   };
}
NOTE
By default, SfDataManager uses BlazorAdaptor for list data binding.
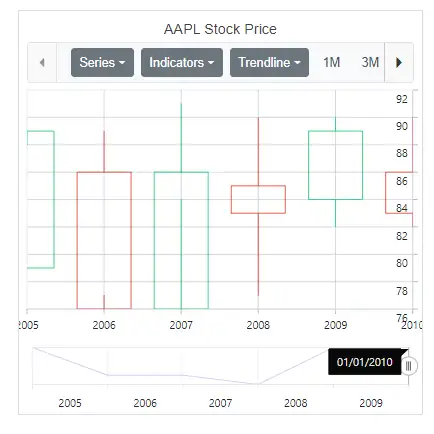
ExpandoObject binding
Stock Chart is a generic component strongly bound to a model type. When the model type is unknown at compile time, data can be supplied as a list of ExpandoObject and assigned to the DataSource property.
@using Syncfusion.Blazor.Charts
@using System.Dynamic

<SfStockChart Title="AAPL Stock Price">
    <StockChartSeriesCollection>
        <StockChartSeries DataSource="@StockInfo" Type="ChartSeriesType.Candle" XName="X" High="High" Low="Low" Open="Open" Close="Close" Volume="Volume" Name="Google"></StockChartSeries>
    </StockChartSeriesCollection>
</SfStockChart>

@code {
    private List<DateTime> Dates = new List<DateTime> { new DateTime(2005, 01, 01), new DateTime(2006, 01, 01),
        new DateTime(2007, 01, 01), new DateTime(2008, 01, 01), new DateTime(2009, 01, 01), new DateTime(2010, 01, 01), new DateTime(2011, 01, 01) };
    public DateTime[] Value = new DateTime[] { new DateTime(2006, 01, 01), new DateTime(2008, 01, 01) };
    public List<ExpandoObject> StockInfo { get; set; } = new List<ExpandoObject>();
    private Random randomNum = new Random();
    protected override void OnInitialized()
    {
        StockInfo = Enumerable.Range(0, 6).Select((x) =>
        {
            dynamic d = new ExpandoObject();
            d.X = Dates[x];
            d.Open = randomNum.Next(75, 85);
            d.High = randomNum.Next(88, 92);
            d.Low = randomNum.Next(76, 86);
            d.Close = randomNum.Next(85, 90);
            d.Volume = randomNum.Next(660187068, 965935749);
            return d;
        }).Cast<ExpandoObject>().ToList<ExpandoObject>();
    }
}
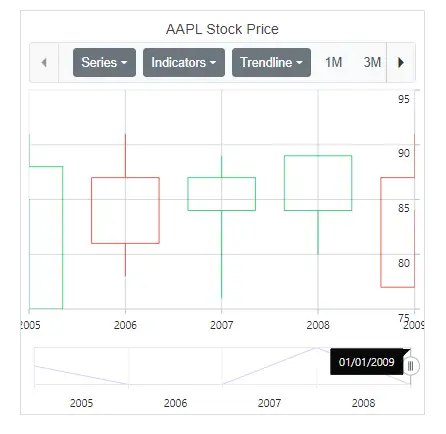
DynamicObject binding
Stock Chart supports DynamicObject as a data source when the model type is unknown. Assign the DynamicObject list to the DataSource property.
@using Syncfusion.Blazor.Charts
@using System.Dynamic

<SfStockChart Title="AAPL Stock Price">
    <StockChartSeriesCollection>
        <StockChartSeries DataSource="@MedalDetails" Type="ChartSeriesType.Candle" XName="X" High="High" Low="Low" Open="Open" Close="Close" Volume="Volume" Name="Google"></StockChartSeries>
    </StockChartSeriesCollection>
</SfStockChart>

@code {
    private List<DateTime> Dates = new List<DateTime> { new DateTime(2005, 01, 01), new DateTime(2006, 01, 01),
        new DateTime(2007, 01, 01), new DateTime(2008, 01, 01), new DateTime(2009, 01, 01), new DateTime(2010, 01, 01), new DateTime(2011, 01, 01) };
    public DateTime[] Value = new DateTime[] { new DateTime(2006, 01, 01), new DateTime(2008, 01, 01) };

    private Random randomNum = new Random();
    public List<DynamicDictionary> MedalDetails = new List<DynamicDictionary>() { };

    protected override void OnInitialized()
    {
        MedalDetails = Enumerable.Range(0, 5).Select((x) =>
        {
            dynamic d = new DynamicDictionary();
            d.X = Dates[x];
            d.Open = randomNum.Next(75, 85);
            d.High = randomNum.Next(88, 92);
            d.Low = randomNum.Next(76, 86);
            d.Close = randomNum.Next(85, 90);
            d.Volume = randomNum.Next(660187068, 965935749);
            return d;
        }).Cast<DynamicDictionary>().ToList<DynamicDictionary>();
    }

    public class DynamicDictionary : DynamicObject
    {
        Dictionary<string, object> dictionary = new Dictionary<string, object>();

        public override bool TryGetMember(GetMemberBinder binder, out object result)
        {
            string name = binder.Name;
            return dictionary.TryGetValue(name, out result);
        }

        public override bool TrySetMember(SetMemberBinder binder, object value)
        {
            dictionary[binder.Name] = value;
            return true;
        }

        public override System.Collections.Generic.IEnumerable<string> GetDynamicMemberNames()
        {
            return this.dictionary?.Keys;
        }
    }
}
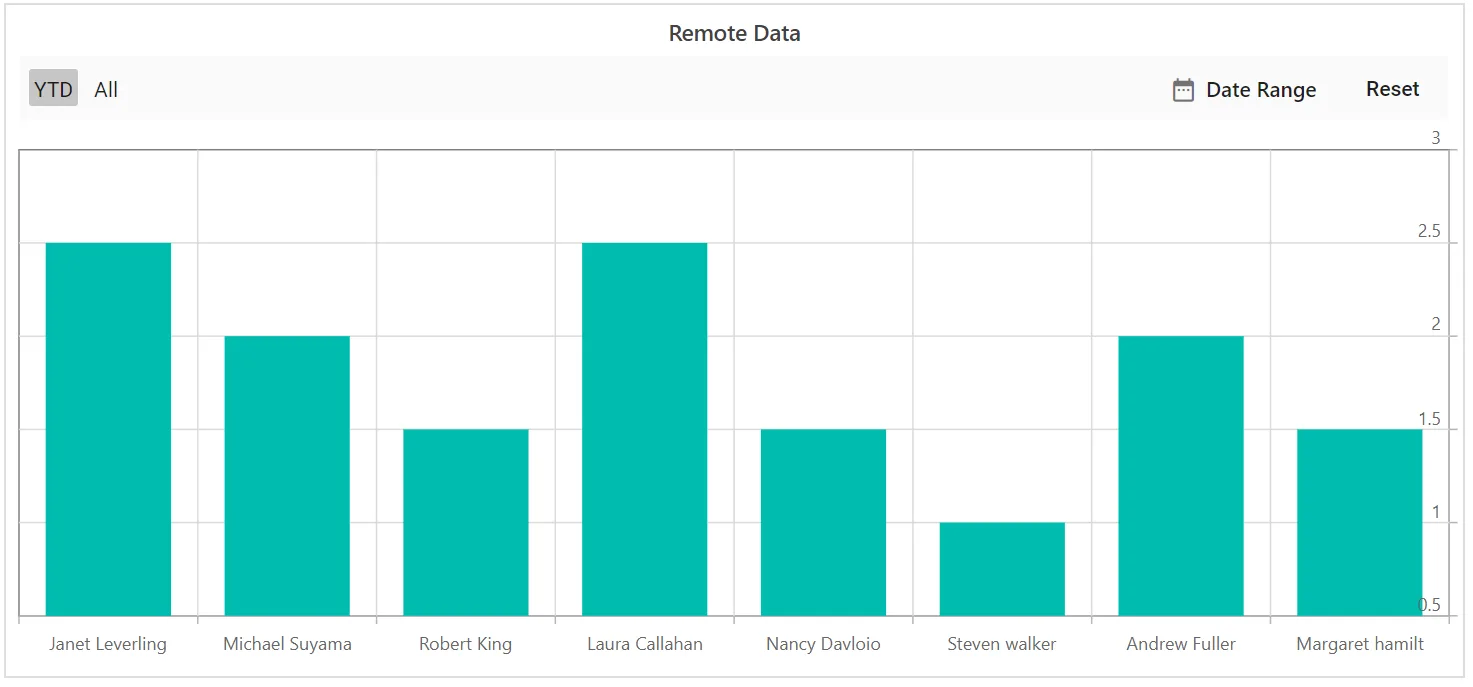
Remote Data
Binding with OData services
OData is a standardized protocol for creating and consuming data. Data can be retrieved from an OData service using SfDataManager. The following example demonstrates remote data binding using an OData service.
@using Syncfusion.Blazor.Charts
@using Syncfusion.Blazor.Data

<SfStockChart Title="Remote Data" EnableSelector="false" TrendlineType="@TrendlineType" IndicatorType="@Indicator" SeriesType="@SeriesType" ExportType="@ExportType">
    <SfDataManager Url="https://mvc.syncfusion.com/Services/Northwnd.svc/Tasks/" CrossDomain="true" Adaptor="Adaptors.ODataAdaptor"></SfDataManager>
    <StockChartPrimaryXAxis ValueType="Syncfusion.Blazor.Charts.ValueType.Category"></StockChartPrimaryXAxis>
    <StockChartPrimaryYAxis Maximum="3"></StockChartPrimaryYAxis>
    <StockChartSeriesCollection>
        <StockChartSeries XName="Assignee" YName="Estimate" Query="new ej.data.Query().take(10).where('Estimate', 'lessThan', 3, false)" Type="ChartSeriesType.Column">
        </StockChartSeries>
    </StockChartSeriesCollection>
</SfStockChart>

@code {
    public List<TrendlineTypes> TrendlineType = new List<TrendlineTypes>();
    public List<TechnicalIndicators> Indicator = new List<TechnicalIndicators>();
    public List<ChartSeriesType> SeriesType = new List<ChartSeriesType>();
    public List<ExportType> ExportType = new List<ExportType>();
}
Binding with OData v4 services
The SfDataManager can retrieve and consume OData v4 services, an upgraded version of the OData protocol. Refer to the OData documentation for additional information. To bind an OData v4 service, use ODataV4Adaptor.
@using Syncfusion.Blazor.Charts
@using Syncfusion.Blazor.Data

<SfStockChart Title="Remote Data" EnableSelector="false" TrendlineType="@TrendlineType" IndicatorType="@Indicator" SeriesType="@SeriesType" ExportType="@ExportType">
    <SfDataManager Url="https://mvc.syncfusion.com/Services/Northwnd.svc/Tasks/" CrossDomain="true" Adaptor="Adaptors.ODataV4Adaptor"></SfDataManager>
    <StockChartPrimaryXAxis ValueType="Syncfusion.Blazor.Charts.ValueType.Category"></StockChartPrimaryXAxis>
    <StockChartPrimaryYAxis Maximum="3"></StockChartPrimaryYAxis>
    <StockChartSeriesCollection>
        <StockChartSeries XName="Assignee" YName="Estimate" Query="new ej.data.Query().take(10).where('Estimate', 'lessThan', 3, false)" Type="ChartSeriesType.Column">
        </StockChartSeries>
    </StockChartSeriesCollection>
</SfStockChart>

@code {
    public List<TrendlineTypes> TrendlineType = new List<TrendlineTypes>();
    public List<TechnicalIndicators> Indicator = new List<TechnicalIndicators>();
    public List<ChartSeriesType> SeriesType = new List<ChartSeriesType>();
    public List<ExportType> ExportType = new List<ExportType>();
}
Web API
The WebApiAdaptor can be used to bind a Stock chart to a Web API created using an OData endpoint.
@using Syncfusion.Blazor.Charts
@using Syncfusion.Blazor.Data

<SfStockChart Title="Remote Data" EnableSelector="false" TrendlineType="@TrendlineType" IndicatorType="@Indicator" SeriesType="@SeriesType" ExportType="@ExportType">
    <SfDataManager Url="https://mvc.syncfusion.com/Services/Northwnd.svc/Tasks/" CrossDomain="true" Adaptor="Adaptors.WebAPIAdaptor"></SfDataManager>
    <StockChartPrimaryXAxis ValueType="Syncfusion.Blazor.Charts.ValueType.Category"></StockChartPrimaryXAxis>
    <StockChartPrimaryYAxis Maximum="3"></StockChartPrimaryYAxis>
    <StockChartSeriesCollection>
        <StockChartSeries XName="Assignee" YName="Estimate" Query="new ej.data.Query().take(10).where('Estimate', 'lessThan', 3, false)" Type="ChartSeriesType.Column">
        </StockChartSeries>
    </StockChartSeriesCollection>
</SfStockChart>

@code {
    public List<TrendlineTypes> TrendlineType = new List<TrendlineTypes>();
    public List<TechnicalIndicators> Indicator = new List<TechnicalIndicators>();
    public List<ChartSeriesType> SeriesType = new List<ChartSeriesType>();
    public List<ExportType> ExportType = new List<ExportType>();
}
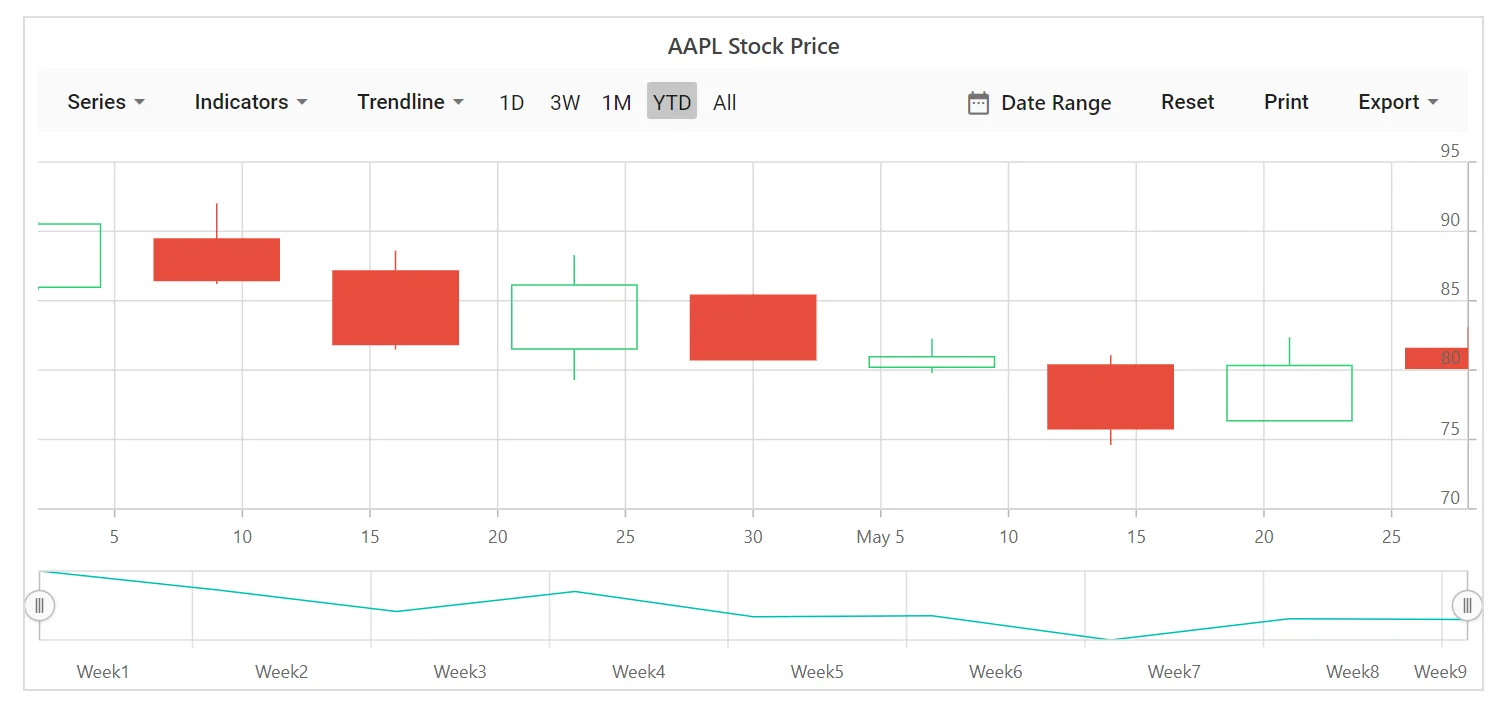
Observable collection
The ObservableCollection (dynamic data collection) provides notifications when items are added, removed, or moved. The implemented INotifyCollectionChanged interface raises notifications for dynamic changes such as add, remove, move, and clear operations.
@using Syncfusion.Blazor.Charts
@using System.Collections.ObjectModel;

<SfStockChart Title="AAPL Stock Price">
    <StockChartSeriesCollection>
        <StockChartSeries DataSource="@ChartPoints" Type="ChartSeriesType.Candle" XName="Date" High="High" Low="Low" Open="Open" Close="Close" Volume="Volume" Name="Google"></StockChartSeries>
    </StockChartSeriesCollection>
</SfStockChart>

@code {
    public ObservableCollection<ChartData> ChartPoints { get; set; }

    public DateTime[] Value = new DateTime[] { new DateTime(2006, 01, 01), new DateTime(2008, 01, 01) };

    public class ChartData
    {
        public DateTime Date { get; set; }
        public double High { get; set; }
        public double Low { get; set; }
        public double Volume { get; set; }
        public double Close { get; set; }
        public double Open { get; set; }

        public static ObservableCollection<ChartData> GetData()
        {
            ObservableCollection<ChartData> ChartPoints = new ObservableCollection<ChartData>()
            {
                new ChartData { Date = new DateTime(2012, 04, 02), Open = 85.9757, High = 90.6657, Low = 85.7685, Close = 90.5257, Volume =  660187068 },
                new ChartData { Date = new DateTime(2012, 04, 09), Open = 89.4471, High = 92.0000, Low = 86.2157, Close = 86.4614, Volume =  912634864 },
                new ChartData { Date = new DateTime(2012, 04, 16), Open = 87.1514, High = 88.6071, Low = 81.4885, Close = 81.8543, Volume = 1221746066 },
                new ChartData { Date = new DateTime(2012, 04, 23), Open = 81.5157, High = 88.2857, Low = 79.2857, Close = 86.1428, Volume =  965935749 },
                new ChartData { Date = new DateTime(2012, 04, 30), Open = 85.4000, High = 85.4857, Low = 80.7385, Close = 80.7500, Volume =  615249365 },
                new ChartData { Date = new DateTime(2012, 05, 07), Open = 80.2143, High = 82.2685, Low = 79.8185, Close = 80.9585, Volume =  541742692 },
                new ChartData { Date = new DateTime(2012, 05, 14), Open = 80.3671, High = 81.0728, Low = 74.5971, Close = 75.7685, Volume =  708126233 },
                new ChartData { Date = new DateTime(2012, 05, 21), Open = 76.3571, High = 82.3571, Low = 76.2928, Close = 80.3271, Volume =  682076215 },
                new ChartData { Date = new DateTime(2012, 05, 28), Open = 81.5571, High = 83.0714, Low = 80.0743, Close = 80.1414, Volume =  480059584 }
            };
            return ChartPoints;
        }
    }

    protected override void OnInitialized()
    {
        this.ChartPoints = ChartData.GetData();
    }
}
Entity Framework
Entity Framework acts as a modern object-database mapper for .NET. This section explains how to consume data from Microsoft SQL Server and bind it to the chart component.
Create DBContext class
Create a DBContext class named OrderContext to establish a connection to Microsoft SQL Server.
using System;
using System.Collections.Generic;
using System.Linq;
using System.Threading.Tasks;
using Microsoft.EntityFrameworkCore;
using System.ComponentModel.DataAnnotations;
using EFChart.Data;

namespace EFChart.Data
{
    public class OrderContext : DbContext
    {
        public virtual DbSet<Order> Orders { get; set; }

        protected override void OnConfiguring(DbContextOptionsBuilder optionsBuilder)
        {
            if (!optionsBuilder.IsConfigured)
            {
                // Configures the context to connect to a Microsoft SQL Serve database
                optionsBuilder.UseSqlServer(@"Data Source=(LocalDB)\MSSQLLocalDB;AttachDbFilename='D:\blazor\EFTreeMap\App_Data\NORTHWND.MDF';Integrated Security=True;Connect Timeout=30");
            }
        }
    }

    public class Order
    {
        [Key]
        public int? OrderID { get; set; }
        [Required]
        public string CustomerID { get; set; }
        [Required]
        public int EmployeeID { get; set; }
    }
}
Create data access layer to perform data operation
Create a class named OrderDataAccessLayer to act as a data access layer and retrieve records from the database table.
using Microsoft.EntityFrameworkCore;
using System;
using System.Collections.Generic;
using System.Linq;
using System.Threading.Tasks;
using static BlazorApp1.Data.OrderContext;
using EFChart.Data;

namespace EFChart.Data
{
    public class OrderDataAccessLayer
    {
        OrderContext db = new OrderContext();

        //To Get all Orders details
        public DbSet<Order> GetAllOrders()
        {
            try
            {
                return db.Orders;
            }
            catch
            {
                throw;
            }
        }
    }
}
Creating Web API Controller
Create a Web API Controller that allows the chart to consume data from Entity Framework.
using System;
using System.Collections;
using System.Collections.Generic;
using System.Linq;
using System.Threading.Tasks;
using Microsoft.AspNetCore.Http;
using Microsoft.AspNetCore.Mvc;
using Microsoft.Extensions.Primitives;
using static BlazorApp1.Data.OrderContext;
using EFChart.Data;

namespace EFChart.Controller
{
    [Route("api/[controller]")]
    [ApiController]
    public class DefaultController : ControllerBase
    {
        OrderDataAccessLayer db = new OrderDataAccessLayer();
        [HttpGet]
        public object Get()
        {
            IQueryable<Order> data = db.GetAllOrders().AsQueryable();
            var count = data.Count();
            var queryString = Request.Query;
            if (queryString.Keys.Contains("$inlinecount"))
            {
                StringValues Skip;
                StringValues Take;
                int skip = (queryString.TryGetValue("$skip", out Skip)) ? Convert.ToInt32(Skip[0]) : 0;
                int top = (queryString.TryGetValue("$top", out Take)) ? Convert.ToInt32(Take[0]) : data.Count();
                return new { Items = data.Skip(skip).Take(top), Count = count };
            }
            else
            {
                return data;
            }
        }
    }
}
Add Web API Controller services in Startup.cs
Open Startup.cs and add services and endpoints required for the Web API Controller as follows.
using EFChart.Data;
using Newtonsoft.Json.Serialization;

namespace BlazorApplication
{
    public class Startup
    {
        ....
        ....
        public void ConfigureServices(IServiceCollection services)
        {
            ....
            ....
            services.AddSingleton<OrderDataAccessLayer>();

            // Adds services for controllers to the specified Microsoft.Extensions.DependencyInjection.IServiceCollection.
            services.AddControllers().AddNewtonsoftJson(options =>
            {
                options.SerializerSettings.ContractResolver = new DefaultContractResolver();
            });
        }

        public void Configure(IApplicationBuilder app, IWebHostEnvironment env)
        {
            ....
            ....
            app.UseEndpoints(endpoints =>
            {
                // Adds endpoints for controller actions to the Microsoft.AspNetCore.Routing.IEndpointRouteBuilder
                endpoints.MapDefaultControllerRoute();
                .....
                .....
            });
        }
    }
}
Configure chart component
Configure the chart to bind data using either the DataSource property or SfDataManager.
For example, to bind data directly from the data access layer class OrderDataAccessLayer, assign the DataSource property to OrderData.GetAllOrders().
@using EFChart.Data;
@inject OrderDataAccessLayer OrderData;

@using Syncfusion.Blazor.Charts

<SfStockChart EnableSelector="false"  DataSource="@OrderData.GetAllOrders()">
    <StockChartPrimaryXAxis ValueType="Syncfusion.Blazor.Charts.ValueType.Category"></StockChartPrimaryXAxis>
    <StockChartSeriesCollection>
        <StockChartSeries Type="ChartSeriesType.Column" XName="CustomerID" YName="OrderID"></StockChartSeries>
    </StockChartSeriesCollection>
</SfStockChart>

@code {

}
To configure the chart using a Web API, provide the appropriate endpoint URL within SfDataManager along with an Adaptor. Use WebApiAdaptor to interact with a Web API and consume data from Entity Framework.
@using Syncfusion.Blazor.Charts
@using Syncfusion.Blazor.Data

<div class="control-section">
    <div>
        <SfStockChart EnableSelector="false">
        <SfDataManager Url="api/Default" Adaptor="Syncfusion.Blazor.Adaptors.WebApiAdaptor">
        </SfDataManager>
        <StockChartPrimaryXAxis ValueType="Syncfusion.Blazor.Charts.ValueType.Category"></StockChartPrimaryXAxis>
        <StockChartSeriesCollection>
            <StockChartSeries Type="ChartSeriesType.Column" XName="CustomerID" YName="OrderID"></StockChartSeries>
        </StockChartSeriesCollection>
    </SfStockChart>
    </div>
</div>

@code {

}
Handling No Data
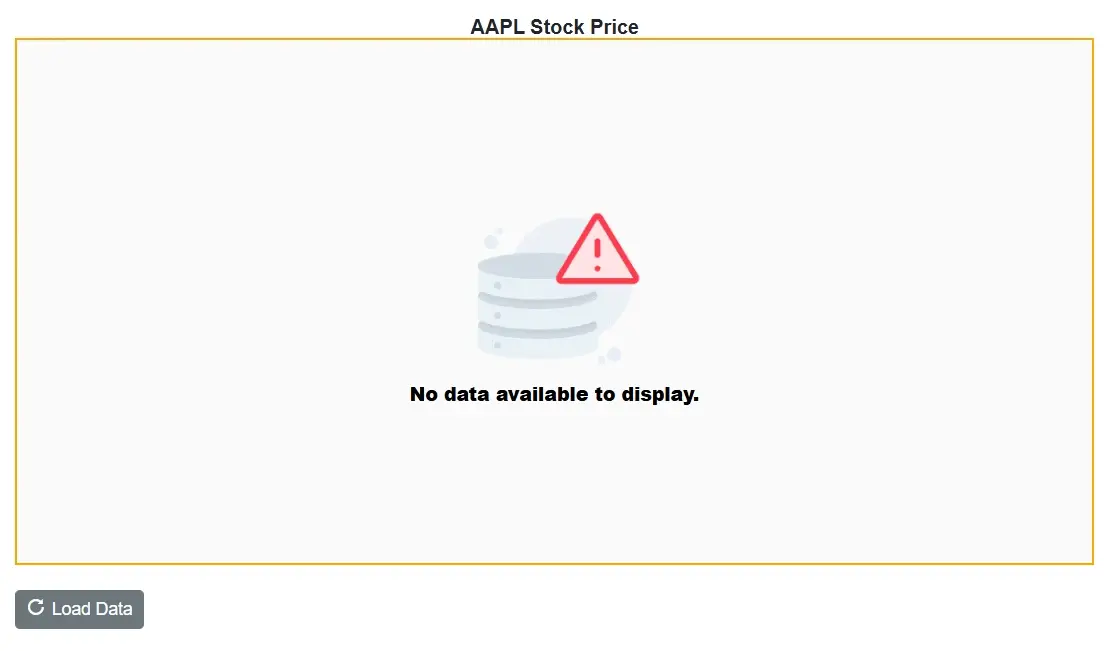
When no data is available to render in the stock chart, the NoDataTemplate property can be used to display a custom layout within the chart area. This layout may include a message indicating the absence of data, a relevant image, or a button to initiate data loading. Styled text, images, or interactive elements can be incorporated to maintain design consistency and improve guidance. Once data becomes available, the chart automatically updates to display the appropriate visualization.
@using Syncfusion.Blazor.Charts
@using Syncfusion.Blazor.Buttons

<SfStockChart @ref="stockChart" Title="AAPL Stock Price">
    <NoDataTemplate>
        <div class="noDataTemplateContainerStyle" style="border: 2px solid orange; display: row-flex; align-items: center; justify-content: center; align-content: center; white-space: normal; text-align: center; width: inherit; height: inherit; font-weight: bolder; font-size: medium;">
            <div><img src="images/common/no-data.png" alt="No Data" style="height: 150px;" /></div>
            <div style="font-size:15px;"><strong>No data available to display.</strong></div>
        </div>
    </NoDataTemplate>
    <ChildContent>
        <StockChartChartBorder Width="0"></StockChartChartBorder>
        <StockChartSeriesCollection>
            <StockChartSeries DataSource="@Visible" Type="ChartSeriesType.Candle" XName="Date" High="High" Low="Low" Open="Open" Close="Close" Volume="Volume"/>
        </StockChartSeriesCollection>
        <StockChartLegendSettings Visible="true"></StockChartLegendSettings>
    </ChildContent>
</SfStockChart>

<style>
    .noDataTemplateContainerStyle {
        background-color: #fafafa;
        color: #000000;
    }
</style>

<div style="margin-top: 20px;">
    <SfButton IconCss="e-icons e-refresh" OnClick="LoadData">Load Data</SfButton>
</div>

@code {
    private SfStockChart stockChart;

    private bool HasData { get; set; }
    public class ChartData
    {
        public DateTime Date { get; set; }
        public double Open { get; set; }
        public double Low { get; set; }
        public double Close { get; set; }
        public double High { get; set; }
        public double Volume { get; set; }
    }

    public List<ChartData> StockDetails = new()
    {
        new ChartData { Date = new DateTime(2012, 04, 02), Open = 85.9757, High = 90.6657, Low = 85.7685, Close = 90.5257, Volume = 660187068 },
        new ChartData { Date = new DateTime(2012, 04, 09), Open = 89.4471, High = 92, Low = 86.2157, Close = 86.4614, Volume = 912634864 },
        new ChartData { Date = new DateTime(2012, 04, 16), Open = 87.1514, High = 88.6071, Low = 81.4885, Close = 81.8543, Volume = 1221746066 },
        new ChartData { Date = new DateTime(2012, 04, 23), Open = 81.5157, High = 88.2857, Low = 79.2857, Close = 86.1428, Volume = 965935749 },
        new ChartData { Date = new DateTime(2012, 04, 30), Open = 85.4, High =  85.4857, Low = 80.7385, Close = 80.75, Volume = 615249365 },
        new ChartData { Date = new DateTime(2012, 05, 07), Open = 80.2143, High = 82.2685, Low = 79.8185, Close = 80.9585, Volume = 541742692 },
        new ChartData { Date = new DateTime(2012, 05, 14), Open = 80.3671, High = 81.0728, Low = 74.5971, Close = 75.7685, Volume = 708126233 },
        new ChartData { Date = new DateTime(2012, 05, 21), Open = 76.3571, High = 82.3571, Low = 76.2928, Close = 80.3271, Volume = 682076215 },
        new ChartData { Date = new DateTime(2012, 05, 28), Open = 81.5571, High = 83.0714, Low = 80.0743, Close = 80.1414, Volume = 480059584 }
    };

    private void LoadData()
    {
        ShowData = true;
        stockChart.UpdateStockChart();
    }

    private bool ShowData = false;
    private IEnumerable<ChartData> Visible => ShowData ? StockDetails : new List<ChartData>();
}