Funnel in Blazor Accumulation Chart Component
30 Jul 202612 minutes to read
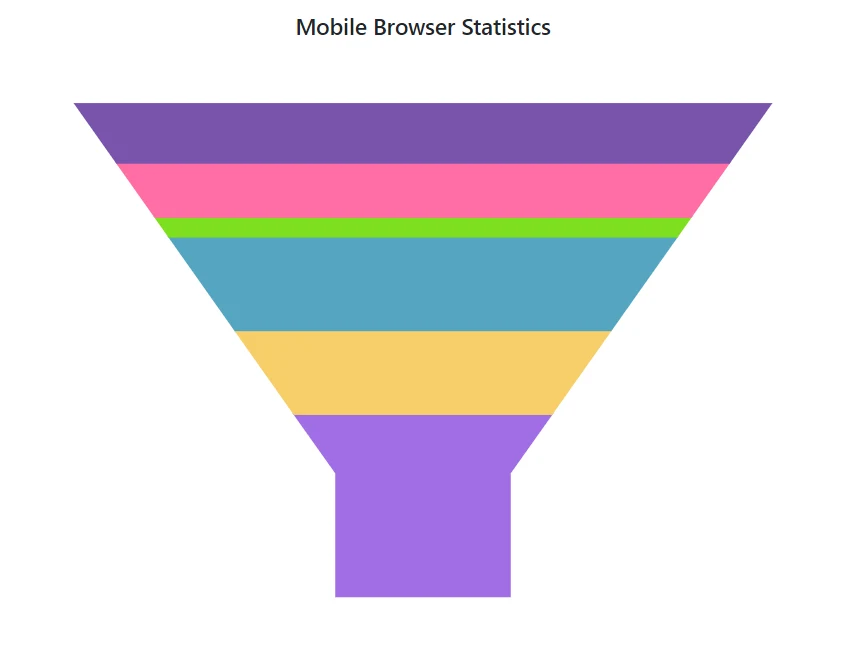
Funnel Chart is often used to represent stages in a sales process and to show the amount of potential revenue for each stage. To render the Funnel Chart, set the series Type as Funnel.
@using Syncfusion.Blazor.Charts

<SfAccumulationChart Title="Mobile Browser Statistics">
    <AccumulationChartSeriesCollection>
        <AccumulationChartSeries DataSource="@StatisticsDetails" XName="Browser" YName="Users"
                                 Name="Browser" Type="AccumulationType.Funnel">
        </AccumulationChartSeries>
    </AccumulationChartSeriesCollection>

    <AccumulationChartLegendSettings Visible="false"></AccumulationChartLegendSettings>
</SfAccumulationChart>

@code{
    public class Statistics
    {
        public string Browser { get; set; }
        public double Users { get; set; }
    }

    public List<Statistics> StatisticsDetails = new List<Statistics>
	{
       new Statistics { Browser = "Chrome", Users = 37 },
       new Statistics { Browser = "UC Browser", Users = 17 },
       new Statistics { Browser = "iPhone", Users = 19 },
       new Statistics { Browser = "Others", Users = 4  },
       new Statistics { Browser = "Opera", Users = 11 },
       new Statistics { Browser = "Android", Users = 12 },
    };
}
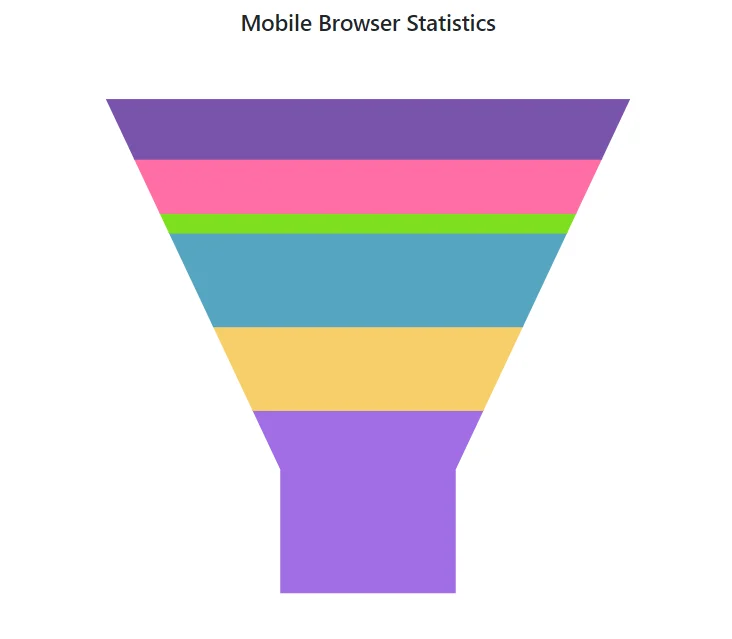
Funnel Size
The size of the funnel chart can be customized by using the Width and Height properties.
@using Syncfusion.Blazor.Charts

<SfAccumulationChart Title="Mobile Browser Statistics">
    <AccumulationChartLegendSettings Visible="false"></AccumulationChartLegendSettings>

    <AccumulationChartSeriesCollection>
        <AccumulationChartSeries DataSource="@StatisticsDetails" XName="Browser" YName="Users"
                                 Name="Browser" Type="AccumulationType.Funnel" Width="60%" Height="80%">
        </AccumulationChartSeries>
    </AccumulationChartSeriesCollection>
</SfAccumulationChart>

@code{
    public class Statistics
    {
        public string Browser { get; set; }
        public double Users { get; set; }
    }

    public List<Statistics> StatisticsDetails = new List<Statistics>
	{
       new Statistics { Browser = "Chrome", Users = 37 },
       new Statistics { Browser = "UC Browser", Users = 17 },
       new Statistics { Browser = "iPhone", Users = 19 },
       new Statistics { Browser = "Others", Users = 4  },
       new Statistics { Browser = "Opera", Users = 11 },
       new Statistics { Browser = "Android", Users = 12 },
    };
}
NOTE
The Blazor Funnel Chart example can be explored to learn to render and configure the funnel chart.
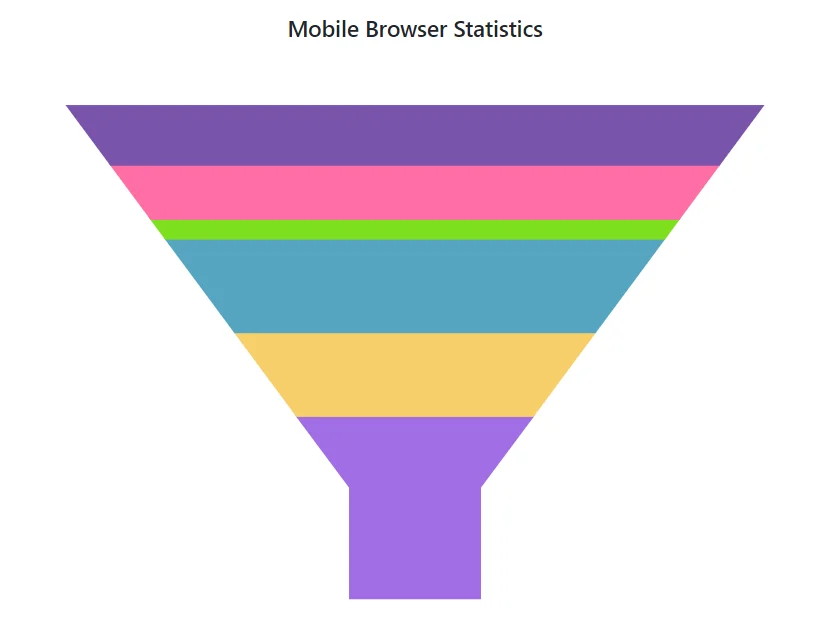
Funnel neck size
The neck size of the funnel chart can be customized by using the NeckWidth and NeckHeight properties.
@using Syncfusion.Blazor.Charts

<SfAccumulationChart Title="Mobile Browser Statistics">
    <AccumulationChartSeriesCollection>
        <AccumulationChartSeries DataSource="@StatisticsDetails" XName="Browser" YName="Users"
                                 Name="Browser" Type="AccumulationType.Funnel" NeckWidth="15%" NeckHeight="18%">
        </AccumulationChartSeries>
    </AccumulationChartSeriesCollection>

    <AccumulationChartLegendSettings Visible="false"></AccumulationChartLegendSettings>
</SfAccumulationChart>

@code{
    public class Statistics
    {
        public string Browser  { get; set; }
        public double Users { get; set; }
    }

    public List<Statistics> StatisticsDetails = new List<Statistics>
	{
       new Statistics { Browser = "Chrome", Users = 37 },
       new Statistics { Browser = "UC Browser", Users = 17 },
       new Statistics { Browser = "iPhone", Users = 19 },
       new Statistics { Browser = "Others", Users = 4  },
       new Statistics { Browser = "Opera", Users = 11 },
       new Statistics { Browser = "Android", Users = 12 },
    };
}
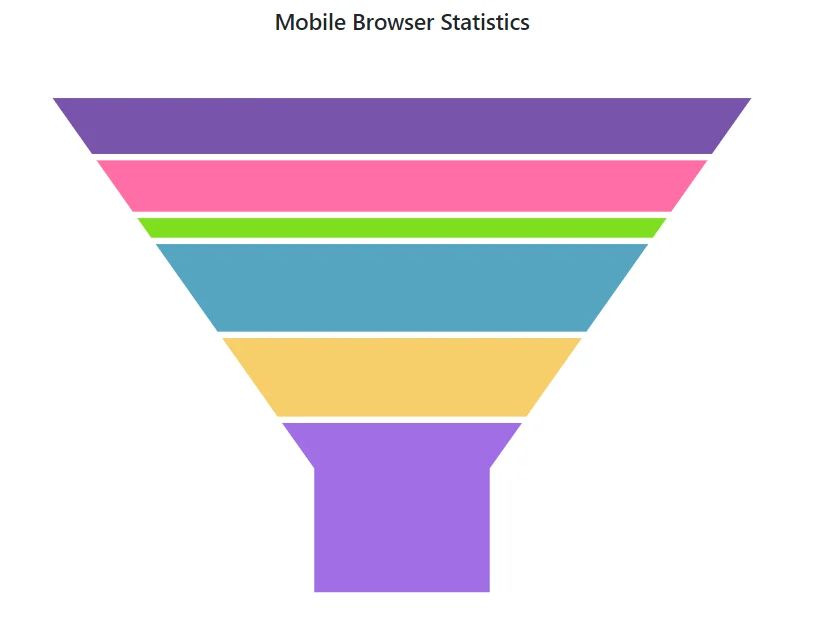
Gap between funnel segments
Funnel chart provides options to customize the space between the segments by using the GapRatio property of the series. It accepts the values ranging from 0 to 1.
@using Syncfusion.Blazor.Charts

<SfAccumulationChart Title="Mobile Browser Statistics">
    <AccumulationChartSeriesCollection>
        <AccumulationChartSeries DataSource="@StatisticsDetails" XName="Browser" YName="Users"
                                 Name="Browser" GapRatio="0.2" Type="AccumulationType.Funnel" NeckWidth="15%" NeckHeight="18%">
        </AccumulationChartSeries>
    </AccumulationChartSeriesCollection>

    <AccumulationChartLegendSettings Visible="false"></AccumulationChartLegendSettings>
</SfAccumulationChart>

@code{
    public class Statistics
    {
        public string Browser  { get; set; }
        public double Users { get; set; }
    }

    public List<Statistics> StatisticsDetails = new List<Statistics>
	{
       new Statistics { Browser = "Chrome", Users = 37 },
       new Statistics { Browser = "UC Browser", Users = 17 },
       new Statistics { Browser = "iPhone", Users = 19 },
       new Statistics { Browser = "Others", Users = 4  },
       new Statistics { Browser = "Opera", Users = 11 },
       new Statistics { Browser = "Android", Users = 12 },
    };
}
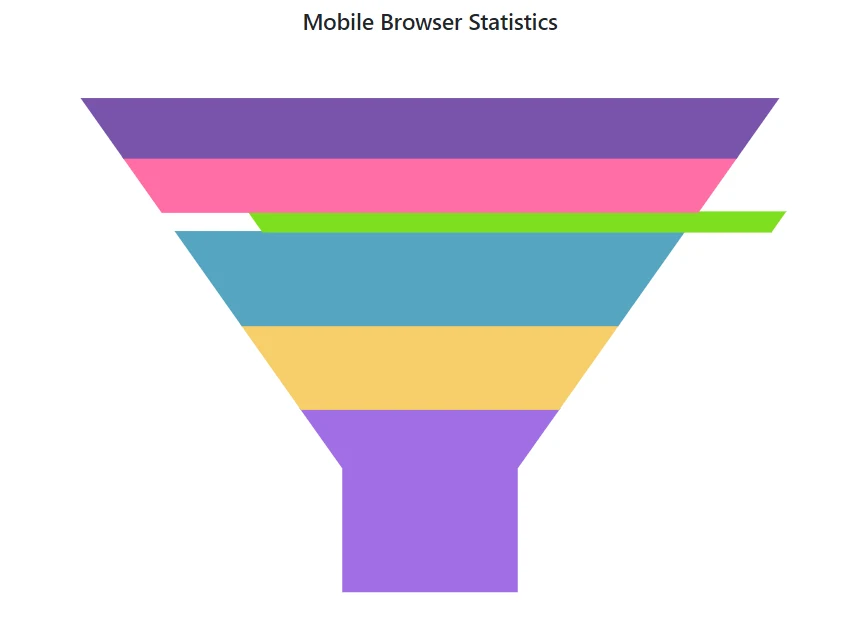
Funnel explode
Points can be exploded on mouse click by setting the Explode property to true. The point on load can be exploded using ExplodeIndex. Explode distance can be set by using ExplodeOffset property.
@using Syncfusion.Blazor.Charts

<SfAccumulationChart Title="Mobile Browser Statistics">
    <AccumulationChartSeriesCollection>
        <AccumulationChartSeries DataSource="@StatisticsDetails" XName="Browser" YName="Users"
                                 Name="Browser" Type=" AccumulationType.Funnel" ExplodeIndex="3" Explode="true" ExplodeOffset="10%">
        </AccumulationChartSeries>
    </AccumulationChartSeriesCollection>

    <AccumulationChartLegendSettings Visible="false"></AccumulationChartLegendSettings>
</SfAccumulationChart>

@code{
    public class Statistics
    {
        public string Browser { get; set; }
        public double Users { get; set; }
    }

    public List<Statistics> StatisticsDetails = new List<Statistics>
	{
       new Statistics { Browser = "Chrome", Users = 37 },
       new Statistics { Browser = "UC Browser", Users = 17 },
       new Statistics { Browser = "iPhone", Users = 19 },
       new Statistics { Browser = "Others", Users = 4  },
       new Statistics { Browser = "Opera", Users = 11 },
       new Statistics { Browser = "Android", Users = 12 },
    };
}
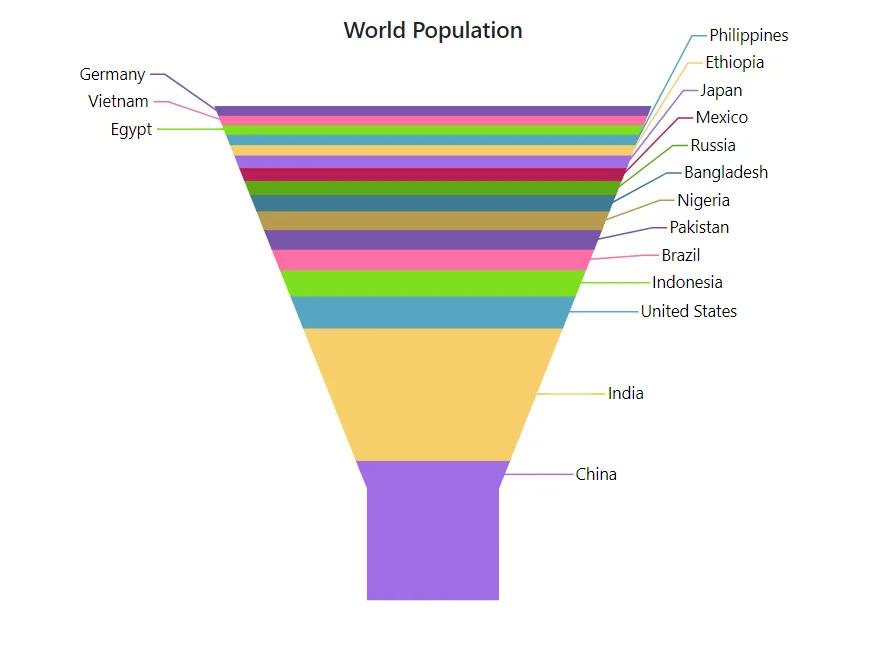
Smart Data Label
Labels will be arranged automatically on the left side of the funnel and pyramid chart when they overlap with each other.
@using Syncfusion.Blazor.Charts

<SfAccumulationChart Title="World Population" EnableAnimation="false">
    <AccumulationChartLegendSettings Visible="false"></AccumulationChartLegendSettings>

    <AccumulationChartSeriesCollection>
        <AccumulationChartSeries DataSource="@StatisticsDetails" XName="Country" YName="Users"
                                 Type="AccumulationType.Funnel" Explode="false" Width="50%" Height="80%" NeckWidth="15%" NeckHeight="18%">
            <AccumulationDataLabelSettings Visible="true" Name="Country" Position="AccumulationLabelPosition.Outside">
                <AccumulationChartConnector Length="6%"></AccumulationChartConnector>
            </AccumulationDataLabelSettings>
        </AccumulationChartSeries>
    </AccumulationChartSeriesCollection>
</SfAccumulationChart>

@code{
    public class Statistics
    {
        public string Country { get; set; }
        public double Users { get; set; }
    }

    public List<Statistics> StatisticsDetails = new List<Statistics>
	{
        new Statistics { Country = "China", Users = 1409517397 },
        new Statistics { Country = "India", Users = 1339180127 },
        new Statistics { Country = "United States", Users = 324459463 },
        new Statistics { Country = "Indonesia", Users = 263991379  },
        new Statistics { Country = "Brazil", Users = 209288278 },
        new Statistics { Country = "Pakistan", Users = 197015955 },
        new Statistics { Country = "Nigeria", Users = 190886311 },
        new Statistics { Country = "Bangladesh", Users = 164669751 },
        new Statistics { Country = "Russia", Users = 143989754 },
        new Statistics { Country = "Mexico", Users = 129163276 },
        new Statistics { Country = "Japan", Users = 127484450 },
        new Statistics { Country = "Ethiopia", Users = 104957438 },
        new Statistics { Country = "Philippines", Users = 104918090 },
        new Statistics { Country = "Egypt", Users = 97553151 },
        new Statistics { Country = "Vietnam", Users = 95540800 },
        new Statistics { Country = "Germany", Users = 82114224 },
    };
}
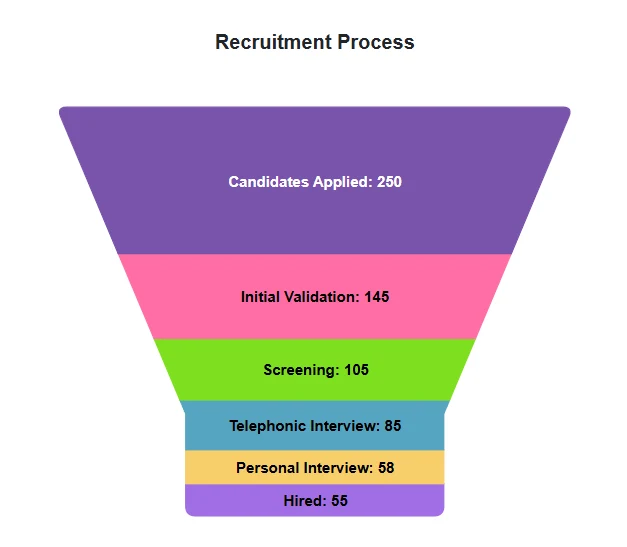
Border radius
The corners of the first data point and last data point in the funnel chart series can be rounded using the BorderRadius property within the AccumulationChartSeries.
@using Syncfusion.Blazor.Charts

 <SfAccumulationChart Title="Recruitment Process" EnableAnimation="false" >
            <AccumulationChartLegendSettings Visible="false"></AccumulationChartLegendSettings>
            <AccumulationChartSeriesCollection>
                <AccumulationChartSeries DataSource="@FunnelChartPoints" XName="InterviewProcess" YName="Candidates" BorderRadius="8"
                                         Type="AccumulationType.Funnel" Height="80%" Width="40%">
                    <AccumulationDataLabelSettings Visible="true" Name="DataLabelMappingName" Position="AccumulationLabelPosition.Inside">
                        <AccumulationChartDataLabelFont FontWeight="600"></AccumulationChartDataLabelFont>
                    </AccumulationDataLabelSettings>
                </AccumulationChartSeries>
            </AccumulationChartSeriesCollection>
 </SfAccumulationChart>

@code {
    public List<FunnelData> FunnelChartPoints { get; set; } = new List<FunnelData>
    {
        new FunnelData { InterviewProcess = "Hired", Candidates = 55, DataLabelMappingName="Hired: 55"},
        new FunnelData { InterviewProcess = "Personal Interview", Candidates = 58, DataLabelMappingName="Personal Interview: 58"},
        new FunnelData { InterviewProcess = "Telephonic Interview", Candidates = 85, DataLabelMappingName="Telephonic Interview: 85"},
        new FunnelData { InterviewProcess = "Screening", Candidates = 105, DataLabelMappingName="Screening: 105"},
        new FunnelData { InterviewProcess = "Initial Validation", Candidates = 145, DataLabelMappingName="Initial Validation: 145"},
        new FunnelData { InterviewProcess = "Candidates Applied", Candidates = 250, DataLabelMappingName="Candidates Applied: 250"},
    };

    public class FunnelData
    {
        public string InterviewProcess { get; set; }
        public double Candidates { get; set; }
        public string DataLabelMappingName { get; set; }
    }
}
NOTE
Refer to the Blazor Charts feature tour page for its groundbreaking feature representations and also explore the Blazor Accumulation Chart Example to know various features of accumulation charts and how it is used to represent numeric proportional data.