Pyramid in Blazor Accumulation Chart Component
23 Jun 20269 minutes to read
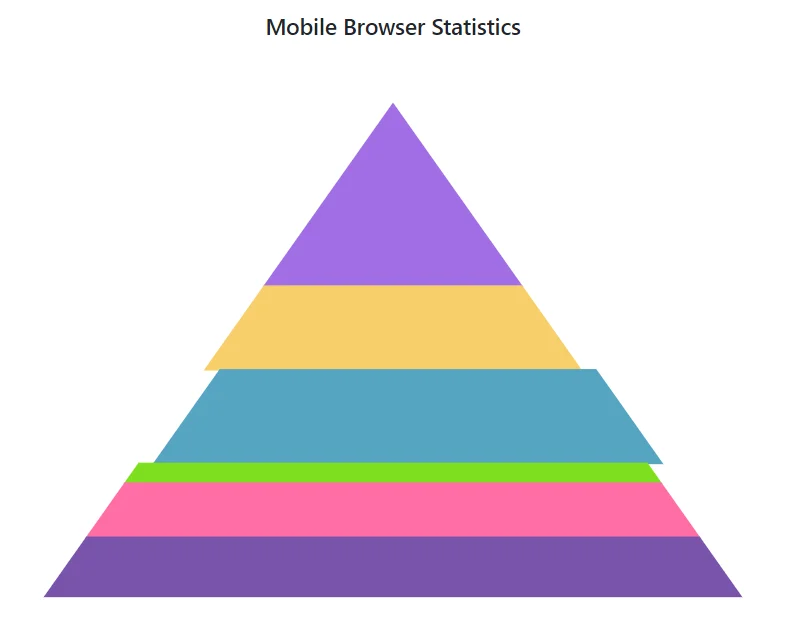
The Pyramid Chart is used to visualize the hierarchical data in upside triangle shape with horizontally divided section. To render the Pyramid Chart, set the series Type as Pyramid.
@using Syncfusion.Blazor.Charts

<SfAccumulationChart Title="Mobile Browser Statistics">
    <AccumulationChartSeriesCollection>
        <AccumulationChartSeries DataSource="@StatisticsDetails" XName="Browser" YName="Users" Name="Browser"
								 Type="AccumulationType.Pyramid">
        </AccumulationChartSeries>
    </AccumulationChartSeriesCollection>

    <AccumulationChartLegendSettings Visible="false"></AccumulationChartLegendSettings>
</SfAccumulationChart>

@code{
    public class Statistics
    {
        public string Browser { get; set; }
        public double Users { get; set; }
    }

    public List<Statistics> StatisticsDetails = new List<Statistics>
    {
        new Statistics { Browser = "Chrome", Users = 37 },
        new Statistics { Browser = "UC Browser", Users = 17 },
        new Statistics { Browser = "iPhone", Users = 19 },
        new Statistics { Browser = "Others", Users = 4 },
        new Statistics { Browser = "Opera", Users = 11 },
        new Statistics { Browser = "Android", Users = 12 },
    };
}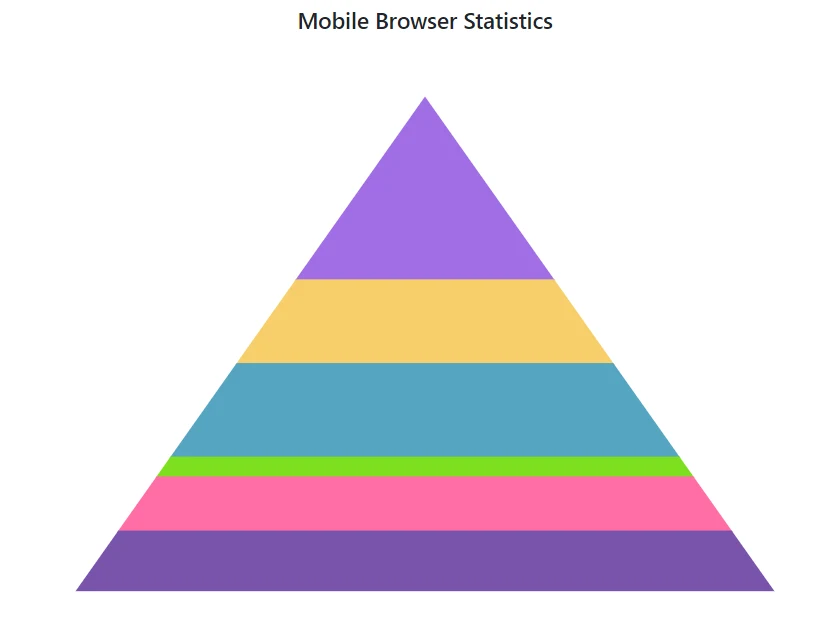
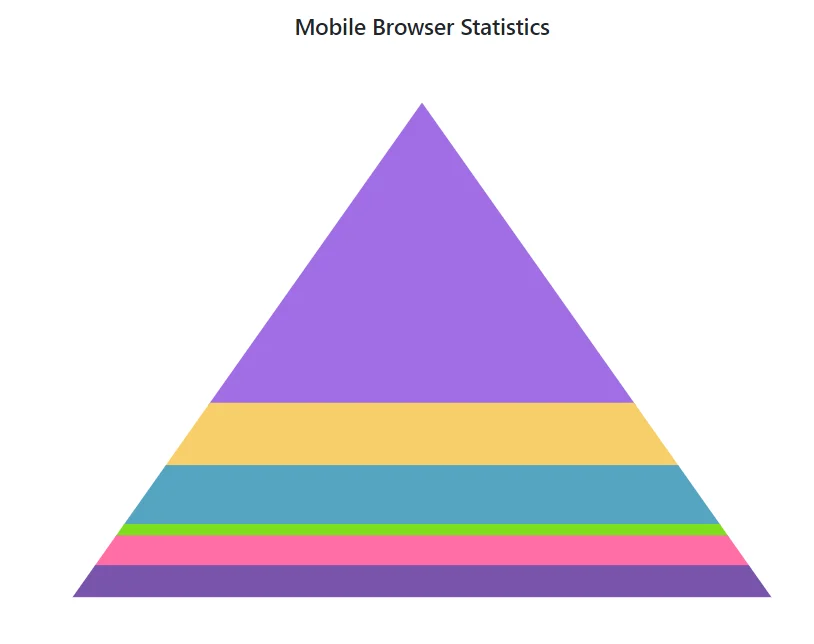
Pyramid mode
The Pyramid Chart can be rendered in both Linear or Surface modes by setting PyramidMode property. The default mode is Linear.
@using Syncfusion.Blazor.Charts

<SfAccumulationChart Title="Mobile Browser Statistics">
    <AccumulationChartSeriesCollection>
        <AccumulationChartSeries DataSource="@StatisticsDetails" XName="Browser" YName="Users" Name="Browser"
								 Type="AccumulationType.Pyramid" PyramidMode="PyramidMode.Surface">
        </AccumulationChartSeries>
    </AccumulationChartSeriesCollection>

    <AccumulationChartLegendSettings Visible="false"></AccumulationChartLegendSettings>
</SfAccumulationChart>

@code{
    public class Statistics
    {
        public string Browser { get; set; }
        public double Users { get; set; }
    }

    public List<Statistics> StatisticsDetails = new List<Statistics>
    {
        new Statistics { Browser = "Chrome", Users = 37 },
        new Statistics { Browser = "UC Browser", Users = 17 },
        new Statistics { Browser = "iPhone", Users = 19 },
        new Statistics { Browser = "Others", Users = 4 },
        new Statistics { Browser = "Opera", Users = 11 },
        new Statistics { Browser = "Android", Users = 12 },
    };
}
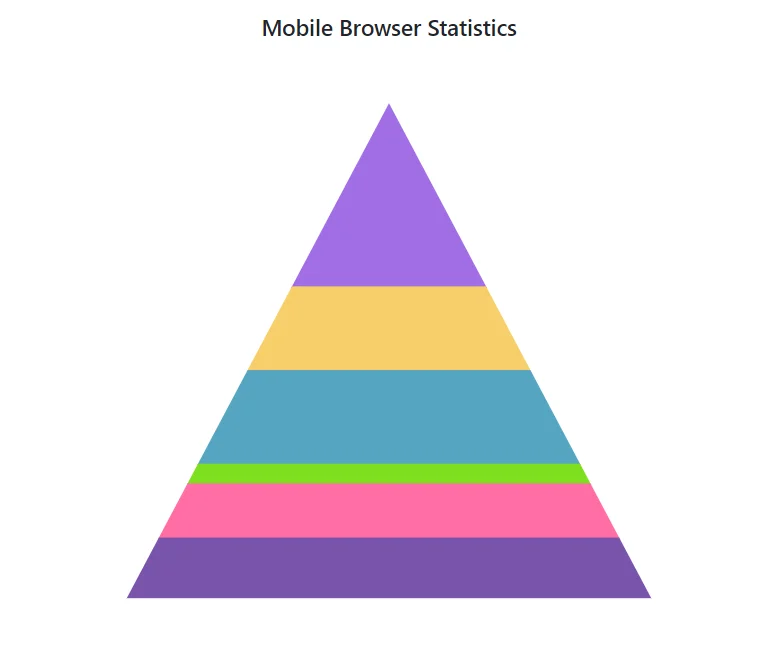
Pyramid size
The size of the pyramid chart can be customized by using the Width and Height properties.
@using Syncfusion.Blazor.Charts

<SfAccumulationChart Title="Mobile Browser Statistics">
    <AccumulationChartSeriesCollection>
        <AccumulationChartSeries DataSource="@StatisticsDetails" XName="Browser" YName="Users"
                                 Name="Browser" Type="AccumulationType.Pyramid" Width="60%" Height="80%">
        </AccumulationChartSeries>
    </AccumulationChartSeriesCollection>

    <AccumulationChartLegendSettings Visible="false"></AccumulationChartLegendSettings>
</SfAccumulationChart>

@code{
    public class Statistics
    {
        public string Browser { get; set; }
        public double Users { get; set; }
    }

    public List<Statistics> StatisticsDetails = new List<Statistics>
	{
        new Statistics { Browser = "Chrome", Users = 37 },
        new Statistics { Browser = "UC Browser", Users = 17 },
        new Statistics { Browser = "iPhone", Users = 19 },
        new Statistics { Browser = "Others", Users = 4  },
        new Statistics { Browser = "Opera", Users = 11 },
        new Statistics { Browser = "Android", Users = 12 },
    };
}
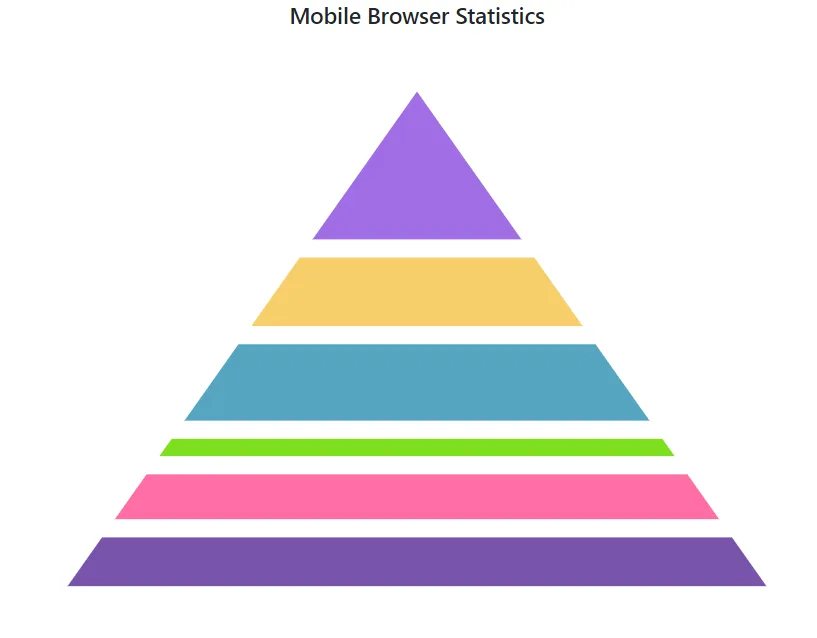
Gap between pyramid segments
The Pyramid Chart provides options to customize the space between the segments by using the GapRatio property of the series. It accepts values ranging from 0 to 1.
@using Syncfusion.Blazor.Charts

<SfAccumulationChart Title="Mobile Browser Statistics">
    <AccumulationChartSeriesCollection>
        <AccumulationChartSeries DataSource="@StatisticsDetails" XName="Browser" YName="Users" Name="Browser"
								 Type="AccumulationType.Pyramid" GapRatio="0.2">
        </AccumulationChartSeries>
    </AccumulationChartSeriesCollection>

    <AccumulationChartLegendSettings Visible="false"></AccumulationChartLegendSettings>
</SfAccumulationChart>

@code{
    public class Statistics
    {
        public string Browser { get; set; }
        public double Users { get; set; }
    }

    public List<Statistics> StatisticsDetails = new List<Statistics>
    {
        new Statistics { Browser = "Chrome", Users = 37 },
        new Statistics { Browser = "UC Browser", Users = 17 },
        new Statistics { Browser = "iPhone", Users = 19 },
        new Statistics { Browser = "Others", Users = 4 },
        new Statistics { Browser = "Opera", Users = 11 },
        new Statistics { Browser = "Android", Users = 12 },
    };
}
Pyramid explode
By setting the Explode property to true, points can be exploded on mouse click. Using the ExplodeIndex property, expand the point on load. The ExplodeOffset property can be used to set the distance between explosions.
@using Syncfusion.Blazor.Charts

<SfAccumulationChart Title="Mobile Browser Statistics">
    <AccumulationChartSeriesCollection>
        <AccumulationChartSeries DataSource="@StatisticsDetails" XName="Browser" YName="Users" Name="Browser"
                                 Type="AccumulationType.Pyramid" ExplodeIndex="2" Explode="true" ExplodeOffset="10">
        </AccumulationChartSeries>
    </AccumulationChartSeriesCollection>

    <AccumulationChartLegendSettings Visible="false"></AccumulationChartLegendSettings>
</SfAccumulationChart>

@code{
    public class Statistics
    {
        public string Browser { get; set; }
        public double Users { get; set; }
    }

    public List<Statistics> StatisticsDetails = new List<Statistics>
    {
        new Statistics { Browser = "Chrome", Users = 37 },
        new Statistics { Browser = "UC Browser", Users = 17 },
        new Statistics { Browser = "iPhone", Users = 19 },
        new Statistics { Browser = "Others", Users = 4 },
        new Statistics { Browser = "Opera", Users = 11 },
        new Statistics { Browser = "Android", Users = 12 },
    };
}
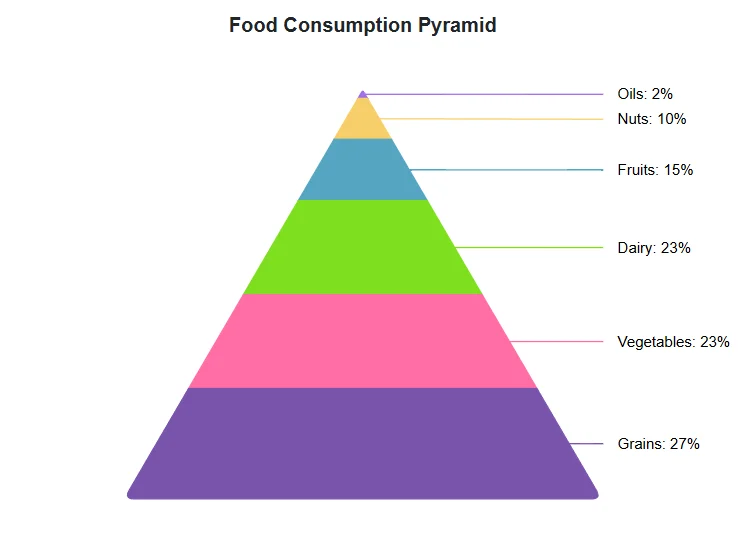
Border radius
The corners of the first data point and last data point in the pyramid chart series can be rounded using the BorderRadius property within the AccumulationChartSeries.
@using Syncfusion.Blazor.Charts

<SfAccumulationChart Title="Food Consumption Pyramid">
    <AccumulationChartLegendSettings Visible="false">
    </AccumulationChartLegendSettings>
    <AccumulationChartSeriesCollection>
        <AccumulationChartSeries DataSource="@PyramidChartPoints" XName="Foods" YName="Percentage" Type="AccumulationType.Pyramid" Width="45%" Height="80%" BorderRadius="8">
            <AccumulationDataLabelSettings Visible="true" Position="AccumulationLabelPosition.Outside" Name="DataLabelMappingName">
            </AccumulationDataLabelSettings>
        </AccumulationChartSeries>
    </AccumulationChartSeriesCollection>
</SfAccumulationChart>

@code {
    public List<PyramidData> PyramidChartPoints { get; set; } = new List<PyramidData>
    {
          new PyramidData { Foods = "Oils", Percentage = 2, DataLabelMappingName = "Oils: 2%" },
          new PyramidData { Foods = "Nuts", Percentage = 10, DataLabelMappingName = "Nuts: 10%" },
          new PyramidData { Foods = "Fruits", Percentage = 15, DataLabelMappingName = "Fruits: 15%" },
          new PyramidData { Foods = "Dairy", Percentage = 23, DataLabelMappingName = "Dairy: 23%" },
          new PyramidData { Foods = "Vegetables", Percentage = 23, DataLabelMappingName = "Vegetables: 23%" },
          new PyramidData { Foods = "Grains", Percentage = 27, DataLabelMappingName = "Grains: 27%"}
    };
    public class PyramidData
    {
        public string Foods { get; set; }
        public double Percentage { get; set; }
        public string DataLabelMappingName { get; set; }
    }
}
NOTE
Refer to our Blazor Charts feature tour page for its groundbreaking feature representations and also explore our Blazor Accumulation Chart Example to know various features of accumulation charts and how it is used to represent numeric proportional data.