Legend in Blazor Accumulation Chart Component
12 Dec 202519 minutes to read
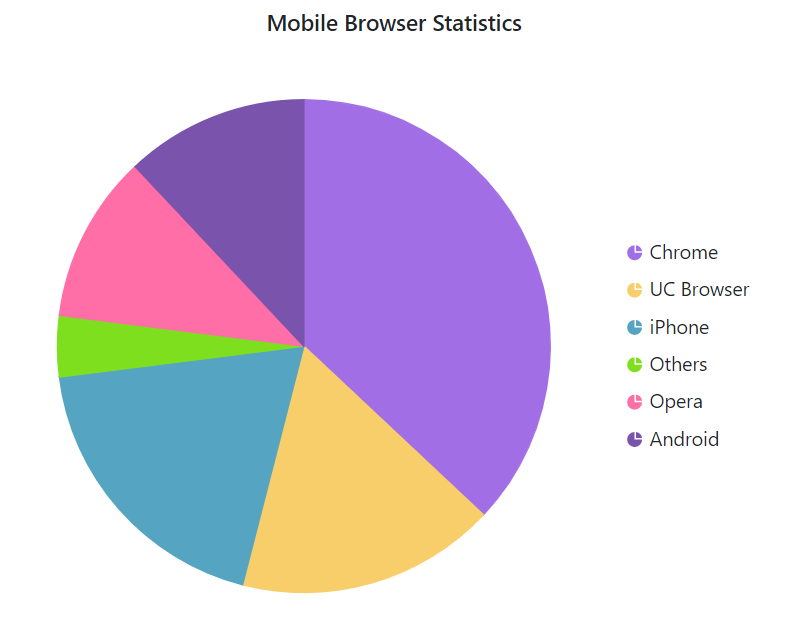
The legend is available for accumulation charts, just like it is for charts, and it provides information about the points. If the chart’s width is large, the legend will be placed on the right, and if the chart’s height is large, the legend will be placed on the bottom. The legend for a point can be collapsed by assigning an empty string to the point’s x value.
@using Syncfusion.Blazor.Charts

<SfAccumulationChart Title="Mobile Browser Statistics">
    <AccumulationChartSeriesCollection>
        <AccumulationChartSeries DataSource="@StatisticsDetails" XName="Browser" YName="Users"
                                 Name="Browser">
        </AccumulationChartSeries>
    </AccumulationChartSeriesCollection>

    <AccumulationChartLegendSettings Visible="true"></AccumulationChartLegendSettings>
</SfAccumulationChart>

@code{
    public class Statistics
    {
        public string Browser { get; set; }
        public double Users { get; set; }
    }

    public List<Statistics> StatisticsDetails = new List<Statistics>
	{
        new Statistics { Browser = "Chrome", Users = 37 },
        new Statistics { Browser = "UC Browser", Users = 17 },
        new Statistics { Browser = "iPhone", Users = 19 },
        new Statistics { Browser = "Others", Users = 4  },
        new Statistics { Browser = "Opera", Users = 11 },
        new Statistics { Browser = "Android", Users = 12 },
    };
}
Position and alignment
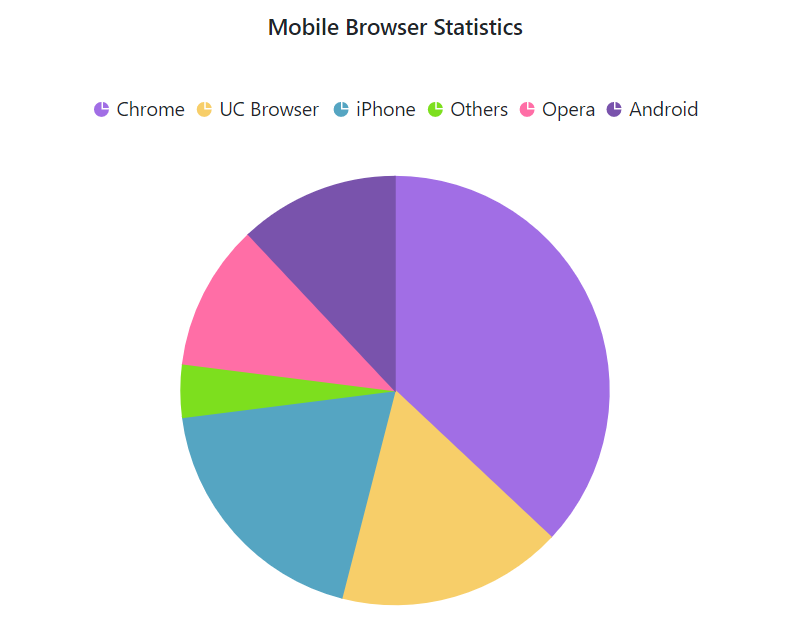
The legend can be placed at Left, Right, Top or Bottom Custom position of the chart using the Position property. The Alignment property can also be used to align the legend to the chart’s Center, Far or Near.
@using Syncfusion.Blazor.Charts

<SfAccumulationChart Title="Mobile Browser Statistics">
    <AccumulationChartSeriesCollection>
        <AccumulationChartSeries DataSource="@StatisticsDetails" XName="Browser" YName="Users"
                                 Name="Browser">
        </AccumulationChartSeries>
    </AccumulationChartSeriesCollection>

    <AccumulationChartLegendSettings Visible="true" Position="LegendPosition.Top"></AccumulationChartLegendSettings>
</SfAccumulationChart>

@code{
    public class Statistics
    {
        public string Browser { get; set; }
        public double Users { get; set; }
    }

    public List<Statistics> StatisticsDetails = new List<Statistics>
	{
        new Statistics { Browser = "Chrome", Users = 37 },
        new Statistics { Browser = "UC Browser", Users = 17 },
        new Statistics { Browser = "iPhone", Users = 19 },
        new Statistics { Browser = "Others", Users = 4  },
        new Statistics { Browser = "Opera", Users = 11 },
        new Statistics { Browser = "Android", Users = 12 },
    };
}
Legend Reverse
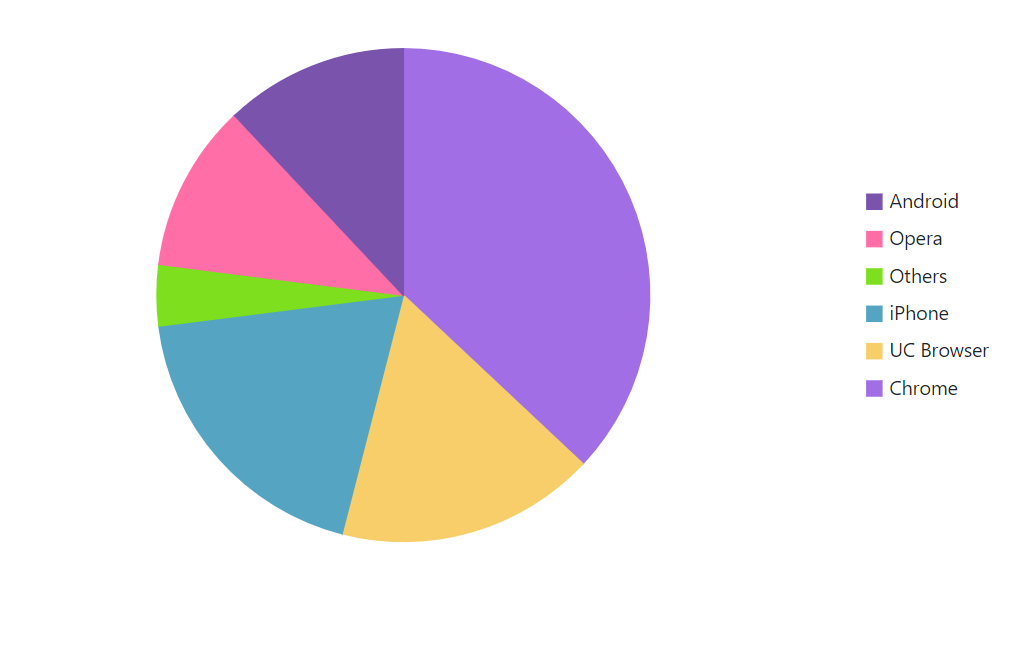
You can reverse the order of the legend items by using the Reverse property. By default, legend for the first series in the collection will be placed first.
@using Syncfusion.Blazor.Charts

<SfAccumulationChart Title="Mobile Browser Statistics">
    <AccumulationChartSeriesCollection>
        <AccumulationChartSeries LegendShape="LegendShape.Rectangle" DataSource="@StatisticsDetails" XName="Browser" YName="Users"
                                 Name="Browser">

        </AccumulationChartSeries>
    </AccumulationChartSeriesCollection>

    <AccumulationChartLegendSettings Visible="true" Reverse="true"></AccumulationChartLegendSettings>
</SfAccumulationChart>

@code{
    public class Statistics
    {
        public string Browser { get; set; }
        public double Users { get; set; }
    }

    public List<Statistics> StatisticsDetails = new List<Statistics>
	{
        new Statistics { Browser = "Chrome", Users = 37 },
        new Statistics { Browser = "UC Browser", Users = 17 },
        new Statistics { Browser = "iPhone", Users = 19 },
        new Statistics { Browser = "Others", Users = 4  },
        new Statistics { Browser = "Opera", Users = 11 },
        new Statistics { Browser = "Android", Users = 12 },
    };
}
Legend shape
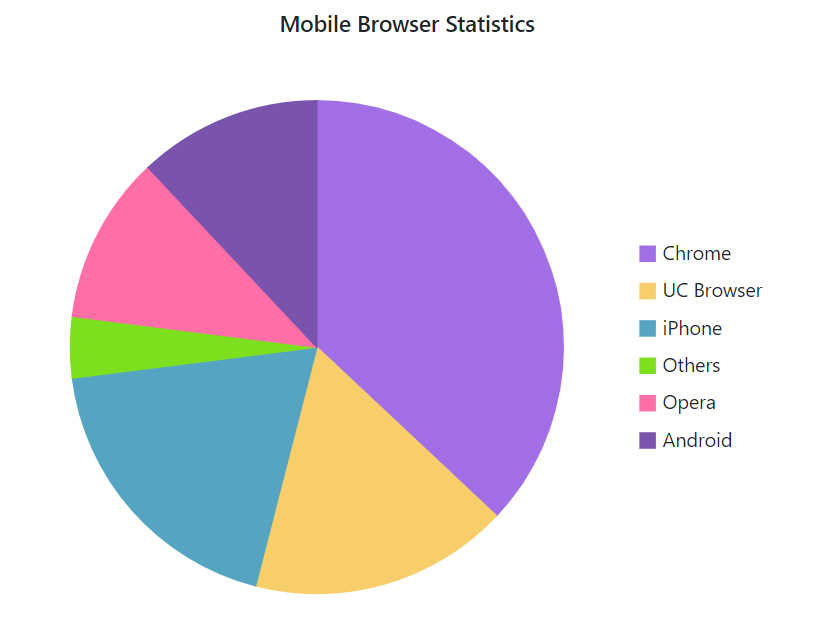
The LegendShape property in the Series can be used to change the shape of the legend icon. The default icon shape for legends is SeriesType.
@using Syncfusion.Blazor.Charts

<SfAccumulationChart Title="Mobile Browser Statistics">
    <AccumulationChartSeriesCollection>
        <AccumulationChartSeries LegendShape="LegendShape.Rectangle" DataSource="@StatisticsDetails" XName="Browser" YName="Users"
                                 Name="Browser">

        </AccumulationChartSeries>
    </AccumulationChartSeriesCollection>

    <AccumulationChartLegendSettings Visible="true"></AccumulationChartLegendSettings>
</SfAccumulationChart>

@code{
    public class Statistics
    {
        public string Browser { get; set; }
        public double Users { get; set; }
    }

    public List<Statistics> StatisticsDetails = new List<Statistics>
	{
        new Statistics { Browser = "Chrome", Users = 37 },
        new Statistics { Browser = "UC Browser", Users = 17 },
        new Statistics { Browser = "iPhone", Users = 19 },
        new Statistics { Browser = "Others", Users = 4  },
        new Statistics { Browser = "Opera", Users = 11 },
        new Statistics { Browser = "Android", Users = 12 },
    };
}
Legend size
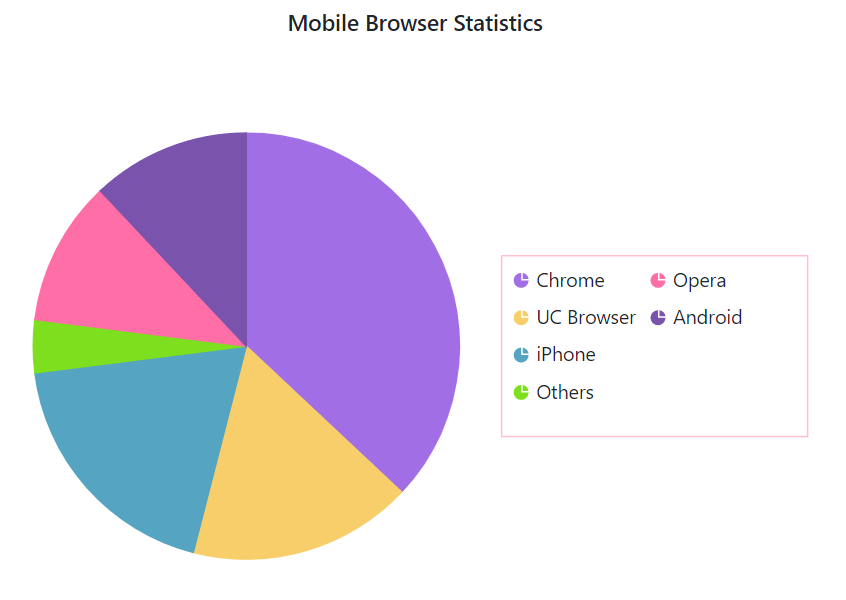
The legend size can be customized by using the Width and Height properties of the AccumulationChartLegendSettings.
@using Syncfusion.Blazor.Charts

<SfAccumulationChart Title="Mobile Browser Statistics">
    <AccumulationChartSeriesCollection>
        <AccumulationChartSeries DataSource="@StatisticsDetails" XName="Browser" YName="Users"
                                 Name="Browser">
        </AccumulationChartSeries>
    </AccumulationChartSeriesCollection>

    <AccumulationChartLegendSettings Visible="true" Height="28%" Width="44%">
        <AccumulationChartLegendBorder Color="Pink" Width="1"></AccumulationChartLegendBorder>
    </AccumulationChartLegendSettings>
</SfAccumulationChart>

@code{
    public class Statistics
    {
        public string Browser { get; set; }
        public double Users { get; set; }
    }

    public List<Statistics> StatisticsDetails = new List<Statistics>
	{
        new Statistics { Browser = "Chrome", Users = 37 },
        new Statistics { Browser = "UC Browser", Users = 17 },
        new Statistics { Browser = "iPhone", Users = 19 },
        new Statistics { Browser = "Others", Users = 4  },
        new Statistics { Browser = "Opera", Users = 11 },
        new Statistics { Browser = "Android", Users = 12 },
    };
}
Legend shape size
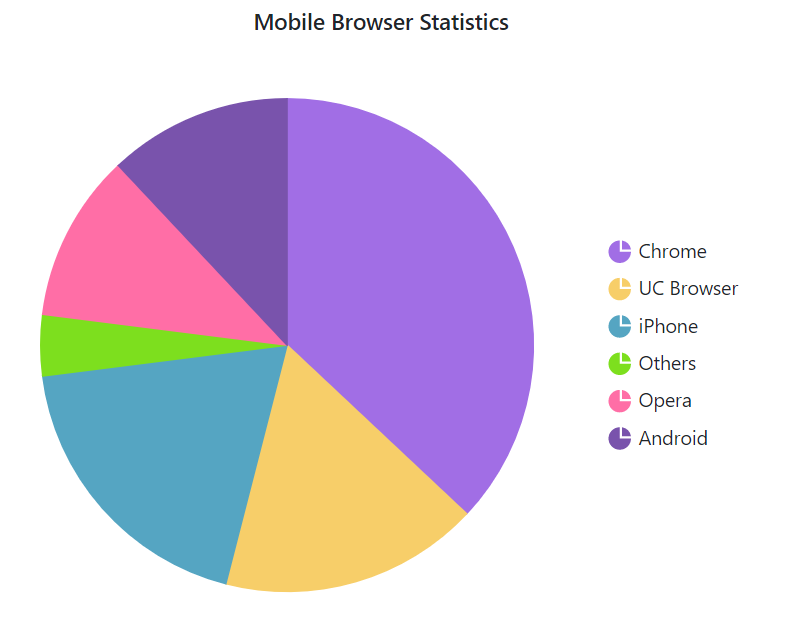
The ShapeHeight and ShapeWidth properties can be used to adjust the dimensions of the legend shape.
@using Syncfusion.Blazor.Charts

<SfAccumulationChart Title="Mobile Browser Statistics">
    <AccumulationChartSeriesCollection>
        <AccumulationChartSeries DataSource="@StatisticsDetails" XName="Browser" YName="Users"
                                 Name="Browser">
        </AccumulationChartSeries>
    </AccumulationChartSeriesCollection>

    <AccumulationChartLegendSettings Visible="true" ShapeHeight="15" ShapeWidth="15">
    </AccumulationChartLegendSettings>
</SfAccumulationChart>

@code{
    public class Statistics
    {
        public string Browser { get; set; }
        public double Users { get; set; }
    }

    public List<Statistics> StatisticsDetails = new List<Statistics>
	{
        new Statistics { Browser = "Chrome", Users = 37 },
        new Statistics { Browser = "UC Browser", Users = 17 },
        new Statistics { Browser = "iPhone", Users = 19 },
        new Statistics { Browser = "Others", Users = 4  },
        new Statistics { Browser = "Opera", Users = 11 },
        new Statistics { Browser = "Android", Users = 12 },
    };
}
Paging for Legend
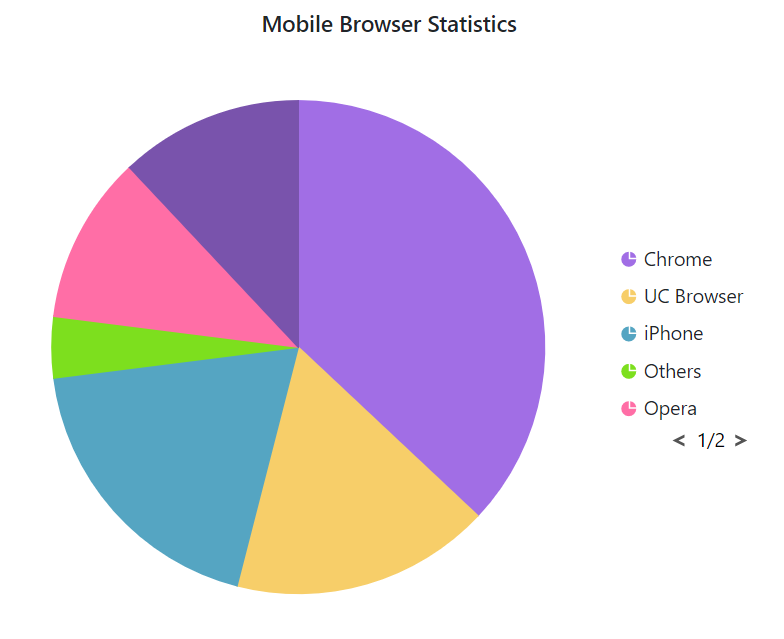
When the legend items exceed legend bounds, paging will be enabled by default. End user can view each legend item using the navigation buttons to navigate between pages.
@using Syncfusion.Blazor.Charts

<SfAccumulationChart Title="Mobile Browser Statistics">
    <AccumulationChartSeriesCollection>
        <AccumulationChartSeries DataSource="@StatisticsDetails" XName="Browser" YName="Users"
                                 Name="Browser">
        </AccumulationChartSeries>
    </AccumulationChartSeriesCollection>

    <AccumulationChartLegendSettings Visible="true" Height="150" Width="100">
    </AccumulationChartLegendSettings>
</SfAccumulationChart>

@code{
    public class Statistics
    {
        public string Browser{ get; set; }
        public double Users { get; set; }
    }

    public List<Statistics> StatisticsDetails = new List<Statistics>
	{
        new Statistics { Browser = "Chrome", Users = 37 },
        new Statistics { Browser = "UC Browser", Users = 17 },
        new Statistics { Browser = "iPhone", Users = 19 },
        new Statistics { Browser = "Others", Users = 4  },
        new Statistics { Browser = "Opera", Users = 11 },
        new Statistics { Browser = "Android", Users = 12 },
    };
}
Paging customization
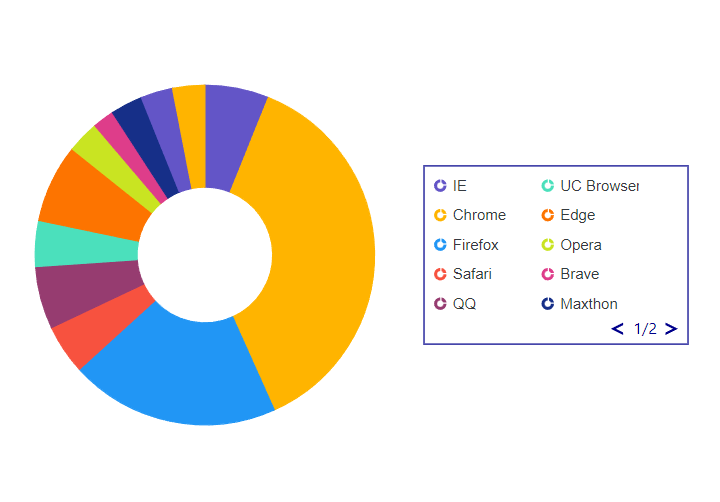
In legend pager, the arrow elements can be customized by using the ArrowSize property in the AccumulationChartLegendPageSettings and the page numbers can be customized by using the AccumulationChartLegendPageSettingsTextStyle.
@using Syncfusion.Blazor.Charts

<SfAccumulationChart ID="chart" Width="640px" Height="475px" Theme="@Theme">
    <AccumulationChartLegendSettings ToggleVisibility=false TextWrap="@Syncfusion.Blazor.TextWrap.Wrap" MaximumLabelWidth="80" Position="@position" Height="@Height" Width="@Width">
        <AccumulationChartLegendPageSettings ArrowSize="10">
            <AccumulationChartLegendPageSettingsTextStyle Color="blue">
            </AccumulationChartLegendPageSettingsTextStyle>
        </AccumulationChartLegendPageSettings>
        <AccumulationChartLegendBorder Color="darkblue" Width="1"></AccumulationChartLegendBorder>
        <AccumulationChartLegendFont Size="12px"></AccumulationChartLegendFont>
    </AccumulationChartLegendSettings>
    <AccumulationChartSeriesCollection>
        <AccumulationChartSeries DataSource="@PieChartPoints" XName="ExpenseCategory" YName="ExpensePercentage" Radius="70%" Name="Revenue" InnerRadius="40%">
        </AccumulationChartSeries>
    </AccumulationChartSeriesCollection>
</SfAccumulationChart>

@code {
    private Theme Theme { get; set; } = Theme.Fluent2;
    public string Height { get; set; } = "30%";
    public string Width { get; set; } = "33%";
    public Syncfusion.Blazor.Charts.LegendPosition position { get; set; } = Syncfusion.Blazor.Charts.LegendPosition.Right;
    public double MaxLabel { get; set; } = 100;

    public List<PieData> PieChartPoints { get; set; } = new List<PieData>
    {
         new PieData { ExpenseCategory =  "IE", ExpensePercentage = 6.12, DataLabelMappingName = "6.12%" },
         new PieData { ExpenseCategory =  "Chrome", ExpensePercentage = 37.28, DataLabelMappingName = "57.28%" },
         new PieData { ExpenseCategory =  "Firefox", ExpensePercentage = 20, DataLabelMappingName = "57.28%" },
         new PieData { ExpenseCategory =  "Safari", ExpensePercentage = 4.73, DataLabelMappingName = "4.73%" },
         new PieData { ExpenseCategory =  "QQ", ExpensePercentage = 5.96, DataLabelMappingName = "5.96%" },
         new PieData { ExpenseCategory =  "UC Browser", ExpensePercentage = 4.37, DataLabelMappingName = "4.37%" },
         new PieData { ExpenseCategory =  "Edge", ExpensePercentage = 7.48, DataLabelMappingName = "7.48%" },
         new PieData { ExpenseCategory =  "Opera", ExpensePercentage = 3.06, DataLabelMappingName = "14.06%" },
         new PieData { ExpenseCategory =  "Brave", ExpensePercentage = 2.06, DataLabelMappingName = "14.06%" },
         new PieData { ExpenseCategory =  "Maxthon", ExpensePercentage = 3.06, DataLabelMappingName = "14.06%" },
         new PieData { ExpenseCategory =  "UC", ExpensePercentage = 3.06, DataLabelMappingName = "14.06%" },
         new PieData { ExpenseCategory =  "Falkon", ExpensePercentage = 3.06, DataLabelMappingName = "14.06%" },
    };

    public class PieData
    {
        public string ExpenseCategory { get; set; }
        public double ExpensePercentage { get; set; }
        public string DataLabelMappingName { get; set; }
    }
}
Legend text wrap
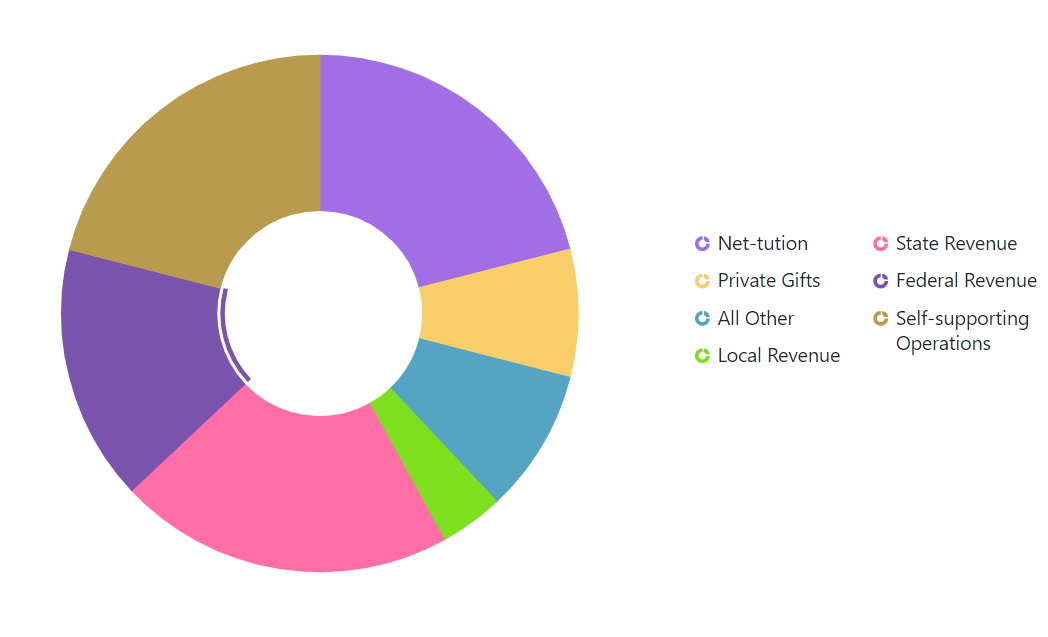
When the legend text exceeds the container, the text can be wrapped by using TextWrap Property. End user can also wrap the legend text based on the MaximumLabelWidth property.
@using Syncfusion.Blazor.Charts

<SfAccumulationChart>
        <AccumulationChartLegendSettings Position="LegendPosition.Right" TextWrap="@TextWrap.Wrap" MaximumLabelWidth="100" Height="28%" Width="36%"></AccumulationChartLegendSettings>
        <AccumulationChartSeriesCollection>
            <AccumulationChartSeries DataSource="@PieChartPoints" XName="ExpenseCategory" YName="ExpensePercentage" Name="Revenue" InnerRadius="40%">
            </AccumulationChartSeries>
        </AccumulationChartSeriesCollection>
    </SfAccumulationChart>

@code{
   public List<PieData> PieChartPoints { get; set; } = new List<PieData>
    {
         new PieData { ExpenseCategory =  "Net-tution", ExpensePercentage = 21, DataLabelMappingName = "21%" },
         new PieData { ExpenseCategory =  "Private Gifts", ExpensePercentage = 8, DataLabelMappingName = "8%" },
         new PieData { ExpenseCategory =  "All Other", ExpensePercentage = 9, DataLabelMappingName = "9%" },
         new PieData { ExpenseCategory =  "Local Revenue", ExpensePercentage = 4, DataLabelMappingName = "4%" },
         new PieData { ExpenseCategory =  "State Revenue", ExpensePercentage = 21, DataLabelMappingName = "21%" },
         new PieData { ExpenseCategory =  "Federal Revenue", ExpensePercentage = 16, DataLabelMappingName = "16%" },
         new PieData { ExpenseCategory =  "Self-supporting Operations", ExpensePercentage = 21, DataLabelMappingName = "21%" },
    };
    public class PieData
    {
        public string ExpenseCategory { get; set; }
        public double ExpensePercentage { get; set; }
        public string DataLabelMappingName { get; set; }
    }
}
Legend Template
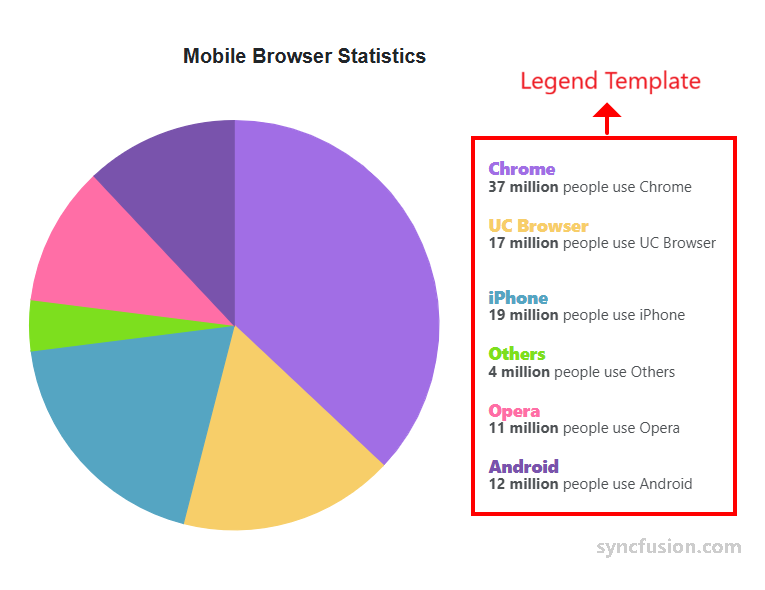
Legend templates allow you to replace default legend icons and text with custom HTML or Blazor markup for each series. This enables branded styles, richer content (icons, multi-line text, badges), improved readability, and localization.
To use, add a LegendItemTemplate inside any AccumulationChartSeries you want to customize. The rendered content becomes the legend item and can be styled with CSS. Legend interactions (click to toggle series) remain unless ToggleVisibility is set to false. Templates work with all legend positions, alignments, and paging.
Text : Gets or sets the text to render for the current legend item in the template. Defaults to the value from the field mapped by AccumulationChartSeries.XName.
Data : Gets the data item from AccumulationChartSeries.DataSource bound to the current legend item. Use this to access additional fields (for example, images, badges, or localized text) inside the template.
@using Syncfusion.Blazor.Charts

@* Initialize the accumulation chart component and configure its essential features *@
<SfAccumulationChart Title="Mobile Browser Statistics">

    @* Display the legend and allow toggling visibility on interaction *@
    <AccumulationChartLegendSettings Visible="true" >
    </AccumulationChartLegendSettings>

    <AccumulationChartSeriesCollection>
        @* Define a pie series with X and Y mappings and color mapping *@
        <AccumulationChartSeries DataSource="@StatisticsDetails" XName="Browser" YName="Users" Name="Browser" PointColorMapping="Color">
            @* Render a custom legend item using the template context *@
            <LegendItemTemplate>
                @{
                    var info = context as AccumulationChartLegendInfo;
                    var browser = info?.Data?["Browser"]?.ToString() ?? "";
                    var users = info?.Data?["Users"] is null ? 0 : Convert.ToDouble(info.Data["Users"]);
                }
                <div style="display:flex; align-items:center; gap:8px; padding:4px 0;">
                    <div style="display:flex; flex-direction:column; line-height:1.1;">
                        <span style="font-weight:800; font-size:14px; color: @info.Data["Color"]">@browser</span>
                        <span style="font-size:12px; opacity:0.8;"><b>@users million</b> people use @browser</span>
                    </div>
                </div>
            </LegendItemTemplate>
        </AccumulationChartSeries>
    </AccumulationChartSeriesCollection>

</SfAccumulationChart>

@code {
    public class Statistics
    {
        public string Browser { get; set; }
        public double Users { get; set; }
        public string Color { get; set; }
    }

    public List<Statistics> StatisticsDetails = new()
    {
    new Statistics { Browser = "Chrome", Users = 37, Color = "#a16ee5" },
    new Statistics { Browser = "UC Browser", Users = 17, Color = "#f7ce69" },
    new Statistics { Browser = "iPhone", Users = 19, Color = "#55a5c2" },
    new Statistics { Browser = "Others", Users = 4,  Color = "#7ddf1e" },
    new Statistics { Browser = "Opera", Users = 11, Color = "#ff6ea6" },
    new Statistics { Browser = "Android", Users = 12, Color = "#7953ac" },
    };

}
NOTE
Refer to the Blazor Charts feature tour page for its groundbreaking feature representations and also explore the Blazor Accumulation Chart Example to know about the various features of accumulation charts and how it is used to represent numeric proportional data.