Tooltip in Blazor Accumulation Chart Component
23 Jun 20269 minutes to read
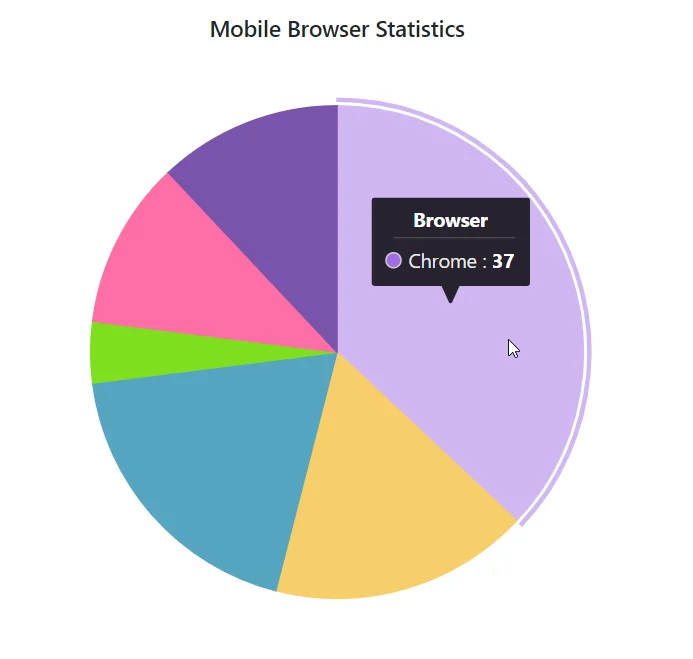
The Enable property in AccumulationChartTooltipSettings can be set to true to enable the tooltip.
@using Syncfusion.Blazor.Charts

<SfAccumulationChart Title="Mobile Browser Statistics">
    <AccumulationChartSeriesCollection>
        <AccumulationChartSeries DataSource="@StatisticsDetails" XName="Browser" YName="Users"
                                 Name="Browser">
        </AccumulationChartSeries>
    </AccumulationChartSeriesCollection>

    <AccumulationChartLegendSettings Visible="false"></AccumulationChartLegendSettings>

    <AccumulationChartTooltipSettings Enable="true"></AccumulationChartTooltipSettings>
</SfAccumulationChart>

@code{
    public class Statistics
    {
        public string Browser { get; set; }
        public double Users { get; set; }
    }

    public List<Statistics> StatisticsDetails = new List<Statistics>
	{
        new Statistics { Browser = "Chrome", Users = 37 },
        new Statistics { Browser = "UC Browser", Users = 17 },
        new Statistics { Browser = "iPhone", Users = 19 },
        new Statistics { Browser = "Others", Users = 4  },
        new Statistics { Browser = "Opera", Users = 11 },
        new Statistics { Browser = "Android", Users = 12 },
    };
}
Header
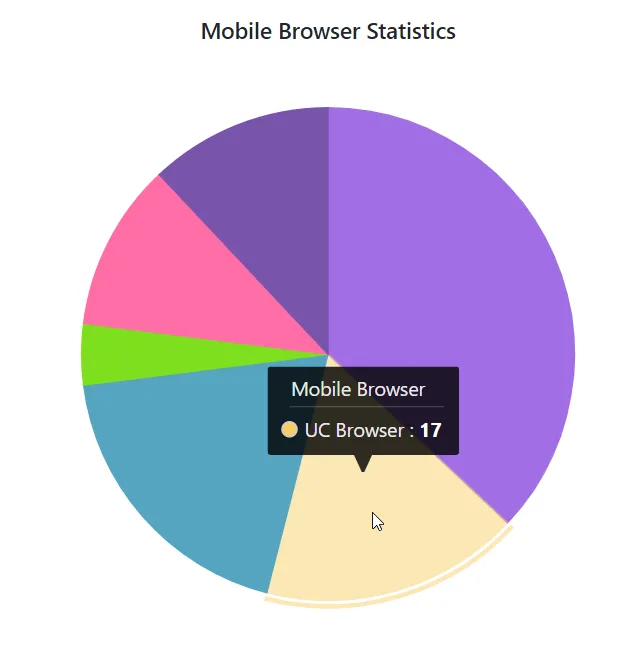
The Header property in AccumulationChartTooltipSettings can be used to specify the tooltip’s header.
@using Syncfusion.Blazor.Charts

<SfAccumulationChart Title="Mobile Browser Statistics">
    <AccumulationChartSeriesCollection>
        <AccumulationChartSeries DataSource="@StatisticsDetails" XName="Browser" YName="Users"
                                 Name="Browser">
        </AccumulationChartSeries>
    </AccumulationChartSeriesCollection>

    <AccumulationChartLegendSettings Visible="false"></AccumulationChartLegendSettings>

    <AccumulationChartTooltipSettings Enable="true" Header="Mobile Browser"></AccumulationChartTooltipSettings>
</SfAccumulationChart>

@code{
    public class Statistics
    {
        public string Browser { get; set; }
        public double Users { get; set; }

    }

    public List<Statistics> StatisticsDetails = new List<Statistics>
	{
        new Statistics { Browser = "Chrome", Users = 37 },
        new Statistics { Browser = "UC Browser", Users = 17 },
        new Statistics { Browser = "iPhone", Users = 19 },
        new Statistics { Browser = "Others", Users = 4  },
        new Statistics { Browser = "Opera", Users = 11 },
        new Statistics { Browser = "Android", Users = 12 },
    };
}
Tooltip format
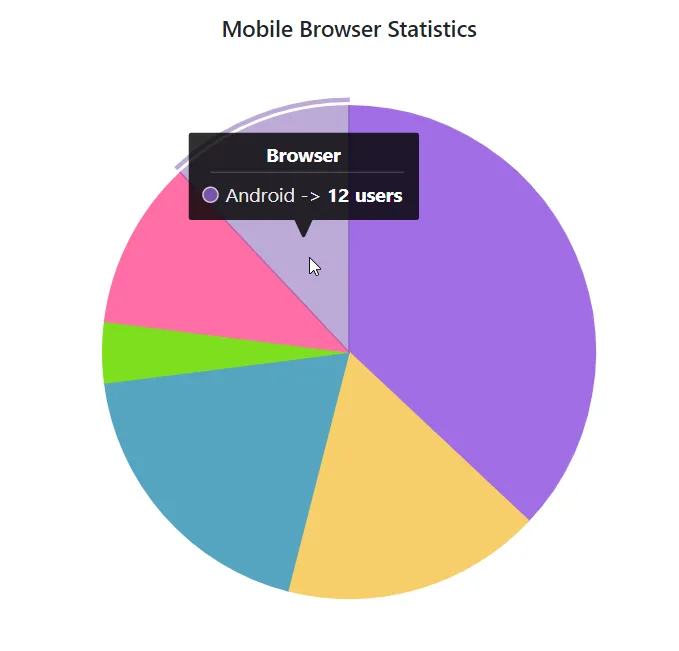
By default, tooltip shows information about x and y value in points. In addition, further customization can be done in the tooltip. For example, the format ${point.x} : <b>${point.y}%</b> shows point x value and customized point y value.
@using Syncfusion.Blazor.Charts

<SfAccumulationChart Title="Mobile Browser Statistics">
    <AccumulationChartSeriesCollection>
        <AccumulationChartSeries DataSource="@StatisticsDetails" XName="Browser" YName="Users"
                                 Name="Browser">
        </AccumulationChartSeries>
    </AccumulationChartSeriesCollection>

    <AccumulationChartLegendSettings Visible="false"></AccumulationChartLegendSettings>

    <AccumulationChartTooltipSettings Enable="true" Format="${point.x} -> <b>${point.y} users</b>"></AccumulationChartTooltipSettings>
</SfAccumulationChart>

@code{
    public class Statistics
    {
        public string Browser { get; set; }
        public double Users { get; set; }

    }

    public List<Statistics> StatisticsDetails = new List<Statistics>
    {
        new Statistics { Browser = "Chrome", Users = 37 },
        new Statistics { Browser = "UC Browser", Users = 17 },
        new Statistics { Browser = "iPhone", Users = 19 },
        new Statistics { Browser = "Others", Users = 4  },
        new Statistics { Browser = "Opera", Users = 11 },
        new Statistics { Browser = "Android", Users = 12 },
    };
}
Tooltip customization
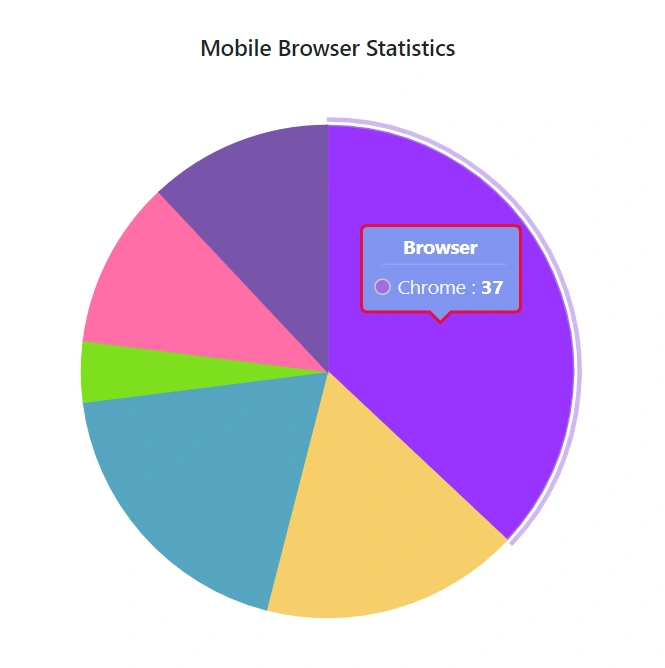
The Fill and AccumulationChartTooltipBorder are used to customize the background color and the border of the tooltip respectively. The AccumulationChartTooltipTextStyle in the tooltip is used to customize the font size of the tooltip text. The HighlightColor property can be used to change the color of the data point when hovering.
@using Syncfusion.Blazor.Charts

<SfAccumulationChart Title="Mobile Browser Statistics" HighlightColor="#9933ff">
    <AccumulationChartSeriesCollection>
        <AccumulationChartSeries DataSource="@StatisticsDetails" XName="Browser" YName="Users"
                                 Name="Browser">
        </AccumulationChartSeries>
    </AccumulationChartSeriesCollection>

    <AccumulationChartLegendSettings Visible="false"></AccumulationChartLegendSettings>

    <AccumulationChartTooltipSettings Enable="true" Format="${point.x} : <b>${point.y}</b>" Fill="#7bb4eb">
        <AccumulationChartTooltipBorder Color="red" Width="2"></AccumulationChartTooltipBorder>
    </AccumulationChartTooltipSettings>
</SfAccumulationChart>

@code{
    public class Statistics
    {
        public string Browser { get; set; }
        public double Users { get; set; }
    }

    public List<Statistics> StatisticsDetails = new List<Statistics>
    {
        new Statistics { Browser = "Chrome", Users = 37 },
        new Statistics { Browser = "UC Browser", Users = 17 },
        new Statistics { Browser = "iPhone", Users = 19 },
        new Statistics { Browser = "Others", Users = 4  },
        new Statistics { Browser = "Opera", Users = 11 },
        new Statistics { Browser = "Android", Users = 12 },
    };
}
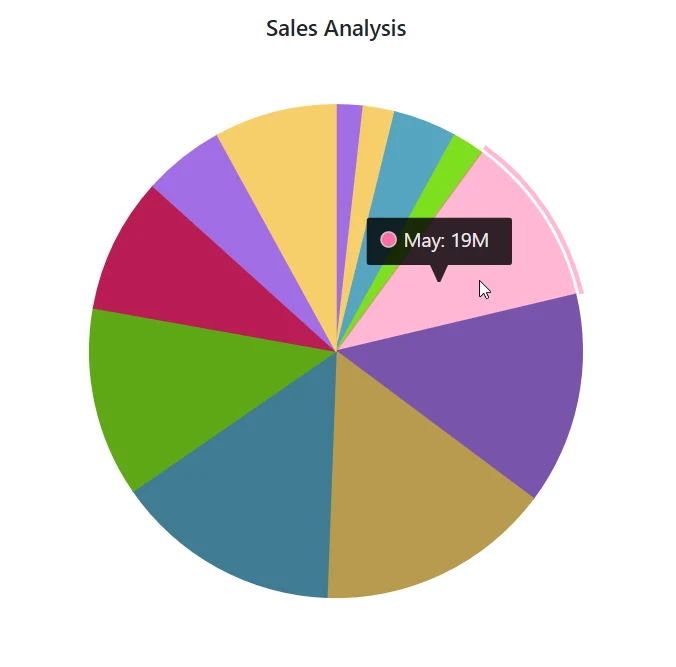
Tooltip Text Mapping
By default, tooltip shows information of x and y value in points. In addition, by using the TooltipMappingName, more information from the datasource can be displayed in the tooltip. To display the specified tooltip content, $point.tooltip can be used as a placeholder.
@using Syncfusion.Blazor.Charts

<SfAccumulationChart Title="Sales Analysis">
    <AccumulationChartSeriesCollection>
        <AccumulationChartSeries DataSource="@StatisticsDetails" XName="XValue" YName="YValue"
                                 TooltipMappingName="Text">
        </AccumulationChartSeries>
    </AccumulationChartSeriesCollection>

    <AccumulationChartLegendSettings Visible="false"></AccumulationChartLegendSettings>

    <AccumulationChartTooltipSettings Enable="true" Format="${point.tooltip}" ></AccumulationChartTooltipSettings>
</SfAccumulationChart>

@code{
    public class ChartData
    {
        public string XValue { get; set; }
        public double YValue { get; set; }
        public string Text { get; set; }
    }

    public List<ChartData> StatisticsDetails = new List<ChartData>
    {
       new ChartData { XValue = "Jan", YValue = 3, Text= "Jan: 3M" },
       new ChartData { XValue = "Feb", YValue = 3.5, Text= "Feb: 3.5M" },
       new ChartData { XValue = "Mar", YValue = 7, Text= "Mar: 7M" },
       new ChartData { XValue = "Apr", YValue = 3.5, Text= "Apr: 13.5M" },
       new ChartData { XValue = "May", YValue = 19, Text= "May: 19M" },
       new ChartData { XValue = "Jun", YValue = 23.5, Text= "Jun: 23.5M" },
       new ChartData { XValue = "Jul", YValue = 26, Text= "Jul: 26M" },
       new ChartData { XValue = "Aug", YValue = 25, Text= "Aug: 25M" },
       new ChartData { XValue = "Sep", YValue = 21, Text= "Sep: 21M" },
       new ChartData { XValue = "Oct", YValue = 15, Text= "Oct: 15M" },
       new ChartData { XValue = "Nov", YValue = 9, Text= "Nov: 9M" },
       new ChartData { XValue = "Dec", YValue = 13.5, Text= "Dec: 3.5M" }
   };
}
NOTE
Refer to the Blazor Charts feature tour page for its groundbreaking feature representations and also explore the Blazor Accumulation Chart Example to know about the various features of accumulation charts and how it is used to represent numeric proportional data.