Annotation in Blazor Charts Component
18 Jun 20265 minutes to read
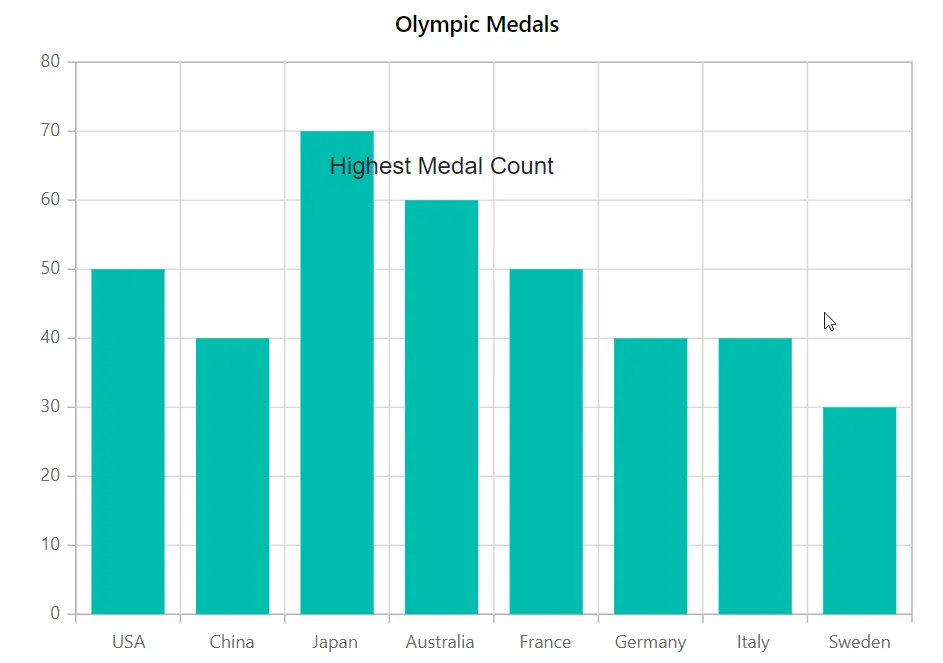
Annotations are texts, shapes, or images that are used to highlight a specific region of interest in a chart.
A detailed walkthrough demonstrating how to add and customize annotations in the chart is presented in the video below.
The ChartAnnotations property is used to add annotations to the chart. Annotation content can be defined by using the ContentTemplate property, which allows custom HTML content to be rendered at a specified coordinate within the chart area.
@using Syncfusion.Blazor.Charts

<SfChart Title="Olympic Medals">
    <ChartPrimaryXAxis ValueType="Syncfusion.Blazor.Charts.ValueType.Category">
    </ChartPrimaryXAxis>

    <ChartAnnotations>
        <ChartAnnotation X="@data" Y="65" CoordinateUnits="Units.Point">
            <ContentTemplate>
                <div style="color: firebrick; font-size: medium; font-style: italic">Highest Medal Count</div>
            </ContentTemplate>
        </ChartAnnotation>
    </ChartAnnotations>

    <ChartSeriesCollection>
        <ChartSeries DataSource="@MedalDetails" XName="Country" YName="Gold" Type="ChartSeriesType.Column">
        </ChartSeries>
    </ChartSeriesCollection>
</SfChart>

@code{
    string data = "France";

    public class ChartData
    {
        public string Country { get; set; }
        public double Gold { get; set; }
    }

    public List<ChartData> MedalDetails = new List<ChartData>
	{
		new ChartData{ Country= "USA", Gold=50  },
		new ChartData{ Country= "China", Gold=40 },
		new ChartData{ Country= "Japan", Gold=70 },
		new ChartData{ Country= "Australia", Gold=60},
		new ChartData{ Country= "France", Gold=50 },
		new ChartData{ Country= "Germany", Gold=40 },
		new ChartData{ Country= "Italy", Gold=40 },
		new ChartData{ Country= "Sweden", Gold=30 }
    };
}
Region
The Region property can be used to insert annotations in relation to a series or a chart. By default, it is positioned with respect to a Chart.
@using Syncfusion.Blazor.Charts

<SfChart Title="Olympic Medals">
    <ChartPrimaryXAxis ValueType="Syncfusion.Blazor.Charts.ValueType.Category">
    </ChartPrimaryXAxis>

    <ChartAnnotations>
        <ChartAnnotation X="@Country" Y="65" Region="Regions.Series" CoordinateUnits="Units.Point">
            <ContentTemplate>
                <div>Highest Medal Count</div>
            </ContentTemplate>
        </ChartAnnotation>
    </ChartAnnotations>

    <ChartSeriesCollection>
        <ChartSeries DataSource="@MedalDetails" XName="Country" YName="Gold" Type="ChartSeriesType.Column">
        </ChartSeries>
    </ChartSeriesCollection>
</SfChart>

@code{
    string Country = "Australia";

    public class ChartData
    {
        public string Country { get; set; }
        public double Gold { get; set; }
    }

    public List<ChartData> MedalDetails = new List<ChartData>
	{
		new ChartData{ Country= "USA", Gold=50  },
		new ChartData{ Country= "China", Gold=40 },
		new ChartData{ Country= "Japan", Gold=70 },
		new ChartData{ Country= "Australia", Gold=60},
		new ChartData{ Country= "France", Gold=50 },
		new ChartData{ Country= "Germany", Gold=40 },
		new ChartData{ Country= "Italy", Gold=40 },
		new ChartData{ Country= "Sweden", Gold=30 }
    };
}
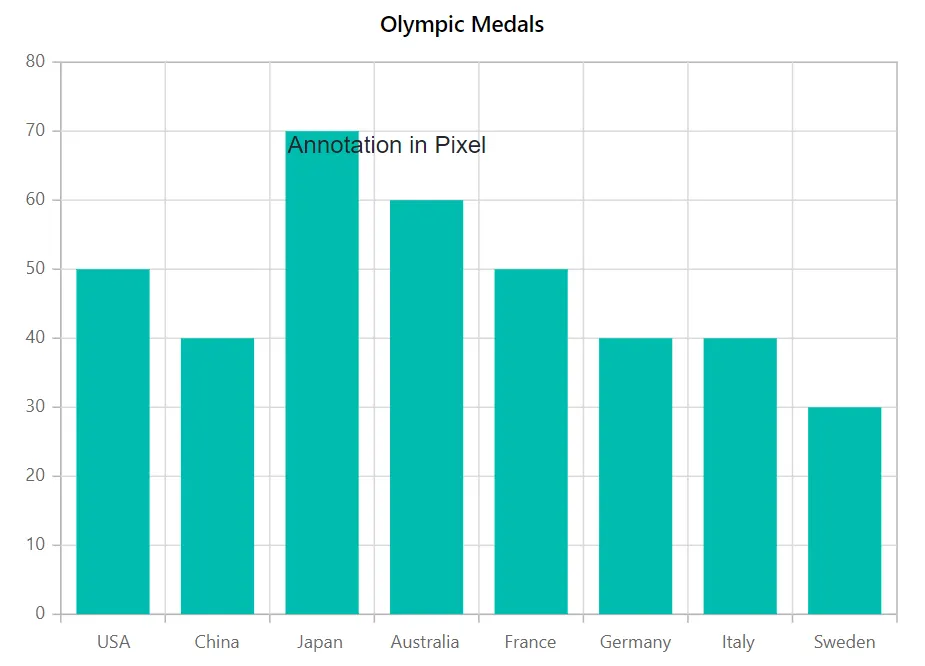
Co-ordinate units
The CoordinateUnits property allows to specify the annotation’s coordinate units either in Pixel or Point.
@using Syncfusion.Blazor.Charts

<SfChart Title="Olympic Medals">
    <ChartPrimaryXAxis ValueType="Syncfusion.Blazor.Charts.ValueType.Category">
    </ChartPrimaryXAxis>

    <ChartAnnotations>
        <ChartAnnotation X="250" Y="100" CoordinateUnits="Units.Pixel">
            <ContentTemplate>
                <div>Annotation in Pixel</div>
            </ContentTemplate>
        </ChartAnnotation>
    </ChartAnnotations>

    <ChartSeriesCollection>
        <ChartSeries DataSource="@MedalDetails" XName="Country" YName="Gold" Type="ChartSeriesType.Column">
        </ChartSeries>
    </ChartSeriesCollection>
</SfChart>

@code{
    public class ChartData
    {
        public string Country { get; set; }
        public double Gold { get; set; }
    }

    public List<ChartData> MedalDetails = new List<ChartData>
	{
		new ChartData{ Country= "USA", Gold=50  },
		new ChartData{ Country= "China", Gold=40 },
		new ChartData{ Country= "Japan", Gold=70 },
		new ChartData{ Country= "Australia", Gold=60},
		new ChartData{ Country= "France", Gold=50 },
		new ChartData{ Country= "Germany", Gold=40 },
		new ChartData{ Country= "Italy", Gold=40 },
		new ChartData{ Country= "Sweden", Gold=30 }
    };
}
NOTE
Refer to the Blazor Charts feature tour page for its groundbreaking feature representations and also explore the Blazor Chart Example to know various chart types and how to represent time-dependent data, showing trends at equal intervals.