Markers in Blazor Charts Component
18 Jun 20269 minutes to read
Data markers are used to provide information about the data points in a series. Each data point can be adorned with a shape.
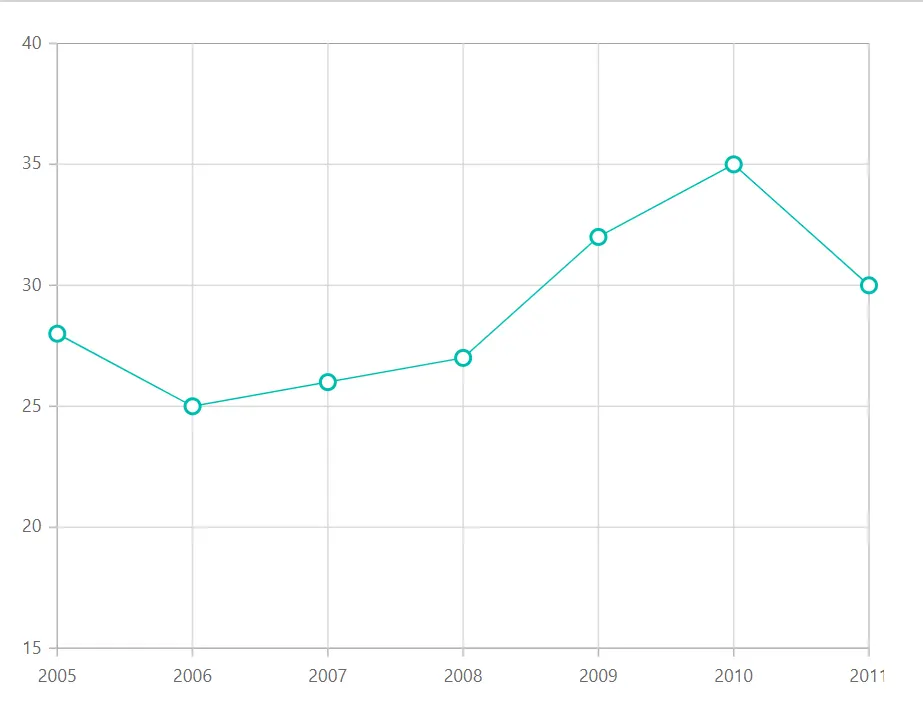
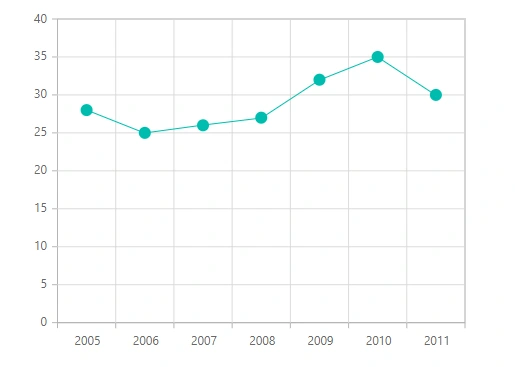
Markers
Markers can be added to the points by enabling the Visible property to true of ChartMarker.
@using Syncfusion.Blazor.Charts

<SfChart>
    <ChartSeriesCollection>
        <ChartSeries DataSource="@ConsumerReports" XName="X" YName="Y" Type="ChartSeriesType.Line">
            <ChartMarker Visible="true" Height="10" Width="10"/>
        </ChartSeries>
    </ChartSeriesCollection>
</SfChart>

@code{
    public class ChartData
    {
        public double X { get; set; }
        public double Y { get; set; }
    }

    public List<ChartData> ConsumerReports = new List<ChartData>
	{
		new ChartData{ X= 2005, Y= 28 },
		new ChartData{ X= 2006, Y= 25 },
		new ChartData{ X= 2007, Y= 26 },
		new ChartData{ X= 2008, Y= 27 },
		new ChartData{ X= 2009, Y= 32 },
		new ChartData{ X= 2010, Y= 35 },
		new ChartData{ X= 2011, Y= 30 }
	};
}
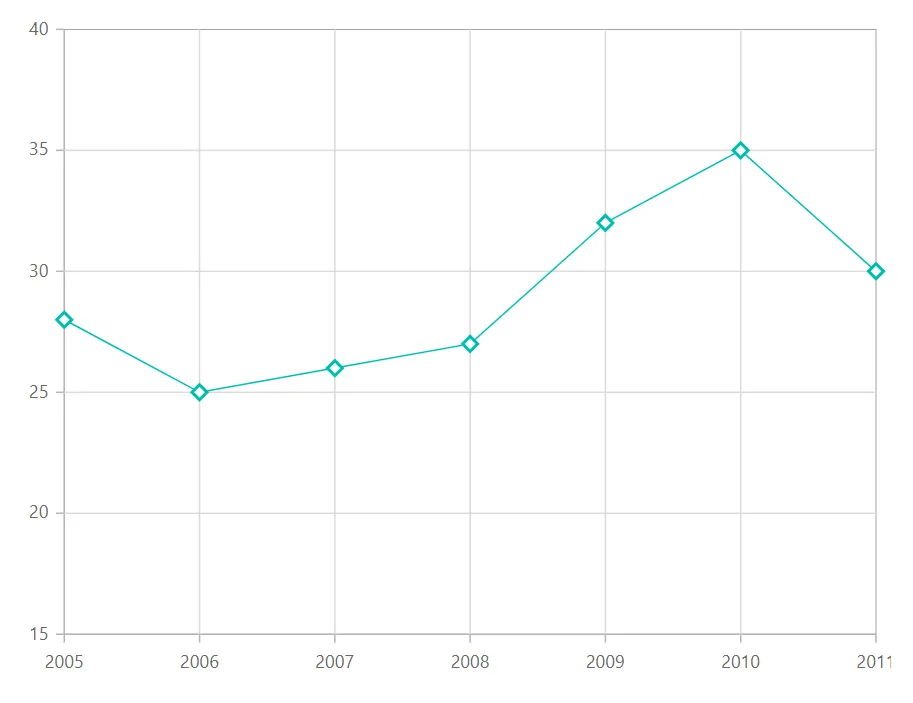
Shape
Markers can be assigned with different shapes such as Rectangle, Circle, Diamond etc. using the Shape property.
@using Syncfusion.Blazor.Charts

<SfChart>
    <ChartSeriesCollection>
        <ChartSeries DataSource="@ConsumerReports" XName="X" YName="Y" Type="ChartSeriesType.Line">
            <ChartMarker Visible="true" Height="10" Width="10" Shape="ChartShape.Diamond"/>
        </ChartSeries>
    </ChartSeriesCollection>
</SfChart>

@code{
    public class ChartData
    {
        public double X { get; set; }
        public double Y { get; set; }
    }

    public List<ChartData> ConsumerReports = new List<ChartData>
	{
		new ChartData{ X= 2005, Y= 28 },
		new ChartData{ X= 2006, Y= 25 },
		new ChartData{ X= 2007, Y= 26 },
		new ChartData{ X= 2008, Y= 27 },
		new ChartData{ X= 2009, Y= 32 },
		new ChartData{ X= 2010, Y= 35 },
		new ChartData{ X= 2011, Y= 30 }
	};
}
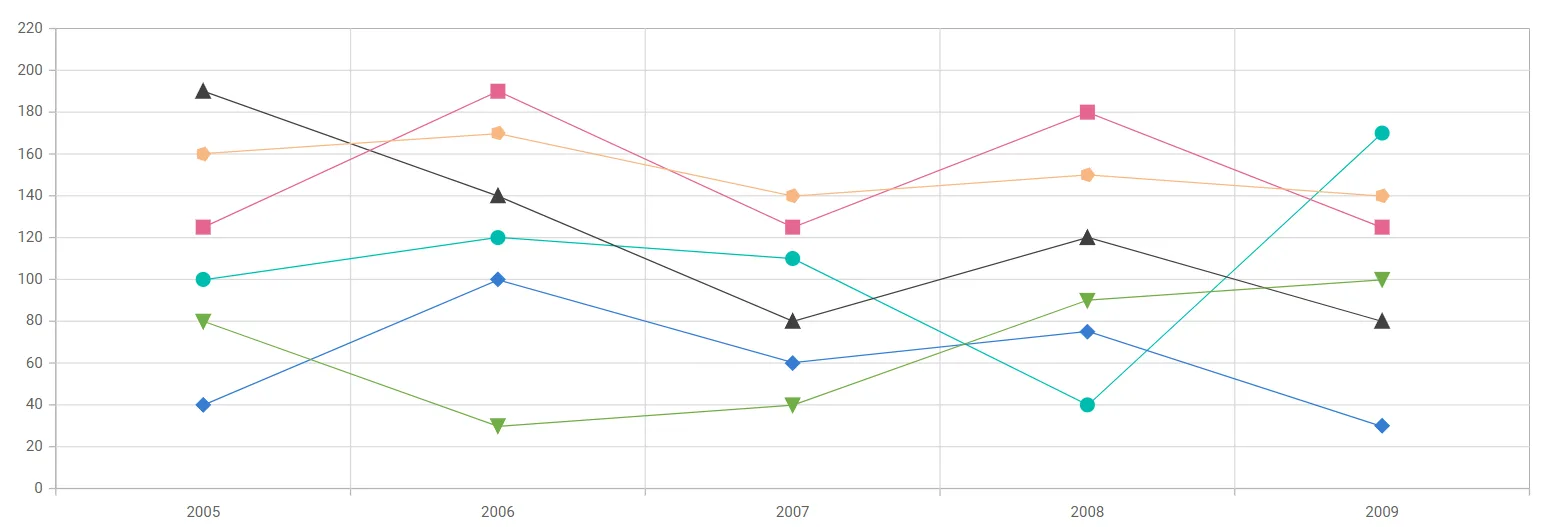
Auto marker shape
By default, the chart marker shape is set to Auto. When Auto is set and marker is enabled in the chart at the same time, each series is rendered with a unique marker shape.
@using Syncfusion.Blazor.Charts

<SfChart ID="container">
    <ChartPrimaryXAxis ValueType="Syncfusion.Blazor.Charts.ValueType.DateTimeCategory" Format="yyyy"></ChartPrimaryXAxis>
    <ChartSeriesCollection>
        <ChartSeries Name="Series1" DataSource="@ConsumerReports" XName="X" YName="Y1" Type="ChartSeriesType.Line">
            <ChartMarker Visible="true" Height="10" Width="10" IsFilled="true"/>
        </ChartSeries>
        <ChartSeries Name="Series2" DataSource="@ConsumerReports" XName="X" YName="Y2" Type="ChartSeriesType.Line">
            <ChartMarker Visible="true" Height="10" Width="10" IsFilled="true" />
        </ChartSeries>
        <ChartSeries Name="Series3" DataSource="@ConsumerReports" XName="X" YName="Y3" Type="ChartSeriesType.Line">
            <ChartMarker Visible="true" Height="10" Width="10" IsFilled="true" />
        </ChartSeries>
        <ChartSeries Name="Series4" DataSource="@ConsumerReports" XName="X" YName="Y4" Type="ChartSeriesType.Line">
            <ChartMarker Visible="true" Height="10" Width="10" IsFilled="true" />
        </ChartSeries>
        <ChartSeries Name="Series5" DataSource="@ConsumerReports" XName="X" YName="Y5" Type="ChartSeriesType.Line">
            <ChartMarker Visible="true" Height="10" Width="10" IsFilled="true" />
        </ChartSeries>
        <ChartSeries Name="Series6" DataSource="@ConsumerReports" XName="X" YName="Y6" Type="ChartSeriesType.Line">
            <ChartMarker Visible="true" Height="10" Width="10" IsFilled="true" />
        </ChartSeries>
    </ChartSeriesCollection>
</SfChart>

@code {
    public class ChartData
    {
        public DateTime X { get; set; }
        public double Y { get; set; }
        public double Y1 { get; set; }
        public double Y2 { get; set; }
        public double Y3 { get; set; }
        public double Y4 { get; set; }
        public double Y5 { get; set; }
        public double Y6 { get; set; }
    }

    public List<ChartData> ConsumerReports = new List<ChartData>
    {
        new ChartData{ X= new DateTime(2005,01,01), Y1 = 100, Y2 = 190, Y3 = 40, Y4 = 125, Y5 = 160, Y6 = 80 },
        new ChartData{ X= new DateTime(2006,01,01), Y1 = 120, Y2 = 140, Y3 = 100, Y4 = 190, Y5 = 170, Y6 = 30 },
        new ChartData{ X= new DateTime(2007,01,01), Y1 = 110, Y2 = 80, Y3 = 60, Y4 = 125, Y5 = 140, Y6 = 40 },
        new ChartData{ X= new DateTime(2008,01,01), Y1 = 40, Y2 = 120, Y3 = 75, Y4 = 180, Y5 = 150, Y6 = 90 },
        new ChartData{ X= new DateTime(2009,01,01), Y1 = 170, Y2 = 80, Y3 = 30, Y4 = 125, Y5 = 140, Y6 = 100 },
    };
}
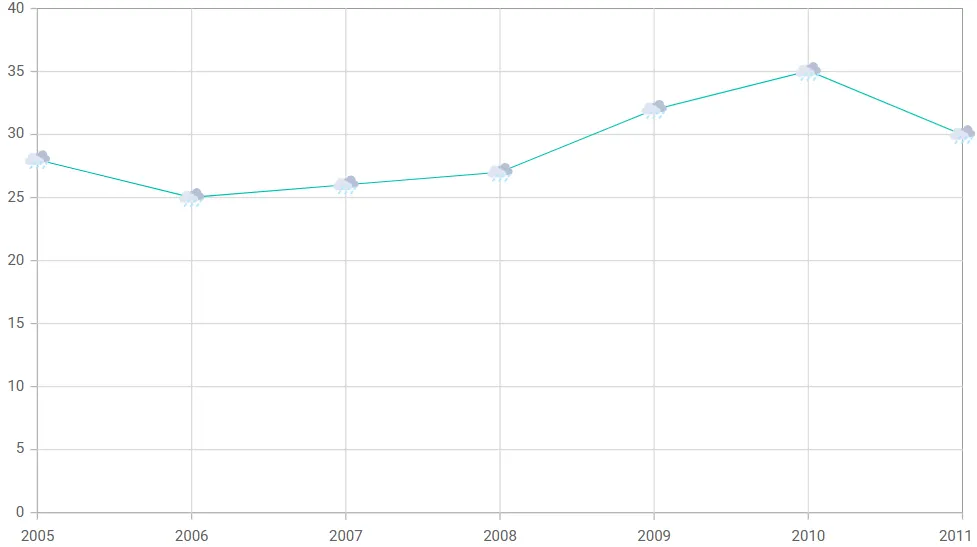
Images
Apart from shapes, one can also add custom images to mark the data point using the ImageUrl property by specifying Image shape for marker.
@using Syncfusion.Blazor.Charts

<SfChart>
    <ChartSeriesCollection>
        <ChartSeries DataSource="@ConsumerReports" XName="X" YName="Y" Type="ChartSeriesType.Line">
            <ChartMarker Visible="true" Shape="ChartShape.Image" Height="20" Width="20" ImageUrl="https://ej2.syncfusion.com/demos/src/chart/images/cloud.webp">
            </ChartMarker>
        </ChartSeries>
    </ChartSeriesCollection>
</SfChart>

@code{
    public class ChartData
    {
        public double X { get; set; }
        public double Y { get; set; }
    }

    public List<ChartData> ConsumerReports = new List<ChartData>
	{
		new ChartData{ X= 2005, Y= 28 },
		new ChartData{ X= 2006, Y= 25 },
		new ChartData{ X= 2007, Y= 26 },
		new ChartData{ X= 2008, Y= 27 },
		new ChartData{ X= 2009, Y= 32 },
		new ChartData{ X= 2010, Y= 35 },
		new ChartData{ X= 2011, Y= 30 }
	};
}
Fill marker with series color
Marker can be filled with the series color by setting IsFilled property to true of ChartMarker.
@using Syncfusion.Blazor.Charts

<SfChart>
    <ChartPrimaryXAxis ValueType="Syncfusion.Blazor.Charts.ValueType.Category">
    </ChartPrimaryXAxis>
    <ChartSeriesCollection>
        <ChartSeries DataSource="@ConsumerReports" XName="X" YName="Y" Type="ChartSeriesType.Line">
            <ChartMarker Visible="true" Height="10" Width="10" IsFilled="true">
            </ChartMarker>
        </ChartSeries>
    </ChartSeriesCollection>
</SfChart>

@code{
    public class ChartData
    {
        public double X { get; set; }
        public double Y { get; set; }
    }

    public List<ChartData> ConsumerReports = new List<ChartData>
	{
		new ChartData{ X= 2005, Y= 28 },
		new ChartData{ X= 2006, Y= 25 },
		new ChartData{ X= 2007, Y= 26 },
		new ChartData{ X= 2008, Y= 27 },
		new ChartData{ X= 2009, Y= 32 },
		new ChartData{ X= 2010, Y= 35 },
		new ChartData{ X= 2011, Y= 30 }
	};
}
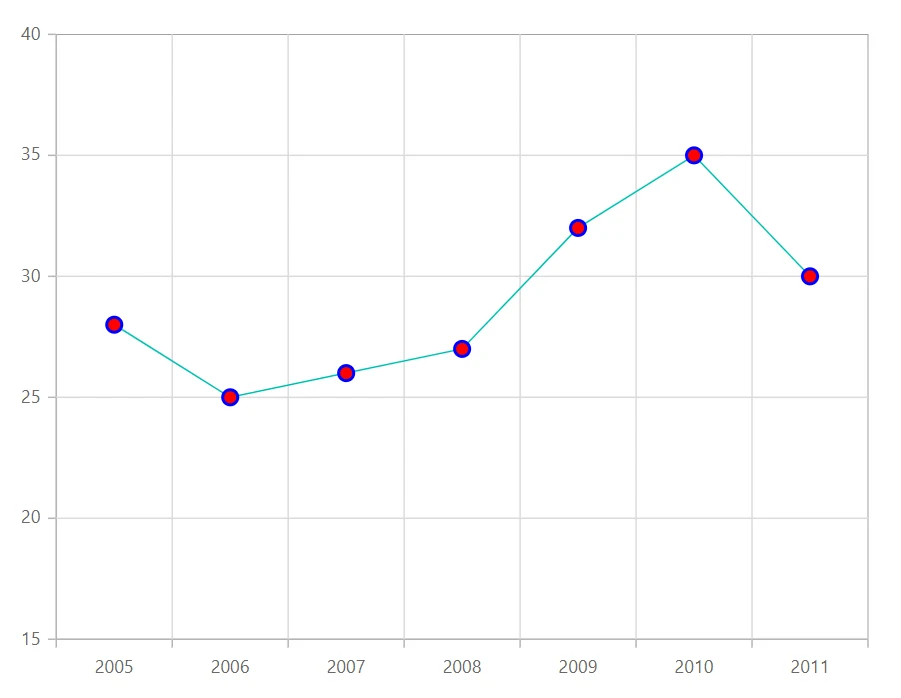
Customization
Markers color can be customized using Fill property and the border color and width can be customized based on the specified value in ChartMarkerBorder.
@using Syncfusion.Blazor.Charts

<SfChart>
    <ChartPrimaryXAxis ValueType="Syncfusion.Blazor.Charts.ValueType.Category">
    </ChartPrimaryXAxis>

    <ChartSeriesCollection>
        <ChartSeries DataSource="@ConsumerReports" XName="X" YName="Y" Type="ChartSeriesType.Line">
            <ChartMarker Visible="true" Height="10" Width="10" Fill="red">
                <ChartMarkerBorder Width="2" Color="blue"></ChartMarkerBorder>
            </ChartMarker>
        </ChartSeries>
    </ChartSeriesCollection>
</SfChart>

@code{
    public class ChartData
    {
        public double X { get; set; }
        public double Y { get; set; }
    }

    public List<ChartData> ConsumerReports = new List<ChartData>
	{
		new ChartData{ X= 2005, Y= 28 },
		new ChartData{ X= 2006, Y= 25 },
		new ChartData{ X= 2007, Y= 26 },
		new ChartData{ X= 2008, Y= 27 },
		new ChartData{ X= 2009, Y= 32 },
		new ChartData{ X= 2010, Y= 35 },
		new ChartData{ X= 2011, Y= 30 }
	};
}
NOTE
Refer to the Blazor Charts feature tour page for its groundbreaking feature representations and also explore the Blazor Chart Example to know various chart types and how to represent time-dependent data, showing trends at equal intervals.