Getting Started with Blazor Charts in Server App
31 Aug 20267 minutes to read
This section briefly explains how to include the Blazor Charts component in your Blazor Server App using Visual Studio, Visual Studio Code, and the .NET CLI.
Ready to streamline your Blazor development?
Discover the full potential of Blazor components with AI Coding Assistants. Effortlessly integrate, configure, and enhance your projects with intelligent, context-aware code suggestions, streamlined setups, and real-time insights—all seamlessly integrated into your preferred AI-powered IDEs like VS Code, Cursor, Code Studio and more. Explore AI Coding Assistants
Using .NET CLI Templates
Quickly set up a Blazor application using the preconfigured Syncfusion Web App Template.
First, install the template using the .NET CLI.
dotnet new install Syncfusion.Blazor.WebApp.TemplatesNext, create a new project with following command.
dotnet new syncfusionblazorwebapp --name MyApp --interactivity ServerAfter creating the project, navigate to the main project folder (for example, MyApp) and run the following command.
cd MyApp
dotnet run
Manually creating a new Blazor Server App
Create a Blazor Server App by using the Blazor Web App template in Visual Studio via Microsoft Templates or the Syncfusion® Blazor Extension.
Run the following command to create a new Blazor Server App.
dotnet new blazor -o BlazorApp --interactivity Server
cd BlazorApp
Alternatively, create a Blazor Server App using Visual Studio Code via Microsoft Templates or the Syncfusion® Blazor Extension, or the C# Dev Kit extension.
NOTE
Configure the appropriate Interactive render mode and Interactivity location while creating a Blazor Server App. For detailed information, refer to the interactive render mode documentation.
Install the required Blazor package
Install the Syncfusion.Blazor.Charts NuGet package. All Syncfusion Blazor packages are available on nuget.org. See the NuGet packages topic for details.
- Go to Tools → NuGet Package Manager → Manage NuGet Packages for Solution.
- Search the required NuGet package (
Syncfusion.Blazor.Charts) and install it.
Alternatively, you can install the same package using the Package Manager Console with the following command.
Install-Package Syncfusion.Blazor.Charts -Version 34.2.2Open the terminal and run the following command.
dotnet add package Syncfusion.Blazor.Charts -v 34.2.2Add import namespaces
After the package is installed, open the ~/_Imports.razor file and import the Syncfusion.Blazor and Syncfusion.Blazor.Charts namespaces.
@using Syncfusion.Blazor
@using Syncfusion.Blazor.Charts
Register the Blazor service
Open the Program.cs file in Blazor Server App and register the Blazor service and include the required namespace reference using Syncfusion.Blazor; at the top.
builder.Services.AddSyncfusionBlazor();Add script resource
Include the required script references at the end of the <body> section in the App.razor file to enable Charts functionality.
<script src="_content/Syncfusion.Blazor.Core/scripts/syncfusion-blazor.min.js" type="text/javascript"></script>Add Blazor Charts component
Open a Razor file located in the ~/Pages/*.razor (for example, Home.razor) and add the Blazor Charts component inside the razor file.
NOTE
If the interactivity location is set to
Per page/component, define a render mode at the top of the razor file. (For exampleInteractiveServer). If the Interactivity is set toGlobal, the render mode is automatically configured in theApp.razorfile by default.
@rendermode InteractiveServer
@* SfChart is the root container component for the chart *@
<SfChart>

</SfChart>
Run the application
Press Ctrl+F5 (Windows) or ⌘+F5 (macOS) to launch the application. The Blazor Charts component will render in your default web browser.
Open the terminal and run the following command.
dotnet run
Populate Blazor Charts with data
To bind data for the Blazor charts component, you can assign an IEnumerable object to the DataSource property. It can also be provided as an instance of the DataManager.
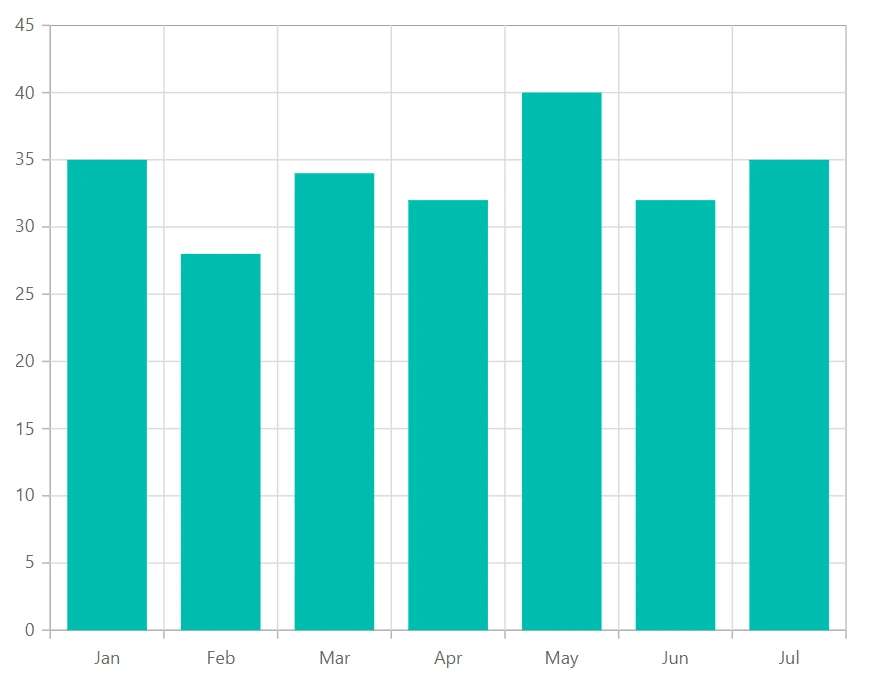
Map the data fields Month and SalesValue to the series XName and YName properties, then set the data to the DataSource property, and the chart type to Column because we will be viewing the data in a column chart.
<SfChart>
    <!-- ChartPrimaryXAxis configures the X-axis properties such as value type and labels -->
    <ChartPrimaryXAxis ValueType="Syncfusion.Blazor.Charts.ValueType.Category"></ChartPrimaryXAxis>
    <!-- ChartSeriesCollection contains one or more data series to be plotted on the chart -->
    <ChartSeriesCollection>
        <!-- ChartSeries defines a data series with its data source and axis mappings -->
        <ChartSeries DataSource="@Sales" XName="Month" YName="SalesValue" Type="ChartSeriesType.Column">
        </ChartSeries>
    </ChartSeriesCollection>
</SfChart>

@code
{
    public class SalesInfo
    {
        public string Month { get; set; }
        public double SalesValue { get; set; }
    }

    public List<SalesInfo> Sales = new List<SalesInfo>
    {
        new SalesInfo { Month = "Jan", SalesValue = 35 },
        new SalesInfo { Month = "Feb", SalesValue = 28 },
        new SalesInfo { Month = "Mar", SalesValue = 34 },
        new SalesInfo { Month = "Apr", SalesValue = 32 },
        new SalesInfo { Month = "May", SalesValue = 40 },
        new SalesInfo { Month = "Jun", SalesValue = 32 },
        new SalesInfo { Month = "Jul", SalesValue = 35 }
    };
}
NOTE