Bubble HeatMap in Blazor HeatMap Chart Component
23 Jun 202624 minutes to read
This section shows how to customize the appearance of the HeatMap cells as bubbles. The below video demonstrates the same.
Data points represent the data source values with gradient or fixed colors in the HeatMap. You can customize the appearance of these data points by changing the Color and Size attributes.
The data points can be represented in color fill or bubble shape by defining the TileType property. By default, the data points are color filled with gradient or fixed colors and this depiction of data points is defined as Rect in the TileType property.
The cell customizations and color mapping for rect tile type is defined in appearance and palette sections in detail.
Bubble types
The data points can be represented in the bubble along with its attributes by setting the TileType property to Bubble.
In bubble HeatMap, you can display the data points with bubble size, bubble colors, and sector attributes of the bubble.
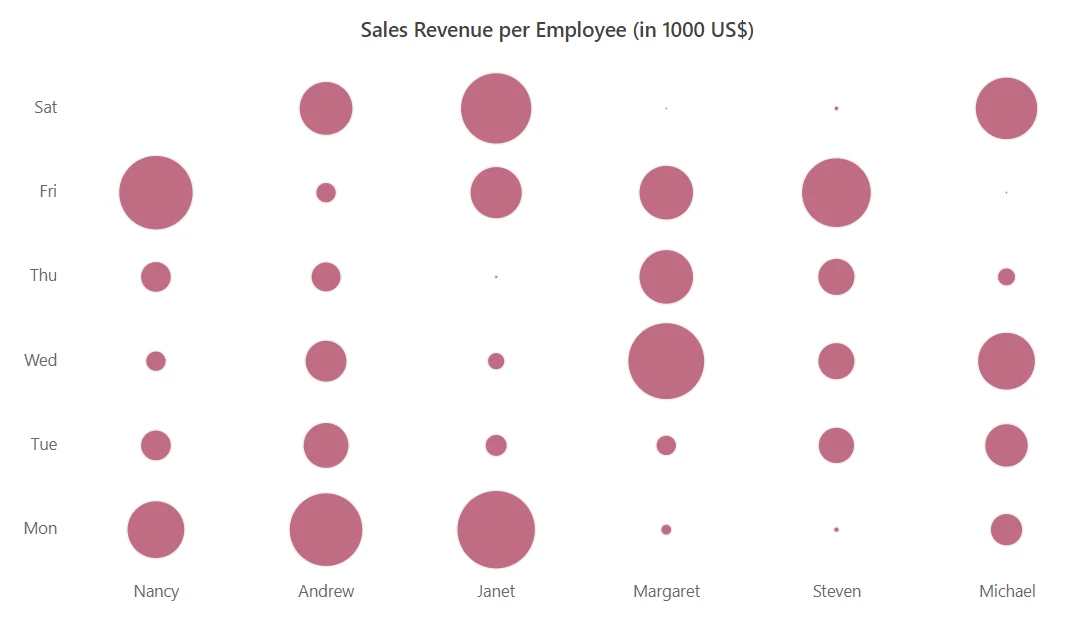
Bubble size
In this bubble HeatMap type, the size factor of the bubble is used to denote the data variations. The radius of the bubble varies according to data values.
By default, the bubble with small size denotes the data value with small magnitude and the larger bubble size denotes the data value with larger magnitude. This behavior can be inversed by using the IsInversedBubbleSize property.
To render a bubble HeatMap with size series, set the BubbleType property to Size.
@using Syncfusion.Blazor.HeatMap

<SfHeatMap DataSource="@HeatMapData">
    <HeatMapTitleSettings Text="Sales Revenue per Employee (in 1000 US$)">
    </HeatMapTitleSettings>
    <HeatMapXAxis Labels="@XAxisLabels"></HeatMapXAxis>
    <HeatMapYAxis Labels="@YAxisLabels"></HeatMapYAxis>
    <HeatMapCellSettings ShowLabel="false" TileType="CellType.Bubble" BubbleType="BubbleType.Size"></HeatMapCellSettings>
    <HeatMapPaletteSettings Type="PaletteType.Gradient">
        <HeatMapPalettes>
            <HeatMapPalette Color="#C06C84"></HeatMapPalette>
            <HeatMapPalette Color="#6C5B7B"></HeatMapPalette>
            <HeatMapPalette Color="#355C7D"></HeatMapPalette>
        </HeatMapPalettes>
    </HeatMapPaletteSettings>
</SfHeatMap>

@code{
    int[,] GetDefaultData()
    {
        int[,] dataSource = new int[,]
        {
            {73, 39, 26, 39, 94, 0},
            {93, 58, 53, 38, 26, 68},
            {99, 28, 22, 4, 66, 90},
            {14, 26, 97, 69, 69, 3},
            {7, 46, 47, 47, 88, 6},
            {41, 55, 73, 23, 3, 79}
        };
        return dataSource;
    }
    string[] XAxisLabels = new string[] {"Nancy", "Andrew", "Janet", "Margaret", "Steven", "Michael", "Robert","Laura", "Anne", "Paul", "Karin", "Mario" };
    string[] YAxisLabels = new string[] { "Mon", "Tue", "Wed", "Thu", "Fri", "Sat" };
    public object HeatMapData { get; set; }
    protected override void OnInitialized()
    {
        HeatMapData = GetDefaultData();
    }
}
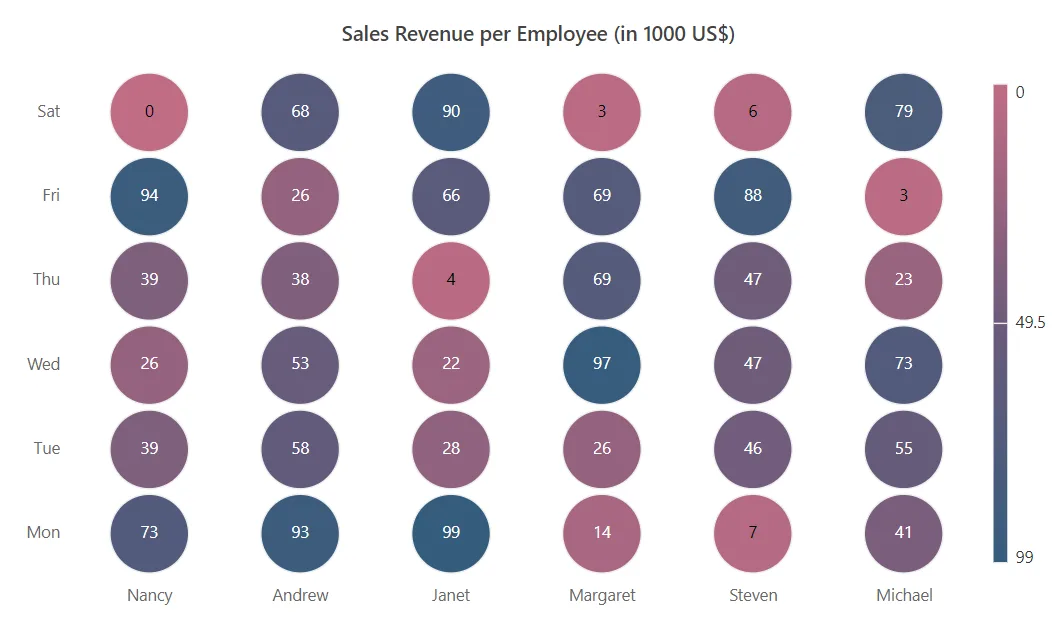
Bubble color
In HeatMap, defined with this tile type, the data points will be represented with same sized bubbles and the data value variations are represented with the bubble colors.
To represent the data points with variations in bubble colors, set the BubbleType property to Color.
@using Syncfusion.Blazor.HeatMap

<SfHeatMap DataSource="@HeatMapData">
    <HeatMapTitleSettings Text="Sales Revenue per Employee (in 1000 US$)">
    </HeatMapTitleSettings>
    <HeatMapXAxis Labels="@XAxisLabels"></HeatMapXAxis>
    <HeatMapYAxis Labels="@YAxisLabels"></HeatMapYAxis>
    <HeatMapCellSettings ShowLabel="true" TileType="CellType.Bubble" BubbleType="BubbleType.Color"></HeatMapCellSettings>
    <HeatMapPaletteSettings Type="PaletteType.Gradient">
        <HeatMapPalettes>
            <HeatMapPalette Color="#C06C84"></HeatMapPalette>
            <HeatMapPalette Color="#6C5B7B"></HeatMapPalette>
            <HeatMapPalette Color="#355C7D"></HeatMapPalette>
        </HeatMapPalettes>
    </HeatMapPaletteSettings>
</SfHeatMap>

@code{
    int[,] GetDefaultData()
    {
        int[,] dataSource = new int[,]
        {
            {73, 39, 26, 39, 94, 0},
            {93, 58, 53, 38, 26, 68},
            {99, 28, 22, 4, 66, 90},
            {14, 26, 97, 69, 69, 3},
            {7, 46, 47, 47, 88, 6},
            {41, 55, 73, 23, 3, 79}
        };
        return dataSource;
    }
    string[] XAxisLabels = new string[] {"Nancy", "Andrew", "Janet", "Margaret", "Steven", "Michael" };
    string[] YAxisLabels = new string[] { "Mon", "Tue", "Wed", "Thu", "Fri", "Sat" };
    public object HeatMapData { get; set; }
    protected override void OnInitialized()
    {
        HeatMapData = GetDefaultData();
    }
}
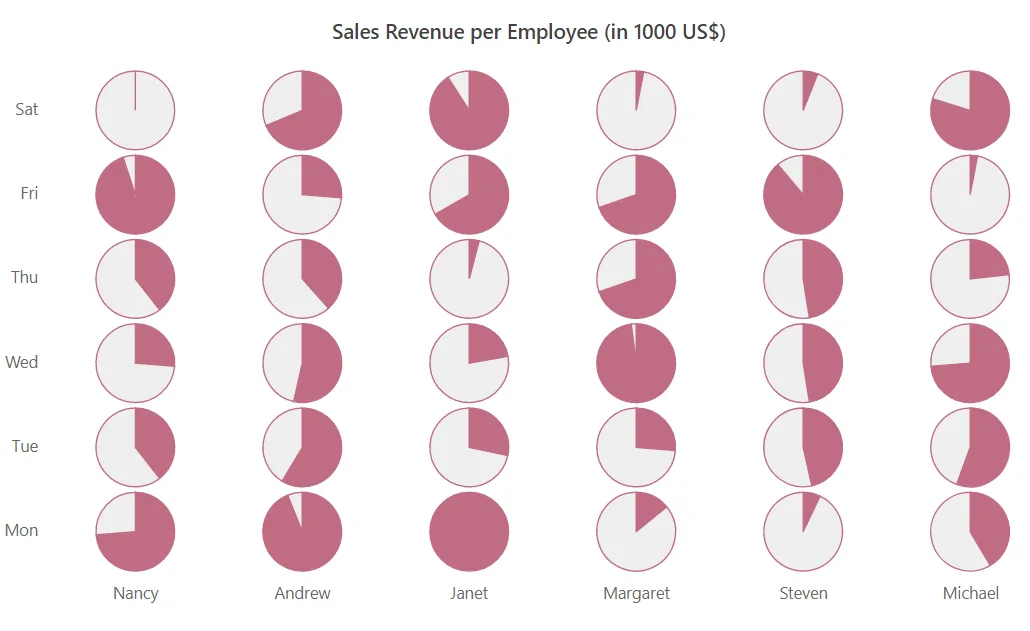
Bubble sector
In this bubble HeatMap type, the sector of the bubble decides the magnitude of data point. If the sector is large, then the data point value will be high.
To render the data points with bubble sector, set the BubbleType property to Sector.
@using Syncfusion.Blazor.HeatMap

<SfHeatMap DataSource="@HeatMapData">
    <HeatMapTitleSettings Text="Sales Revenue per Employee (in 1000 US$)">
    </HeatMapTitleSettings>
    <HeatMapXAxis Labels="@XAxisLabels"></HeatMapXAxis>
    <HeatMapYAxis Labels="@YAxisLabels"></HeatMapYAxis>
    <HeatMapCellSettings ShowLabel="true" TileType="CellType.Bubble" BubbleType="BubbleType.Sector"></HeatMapCellSettings>
    <HeatMapPaletteSettings Type="PaletteType.Gradient">
        <HeatMapPalettes>
            <HeatMapPalette Color="#C06C84"></HeatMapPalette>
            <HeatMapPalette Color="#6C5B7B"></HeatMapPalette>
            <HeatMapPalette Color="#355C7D"></HeatMapPalette>
        </HeatMapPalettes>
    </HeatMapPaletteSettings>
</SfHeatMap>

@code{
    int[,] GetDefaultData()
    {
        int[,] dataSource = new int[,]
        {
            {73, 39, 26, 39, 94, 0},
            {93, 58, 53, 38, 26, 68},
            {99, 28, 22, 4, 66, 90},
            {14, 26, 97, 69, 69, 3},
            {7, 46, 47, 47, 88, 6},
            {41, 55, 73, 23, 3, 79}
        };
        return dataSource;
    }
    string[] XAxisLabels = new string[] {"Nancy", "Andrew", "Janet", "Margaret", "Steven", "Michael" };
    string[] YAxisLabels = new string[] { "Mon", "Tue", "Wed", "Thu", "Fri", "Sat" };
    public object HeatMapData { get; set; }
    protected override void OnInitialized()
    {
        HeatMapData = GetDefaultData();
    }
}
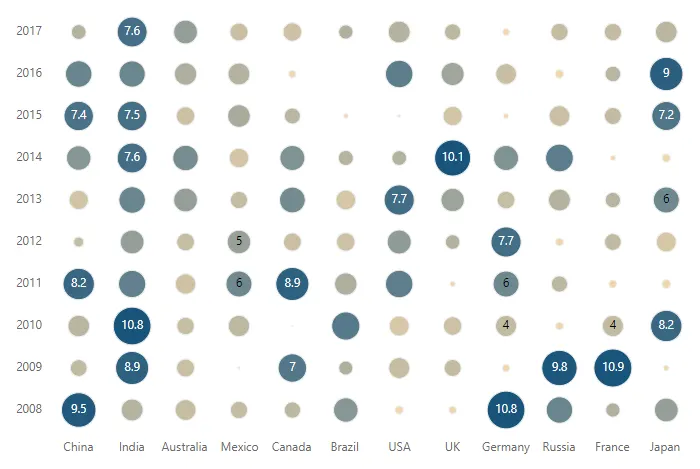
Combining size and color bubble types
In this bubble HeatMap type, size and color of the bubble represents the data value variation. To render this bubble HeatMap type, set the BubbleType property to SizeAndColor.
The following examples demonstrate different data binding with the SizeAndColor bubble type set in the HeatMap.
Array binding
When an array of numbers is specified as the DataSource, the bubble HeatMap can be rendered with different sizes and colors depending on the bound data.
Table
The following example illustrates how to render a bubble HeatMap with different sizes and colors using array table binding.
@using Syncfusion.Blazor.HeatMap;

<SfHeatMap DataSource="@HeatMapData">
    <HeatMapTitleSettings Text="GDP Growth Rate for Major Economies (in Percentage)">
        <HeatMapTitleTextStyle Size="15px" FontWeight="500" FontStyle="Normal" FontFamily="Segoe UI"></HeatMapTitleTextStyle>
    </HeatMapTitleSettings>
    <HeatMapXAxis Labels="@XAxisLabels"></HeatMapXAxis>
    <HeatMapYAxis Labels="@YAxisLabels"></HeatMapYAxis>
    <HeatMapCellSettings ShowLabel="true" TileType="CellType.Bubble" BubbleType="BubbleType.SizeAndColor"></HeatMapCellSettings>
    <HeatMapPaletteSettings Type="PaletteType.Gradient">
        <HeatMapPalettes>
            <HeatMapPalette Color="#F0D6AD" Value=-1></HeatMapPalette>
            <HeatMapPalette Color="#9da49a" Value=0></HeatMapPalette>
            <HeatMapPalette Color="#d7c7a7" Value=3.5></HeatMapPalette>
            <HeatMapPalette Color="#6e888f" Value=6.0></HeatMapPalette>
            <HeatMapPalette Color="#466f86" Value=7.5></HeatMapPalette>
            <HeatMapPalette Color="#19547B" Value=10></HeatMapPalette>
        </HeatMapPalettes>
    </HeatMapPaletteSettings>
    <HeatMapLegendSettings Visible="false"></HeatMapLegendSettings>
</SfHeatMap>

@code {
    double[,] GetDefaultData()
    {
        double[,] dataSource = new double[,]
            {

                {9.5, 2.2, 4.2, 8.2, -0.5, 3.2, 5.4, 7.4, 6.2, 1.4 },

                {4.3, 8.9, 10.8, 6.5, 5.1, 6.2, 7.6, 7.5, 6.1, 7.6 },

                {3.9, 2.7, 2.5, 3.7, 2.6, 5.1, 5.8, 2.9, 4.5, 5.1 },

                {2.4, -3.7, 4.1, 6.0, 5.0, 2.4, 3.3, 4.6, 4.3, 2.7 },

                {2.0, 7.0, -4.1, 8.9, 2.7, 5.9, 5.6, 1.9, -1.7, 2.9 },

                {5.4, 1.1, 6.9, 4.5, 2.9, 3.4, 1.5, -2.8, -4.6, 1.2 },

                {-1.3, 3.9, 3.5, 6.6, 5.2, 7.7, 1.4, -3.6, 6.6, 4.3 },

                {-1.6, 2.3, 2.9, -2.5, 1.3, 4.9, 10.1, 3.2, 4.8, 2.0 },

                {10.8, -1.6, 4.0, 6.0, 7.7, 2.6, 5.6, -2.5, 3.8, -1.9 },

                {6.2, 9.8, -1.5, 2.0, -1.5, 4.3, 6.7, 3.8, -1.2, 2.4 },

                {1.2, 10.9, 4.0, -1.4, 2.2, 1.6, -2.6, 2.3, 1.7, 2.4 },

                {5.1, -2.4, 8.2, -1.1, 3.5, 6.0, -1.3, 7.2, 9.0, 4.2 }
        };
        return dataSource;
    }
    string[] XAxisLabels = new string[] { "China", "India", "Australia", "Mexico", "Canada", "Brazil", "USA", "UK", "Germany", "Russia", "France", "Japan" };
    string[] YAxisLabels = new string[] { "2008", "2009", "2010", "2011", "2012", "2013", "2014", "2015", "2016", "2017" };
    public object HeatMapData { get; set; }
    protected override void OnInitialized()
    {
        HeatMapData = GetDefaultData();
    }
}
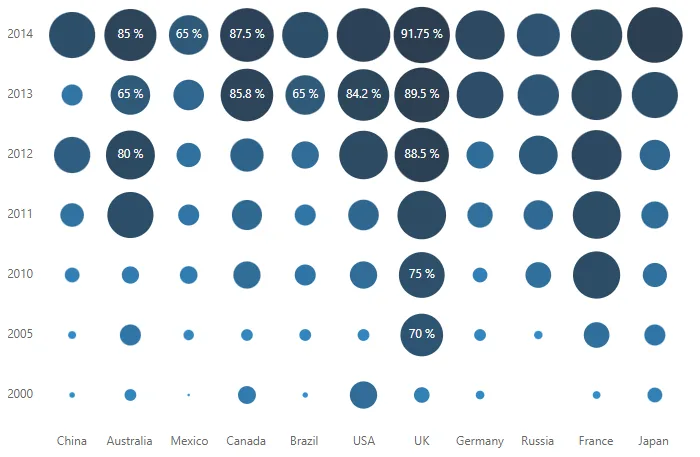
Cell
The following example illustrates how to render a bubble HeatMap with different sizes and colors using array cell binding.
@using Syncfusion.Blazor.HeatMap;

<SfHeatMap DataSource="@HeatMapData">
    <HeatMapTitleSettings Text="Percentage of Individuals Using Internet by Country">
        <HeatMapTitleTextStyle Size="15px" FontWeight="500" FontStyle="Normal" FontFamily="Segoe UI"></HeatMapTitleTextStyle>
    </HeatMapTitleSettings>
    <HeatMapXAxis Labels="@XAxisLabels"></HeatMapXAxis>
    <HeatMapYAxis Labels="@YAxisLabels"></HeatMapYAxis>
    <HeatMapLegendSettings Visible="false"></HeatMapLegendSettings>
    <HeatMapCellSettings Format="{value} %" TileType="CellType.Bubble" BubbleType="BubbleType.SizeAndColor">
        <HeatMapCellBorder Width="0">
        </HeatMapCellBorder>
        <HeatMapCellTextStyle Color="White"></HeatMapCellTextStyle>
    </HeatMapCellSettings>
    <HeatMapDataSourceSettings IsJsonData="false" AdaptorType="AdaptorType.Cell"></HeatMapDataSourceSettings>
    <HeatMapPaletteSettings Type="PaletteType.Gradient">
        <HeatMapPalettes>
            <HeatMapPalette Color="#3498DB"></HeatMapPalette>
            <HeatMapPalette Color="#2C3E50"></HeatMapPalette>
        </HeatMapPalettes>
    </HeatMapPaletteSettings>
</SfHeatMap>

@code {
    double[,] GetDefaultData()
    {
        double[,] dataSource = new double[,]
            {

                {0, 0, 10.75 }, {0, 1, 14.5 }, {0, 2, 25.5 }, {0, 3, 39.5 }, {0, 4, 59.75 }, {0, 5, 35.50 }, {0, 6, 75.5 },

                {1, 0, 20.75 }, {1, 1, 35.5 }, {1, 2, 29.5 }, {1, 3, 75.5 }, {1, 4, 80 }, {1, 5, 65 }, {1, 6, 85 },

                { 2, 0, 6}, {2, 1, 18.5 }, {2, 2, 30.05 }, {2, 3, 35.5 }, {2, 4, 40.75 }, {2, 5, 50.75 }, {2, 6, 65 },

                {3, 0, 30.5 }, {3, 1, 20.5 }, {3, 2, 45.30 }, {3, 3, 50 }, {3, 4, 55 }, {3, 5, 85.80 }, {3, 6, 87.5 },

                {4, 0, 10.5 }, {4, 1, 20.75 }, {4, 2, 35.5 }, {4, 3, 35.5 }, {4, 4, 45.5 }, {4, 5, 65}, {4, 6, 75.5 },

                {5, 0, 45.5 }, {5, 1, 20.75}, {5, 2, 45.5}, {5, 3, 50.75}, {5, 4, 79.30}, {5, 5, 84.20}, {5, 6, 87.36},

                {6, 0, 26.82 }, {6, 1, 70 }, {6, 2, 75 }, {6, 3, 79.5 }, {6, 4, 88.5 }, {6, 5, 89.5 }, {6, 6, 91.75 },

                {7, 0, 15.75 }, {7, 1, 20.75}, {7, 2, 25.5}, {7, 3, 42.35}, {7, 4, 45.15}, {7, 5, 76.5}, {7, 6, 80.5},

                {8, 0, 1.98 }, {8, 1, 15.23 }, {8, 2, 43 }, {8, 3, 49 }, {8, 4, 63.80 }, {8, 5, 67.97 }, {8, 6, 70.52 },

                {9, 0, 14.31 }, {9, 1, 42.87}, {9, 2, 77.28}, {9, 3, 77.82}, {9, 4, 81.44}, {9, 5, 81.92}, {9, 6, 83.75},

                {10, 0, 25.5 }, {10, 1, 35.5 }, {10, 2, 40.5 }, {10, 3, 45.05 }, {10, 4, 50.5 }, {10, 5, 75.5 }, {10, 6, 90.58 }
            };
        return dataSource;
    }
    string[] XAxisLabels = new string[] { "China", "Australia", "Mexico", "Canada", "Brazil", "USA", "UK" , "Germany", "Russia", "France", "Japan" };
    string[] YAxisLabels = new string[] { "2000", "2005", "2010", "2011", "2012", "2013", "2014" };
    public object HeatMapData { get; set; }
    protected override void OnInitialized()
    {
        HeatMapData = GetDefaultData();
    }
}
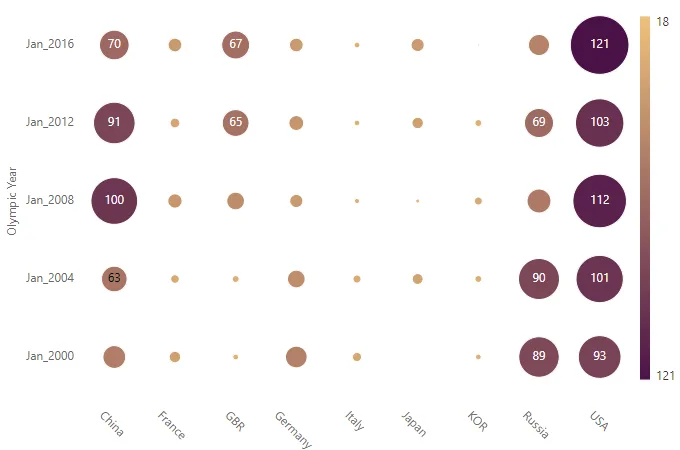
JSON binding
When a list of JSON objects are specified as DataSource, the bubble HeatMap can be rendered with different sizes and colors depending on the bound data.
Table
The following example illustrates how to render a bubble HeatMap with different sizes and colors using JSON table binding.
@using Syncfusion.Blazor.HeatMap

<SfHeatMap DataSource="@HeatMapData">
    <HeatMapTitleSettings Text="Olympic Medal Achievements of most Successful Countries">
        <HeatMapTitleTextStyle Size="15px" FontWeight="500" FontStyle="Normal" FontFamily="Segoe UI"></HeatMapTitleTextStyle>
    </HeatMapTitleSettings>
    <HeatMapDataSourceSettings IsJsonData="true" AdaptorType="AdaptorType.Table" XDataMapping="Region"></HeatMapDataSourceSettings>
    <HeatMapXAxis Labels="@XLabels" LabelRotation="45" LabelIntersectAction="LabelIntersectAction.None"></HeatMapXAxis>
    <HeatMapYAxis Labels="@YLabels">
        <HeatMapYAxisTitle Text="Olympic Year"></HeatMapYAxisTitle>
    </HeatMapYAxis>
    <HeatMapPaletteSettings>
        <HeatMapPalettes>
            <HeatMapPalette Color="#F0C27B"></HeatMapPalette>
            <HeatMapPalette Color="#4B1248"></HeatMapPalette>
        </HeatMapPalettes>
    </HeatMapPaletteSettings>
    <HeatMapCellSettings TileType="CellType.Bubble" BubbleType="BubbleType.SizeAndColor">
        <HeatMapCellBorder Width="1" Radius="4" Color="White"></HeatMapCellBorder>
    </HeatMapCellSettings>
</SfHeatMap>

@code
{
    public string[] XLabels = new string[] { "China", "France", "GBR", "Germany", "Italy", "Japan", "KOR", "Russia", "USA" };
    public string[] YLabels = new string[] { "Jan_2000", "Jan_2004", "Jan_2008", "Jan_2012", "Jan_2016" };
    public class RegionalData
    {
        public string Region { get; set; }
        public int? Jan_2000 { get; set; }
        public int? Jan_2004 { get; set; }
        public int? Jan_2008 { get; set; }
        public int? Jan_2012 { get; set; }
        public int? Jan_2016 { get; set; }
    }
    public RegionalData[] HeatMapData = new RegionalData[]{
        new RegionalData {Region = "USA", Jan_2000 = 93,Jan_2004 = 101,Jan_2008 = 112,Jan_2012 = 103,Jan_2016 = 121 },
        new RegionalData {Region = "GBR", Jan_2000 = 28,Jan_2004 = 30,Jan_2008 = 49,Jan_2012 = 65,Jan_2016 = 67 },
        new RegionalData {Region = "China", Jan_2000 = 58,Jan_2004 = 63,Jan_2008 = 100,Jan_2012 = 91,Jan_2016 = 70 },
        new RegionalData {Region = "Russia", Jan_2000 = 89,Jan_2004 = 90,Jan_2008 = 60,Jan_2012 = 69,Jan_2016 = 55 },
        new RegionalData {Region = "Germany", Jan_2000 = 56,Jan_2004 = 49,Jan_2008 = 41,Jan_2012 = 44,Jan_2016 = 42 },
        new RegionalData {Region = "Japan", Jan_2000 = 18,Jan_2004 = 37,Jan_2008 = 25,Jan_2012 = 38,Jan_2016 = 41 },
        new RegionalData {Region = "France", Jan_2000 = 38,Jan_2004 = 33,Jan_2008 = 43,Jan_2012 = 35,Jan_2016 = 42 },
        new RegionalData {Region = "KOR", Jan_2000 = 28,Jan_2004 = 30,Jan_2008 = 32,Jan_2012 = 30,Jan_2016 = 21 },
        new RegionalData {Region = "Italy", Jan_2000 = 34,Jan_2004 = 32,Jan_2008 = 27,Jan_2012 = 28,Jan_2016 = 28 }
    };
}
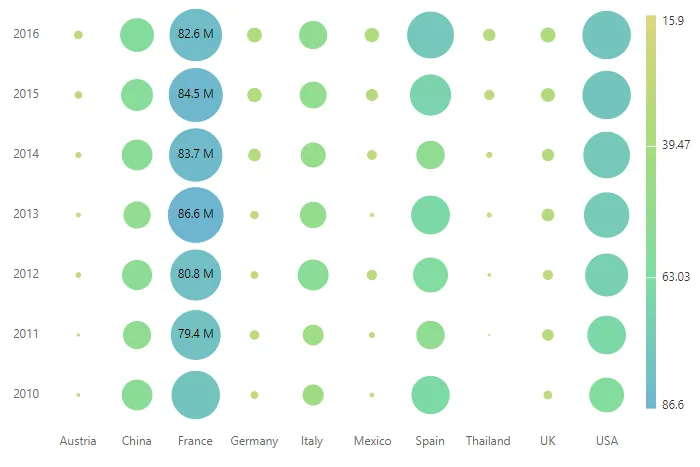
Cell
The following example illustrates how to render a bubble HeatMap with different sizes and colors using JSON cell binding.
@using Syncfusion.Blazor.HeatMap

<SfHeatMap DataSource="@HeatMapData">
    <HeatMapTitleSettings Text="Most Visited Destinations by International Tourist Arrivals">
        <HeatMapTitleTextStyle Size="15px" FontWeight="500" FontStyle="Normal" FontFamily="Segoe UI"></HeatMapTitleTextStyle>
    </HeatMapTitleSettings>
    <HeatMapDataSourceSettings IsJsonData="true" AdaptorType="AdaptorType.Cell" XDataMapping="RowId" YDataMapping="ColumnId" ValueMapping="Value"></HeatMapDataSourceSettings>
    <HeatMapXAxis Labels="@XLabels"></HeatMapXAxis>
    <HeatMapYAxis Labels="@YLabels"></HeatMapYAxis>
    <HeatMapPaletteSettings>
        <HeatMapPalettes>
            <HeatMapPalette Color="#DCD57E"></HeatMapPalette>
            <HeatMapPalette Color="#A6DC7E"></HeatMapPalette>
            <HeatMapPalette Color="#7EDCA2"></HeatMapPalette>
            <HeatMapPalette Color="#6EB5D0"></HeatMapPalette>
        </HeatMapPalettes>
    </HeatMapPaletteSettings>
    <HeatMapCellSettings ShowLabel="true" Format="{value} M" TileType="CellType.Bubble" BubbleType="BubbleType.SizeAndColor">
        <HeatMapCellBorder Width="1" Radius="4" Color="White"></HeatMapCellBorder>
    </HeatMapCellSettings>
</SfHeatMap>

@code {
    public string[] XLabels = new string[] { "Austria", "China", "France", "Germany", "Italy", "Mexico", "Spain", "Thailand", "UK", "USA" };
    public string[] YLabels = new string[] { "2010", "2011", "2012", "2013", "2014", "2015", "2016" };
    public class SampleData
    {
        public string RowId { get; set; }
        public string ColumnId { get; set; }
        public string Value { get; set; }
    }
    public SampleData[] HeatMapData = new SampleData[] {
        new SampleData  { RowId= "France", ColumnId= "2010", Value= "77.6" },
        new SampleData  { RowId= "France", ColumnId= "2011", Value= "79.4" },
        new SampleData  { RowId= "France", ColumnId= "2012", Value= "80.8" },
        new SampleData  { RowId= "France", ColumnId= "2013", Value= "86.6" },
        new SampleData  { RowId= "France", ColumnId= "2014", Value= "83.7" },
        new SampleData  { RowId= "France", ColumnId= "2015", Value= "84.5" },
        new SampleData  { RowId= "France", ColumnId= "2016", Value= "82.6" },
        new SampleData  { RowId= "USA", ColumnId= "2010", Value= "60.6" },
        new SampleData  { RowId= "USA", ColumnId= "2014", Value= "75.3" },
        new SampleData  { RowId= "USA", ColumnId= "2011", Value= "65.4" },
        new SampleData  { RowId= "USA", ColumnId= "2012", Value= "70.8" },
        new SampleData  { RowId= "USA", ColumnId= "2012", Value= "70.8" },
        new SampleData  { RowId= "USA", ColumnId= "2013", Value= "73.8" },
        new SampleData  { RowId= "USA", ColumnId= "2014", Value= "75.3" },
        new SampleData  { RowId= "USA", ColumnId= "2015", Value= "77.5" },
        new SampleData  { RowId= "USA", ColumnId= "2016", Value= "77.6" },
        new SampleData  { RowId= "Spain", ColumnId= "2010", Value= "64.9" },
        new SampleData  { RowId= "Spain", ColumnId= "2011", Value= "52.6" },
        new SampleData  { RowId= "Spain", ColumnId= "2012", Value= "60.8" },
        new SampleData  { RowId= "Spain", ColumnId= "2013", Value= "65.6" },
        new SampleData  { RowId= "Spain", ColumnId= "2014", Value= "52.6" },
        new SampleData  { RowId= "Spain", ColumnId= "2015", Value= "68.5" },
        new SampleData  { RowId= "Spain", ColumnId= "2016", Value= "75.6" },
        new SampleData  { RowId= "China", ColumnId= "2010", Value= "55.6" },
        new SampleData  { RowId= "China", ColumnId= "2011", Value= "52.3" },
        new SampleData  { RowId= "China", ColumnId= "2012", Value= "54.8" },
        new SampleData  { RowId= "China", ColumnId= "2013", Value= "51.1" },
        new SampleData  { RowId= "China", ColumnId= "2014", Value= "55.6" },
        new SampleData  { RowId= "China", ColumnId= "2015", Value= "56.9" },
        new SampleData  { RowId= "China", ColumnId= "2016", Value= "59.3" },
        new SampleData  { RowId= "Italy", ColumnId= "2010", Value= "43.6" },
        new SampleData  { RowId= "Italy", ColumnId= "2011", Value= "43.2" },
        new SampleData  { RowId= "Italy", ColumnId= "2012", Value= "55.8" },
        new SampleData  { RowId= "Italy", ColumnId= "2013", Value= "50.1" },
        new SampleData  { RowId= "Italy", ColumnId= "2014", Value= "48.5" },
        new SampleData  { RowId= "Italy", ColumnId= "2015", Value= "50.7" },
        new SampleData  { RowId= "Italy", ColumnId= "2016", Value= "52.4" },
        new SampleData  { RowId= "UK", ColumnId= "2010", Value= "28.2" },
        new SampleData  { RowId= "UK", ColumnId= "2011", Value= "31.6" },
        new SampleData  { RowId= "UK", ColumnId= "2012", Value= "29.8" },
        new SampleData  { RowId= "UK", ColumnId= "2013", Value= "33.1" },
        new SampleData  { RowId= "UK", ColumnId= "2014", Value= "32.6" },
        new SampleData  { RowId= "UK", ColumnId= "2015", Value= "34.4" },
        new SampleData  { RowId= "UK", ColumnId= "2016", Value= "35.8" },
        new SampleData  { RowId= "Germany", ColumnId= "2010", Value= "26.8" },
        new SampleData  { RowId= "Germany", ColumnId= "2011", Value= "29" },
        new SampleData  { RowId= "Germany", ColumnId= "2012", Value= "26.8" },
        new SampleData  { RowId= "Germany", ColumnId= "2013", Value= "27.6" },
        new SampleData  { RowId= "Germany", ColumnId= "2014", Value= "33" },
        new SampleData  { RowId= "Germany", ColumnId= "2015", Value= "35" },
        new SampleData  { RowId= "Germany", ColumnId= "2016", Value= "35.6" },
        new SampleData  { RowId= "Mexico", ColumnId= "2010", Value= "23.2" },
        new SampleData  { RowId= "Mexico", ColumnId= "2011", Value= "24.9" },
        new SampleData  { RowId= "Mexico", ColumnId= "2012", Value= "30.1" },
        new SampleData  { RowId= "Mexico", ColumnId= "2013", Value= "22.2" },
        new SampleData  { RowId= "Mexico", ColumnId= "2014", Value= "29.3" },
        new SampleData  { RowId= "Mexico", ColumnId= "2015", Value= "32.1" },
        new SampleData  { RowId= "Mexico", ColumnId= "2016", Value= "35" },
        new SampleData  { RowId= "Thailand", ColumnId= "2010", Value= "15.9" },
        new SampleData  { RowId= "Thailand", ColumnId= "2011", Value= "19.8" },
        new SampleData  { RowId= "Thailand", ColumnId= "2012", Value= "21.8" },
        new SampleData  { RowId= "Thailand", ColumnId= "2013", Value= "23.5" },
        new SampleData  { RowId= "Thailand", ColumnId= "2014", Value= "24.8" },
        new SampleData  { RowId= "Thailand", ColumnId= "2015", Value= "29.9" },
        new SampleData  { RowId= "Thailand", ColumnId= "2016", Value= "32.6" },
        new SampleData  { RowId= "Austria", ColumnId= "2010", Value= "22" },
        new SampleData  { RowId= "Austria", ColumnId= "2011", Value= "21.3" },
        new SampleData  { RowId= "Austria", ColumnId= "2012", Value= "24.2" },
        new SampleData  { RowId= "Austria", ColumnId= "2013", Value= "23.2" },
        new SampleData  { RowId= "Austria", ColumnId= "2014", Value= "25" },
        new SampleData  { RowId= "Austria", ColumnId= "2015", Value= "26.7" },
        new SampleData  { RowId= "Austria", ColumnId= "2016", Value= "28.1" }
    };
}
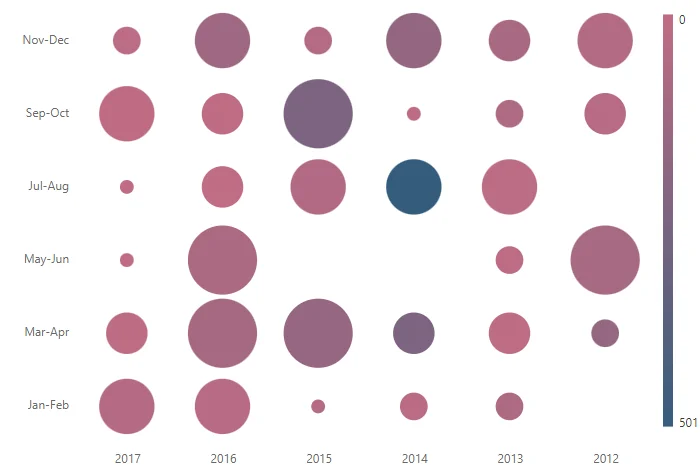
Binding size and color values from datasource
The size and color of the bubbles in the SizeAndColor bubble HeatMap type can be customized by binding the datasource field name that holds the size and color values to the Size and Color properties in the HeatMapBubbleDataMapping.
The
HeatMapBubbleDataMappingsupports only for the JSON data with cell adaptor type.
@using Syncfusion.Blazor.HeatMap

<SfHeatMap DataSource="@HeatMapData">
                <HeatMapEvents TooltipRendering="@TooltipRendering"></HeatMapEvents>
                <HeatMapXAxis Labels="@XLabels"></HeatMapXAxis>
                <HeatMapYAxis Labels="@YLabels"></HeatMapYAxis>
                <HeatMapDataSourceSettings IsJsonData="true" AdaptorType="AdaptorType.Cell" XDataMapping="Year" YDataMapping="Months">
                    <HeatMapBubbleDataMapping Size="Accidents" Color="Fatalities"></HeatMapBubbleDataMapping>
                </HeatMapDataSourceSettings>
                <HeatMapCellSettings ShowLabel="false" TileType="CellType.Bubble" BubbleType="BubbleType.SizeAndColor">
                    <HeatMapCellBorder Width="0"></HeatMapCellBorder>
                </HeatMapCellSettings>
                <HeatMapPaletteSettings Type="PaletteType.Gradient">
                    <HeatMapPalettes>
                        <HeatMapPalette Color="#C06C84"></HeatMapPalette>
                        <HeatMapPalette Color="#355C7D"></HeatMapPalette>
                    </HeatMapPalettes>
                </HeatMapPaletteSettings>
                <HeatMapLegendSettings Visible="true"></HeatMapLegendSettings>
                <HeatMapTooltipSettings Enable="true">
                    <HeatMapFont Size="12px" FontWeight="500"></HeatMapFont>
                </HeatMapTooltipSettings>
            </SfHeatMap>

@code{
    public string[] XLabels = new string[] { "2017", "2016", "2015", "2014", "2013", "2012" };
    public string[] YLabels = new string[] { "Jan-Feb", "Mar-Apr", "May-Jun", "Jul-Aug", "Sep-Oct", "Nov-Dec" };
    public void TooltipRendering(TooltipEventArgs args)
    {
        int dataIndex = 0;
        for (int i = 0; i < HeatMapData.Count; i++)
        {
            if (HeatMapData[i].Year == args.XLabel && HeatMapData[i].Months == args.YLabel)
            {
                dataIndex = i;
                break;
            }
        }
        args.Content = new string[] { "Year " + " : " + args.XLabel + "<br/>" + "Months " + " : " + args.YLabel + "<br/>" + "Accidents " + " : " + HeatMapData[dataIndex].Accidents +
        "<br/>" + "Fatalities " + " : " + HeatMapData[dataIndex].Fatalities };
    }
    public List<BubbleDataSource> HeatMapData { get; set; }
    public class BubbleDataSource
    {
        public string Year { get; set; }
        public string Months { get; set; }
        public Nullable<int> Accidents { get; set; }
        public Nullable<int> Fatalities { get; set; }
        public static List<BubbleDataSource> GetData()
        {
            List<BubbleDataSource> HeatMapData = new List<BubbleDataSource>()
            {
                new BubbleDataSource { Year = "2017", Months = "Jan-Feb", Accidents=4, Fatalities=39 },
                new BubbleDataSource { Year = "2017", Months = "Mar-Apr", Accidents=3, Fatalities=8 },
                new BubbleDataSource { Year = "2017", Months = "May-Jun", Accidents=1, Fatalities=3 },
                new BubbleDataSource { Year = "2017", Months = "Jul-Aug", Accidents=1, Fatalities=0 },
                new BubbleDataSource { Year = "2017", Months = "Sep-Oct", Accidents=4, Fatalities=4 },
                new BubbleDataSource { Year = "2017", Months = "Nov-Dec", Accidents=2, Fatalities=15 },
                new BubbleDataSource { Year = "2016", Months = "Jan-Feb", Accidents=4, Fatalities=28 },
                new BubbleDataSource { Year = "2016", Months = "Mar-Apr", Accidents=5, Fatalities=92 },
                new BubbleDataSource { Year = "2016", Months = "May-Jun", Accidents=5, Fatalities=73 },
                new BubbleDataSource { Year = "2016", Months = "Jul-Aug", Accidents=3, Fatalities=1 },
                new BubbleDataSource { Year = "2016", Months = "Sep-Oct", Accidents=3, Fatalities=4 },
                new BubbleDataSource { Year = "2016", Months = "Nov-Dec", Accidents=4, Fatalities=126 },
                new BubbleDataSource { Year = "2015", Months = "Jan-Feb", Accidents=1, Fatalities=45 },
                new BubbleDataSource { Year = "2015", Months = "Mar-Apr", Accidents=5, Fatalities=152 },
                new BubbleDataSource { Year = "2015", Months = "May-Jun", Accidents=0, Fatalities=0 },
                new BubbleDataSource { Year = "2015", Months = "Jul-Aug", Accidents=4, Fatalities=54 },
                new BubbleDataSource { Year = "2015", Months = "Sep-Oct", Accidents=5, Fatalities=243 },
                new BubbleDataSource { Year = "2015", Months = "Nov-Dec", Accidents=2, Fatalities=45 },
                new BubbleDataSource { Year = "2014", Months = "Jan-Feb", Accidents=2, Fatalities=18 },
                new BubbleDataSource { Year = "2014", Months = "Mar-Apr", Accidents=3, Fatalities=239 },
                new BubbleDataSource { Year = "2014", Months = "May-Jun", Accidents=0, Fatalities=0 },
                new BubbleDataSource { Year = "2014", Months = "Jul-Aug", Accidents=4, Fatalities=501 },
                new BubbleDataSource { Year = "2014", Months = "Sep-Oct", Accidents=1, Fatalities=2 },
                new BubbleDataSource { Year = "2014", Months = "Nov-Dec", Accidents=4, Fatalities=162 },
                new BubbleDataSource { Year = "2013", Months = "Jan-Feb", Accidents=2, Fatalities=68 },
                new BubbleDataSource { Year = "2013", Months = "Mar-Apr", Accidents=3, Fatalities=7 },
                new BubbleDataSource { Year = "2013", Months = "May-Jun", Accidents=2, Fatalities=12 },
                new BubbleDataSource { Year = "2013", Months = "Jul-Aug", Accidents=4, Fatalities=15 },
                new BubbleDataSource { Year = "2013", Months = "Sep-Oct", Accidents=2, Fatalities=64 },
                new BubbleDataSource { Year = "2013", Months = "Nov-Dec", Accidents=3, Fatalities=83 },
                new BubbleDataSource { Year = "2012", Months = "Jan-Feb", Accidents=0, Fatalities=0 },
                new BubbleDataSource { Year = "2012", Months = "Mar-Apr", Accidents=2, Fatalities=158 },
                new BubbleDataSource { Year = "2012", Months = "May-Jun", Accidents=5, Fatalities=90 },
                new BubbleDataSource { Year = "2012", Months = "Jul-Aug", Accidents=0, Fatalities=0 },
                new BubbleDataSource { Year = "2012", Months = "Sep-Oct", Accidents=3, Fatalities=33 },
                new BubbleDataSource { Year = "2012", Months = "Nov-Dec", Accidents=4, Fatalities=42 }
            };
            return HeatMapData;
        }
    }
    protected override void OnInitialized()
    {
        this.HeatMapData = BubbleDataSource.GetData();

    }
}