Appearance in Blazor Stock Chart Component
29 Jul 20264 minutes to read
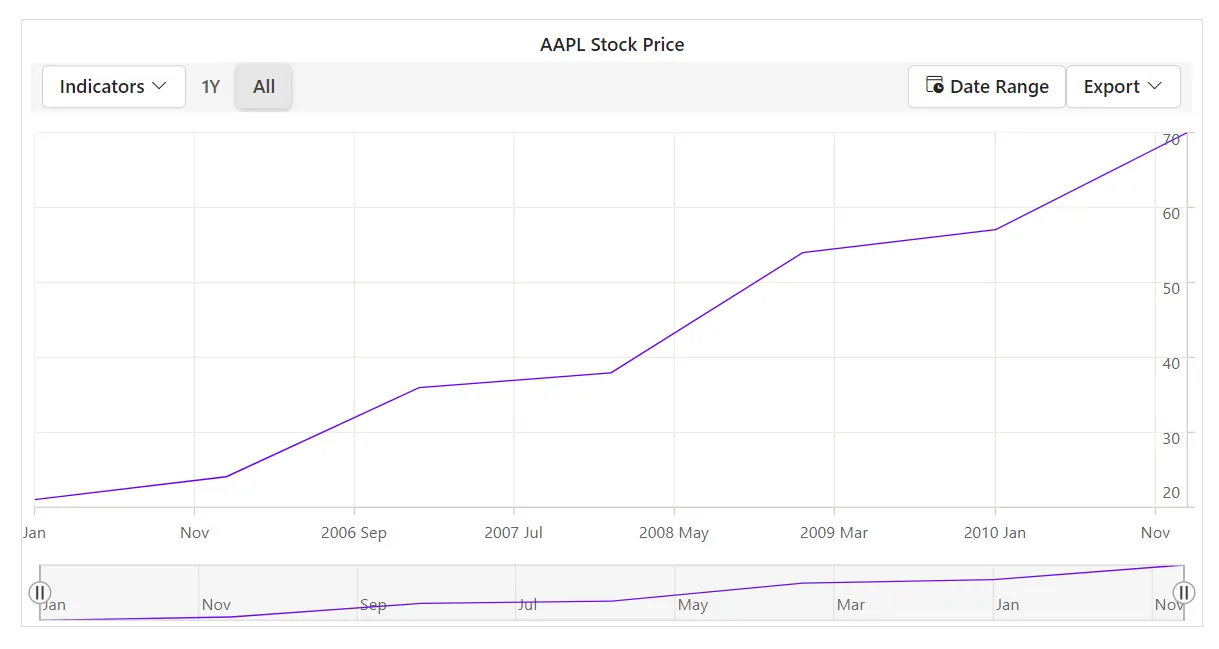
Stock Chart Title
Set a chart title using the Title property to provide context for the plotted data.
@using Syncfusion.Blazor.Charts

<SfStockChart Title="AAPL Stock Price">
    <StockChartSeriesCollection>
        <StockChartSeries DataSource="@DataSource" Type="ChartSeriesType.Line" XName="XValue" YName="YValue"></StockChartSeries>
    </StockChartSeriesCollection>
    <StockChartPeriods>
        <StockChartPeriod Text="1Y"></StockChartPeriod>
        <StockChartPeriod Text="All" Selected="true"></StockChartPeriod>
    </StockChartPeriods>
</SfStockChart>

@code {
    public class ChartData
    {
        public DateTime XValue { get; set; }
        public double YValue { get; set; }
    }

    public List<ChartData> DataSource = new List<ChartData>
    {
        new ChartData { XValue = new DateTime(2005, 01, 01), YValue = 21 },
        new ChartData { XValue = new DateTime(2006, 01, 01), YValue = 24 },
        new ChartData { XValue = new DateTime(2007, 01, 01), YValue = 36 },
        new ChartData { XValue = new DateTime(2008, 01, 01), YValue = 38 },
        new ChartData { XValue = new DateTime(2009, 01, 01), YValue = 54 },
        new ChartData { XValue = new DateTime(2010, 01, 01), YValue = 57 },
        new ChartData { XValue = new DateTime(2011, 01, 01), YValue = 70 }
    };
}
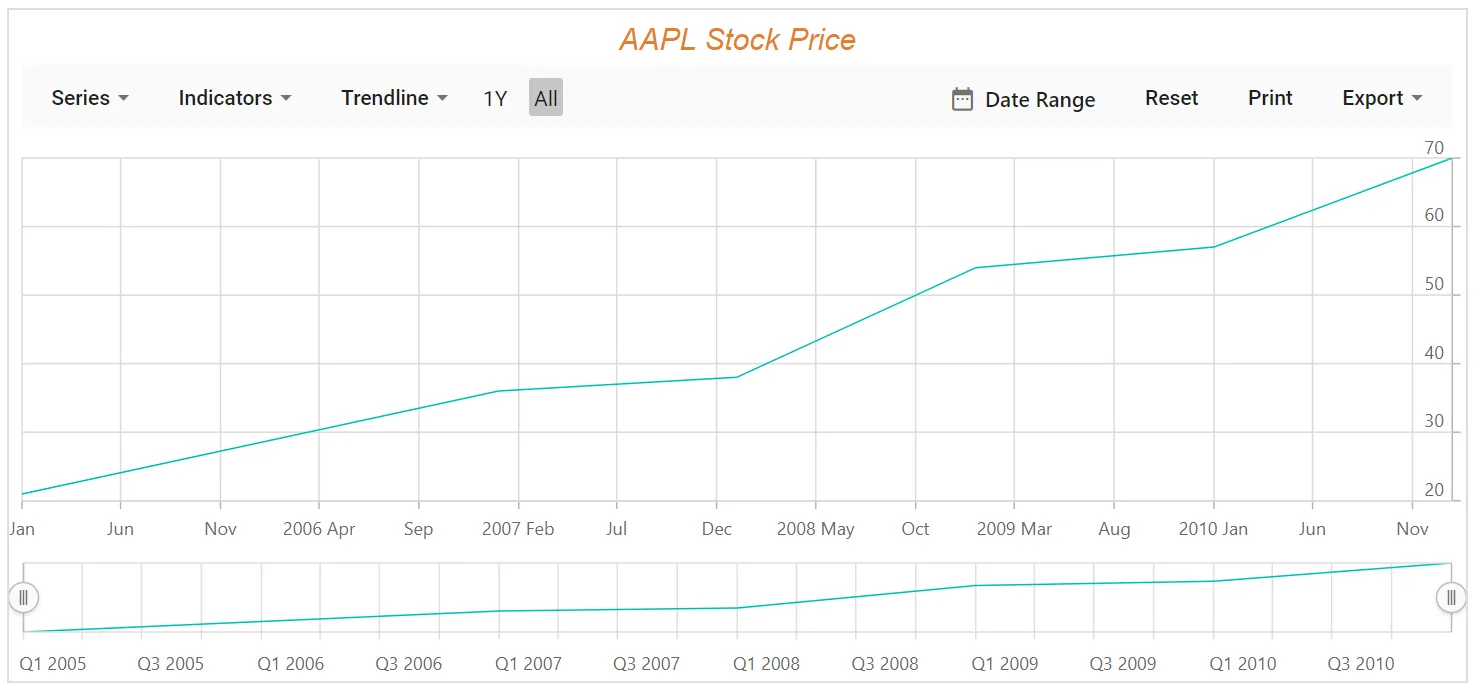
Title Customizations
The TextStyle property of the chart title provides options to customize Size, Color, FontFamily, FontWeight, FontStyle, Opacity, TextAlignment, and TextOverflow.
@using Syncfusion.Blazor.Charts

<SfStockChart Title="AAPL Stock Price">
    <StockChartTitleStyle FontFamily="Arial" FontStyle="Italic" FontWeight="Regular" Color="#E27F2D" Size="20px" TextOverflow="TextOverflow.Wrap"></StockChartTitleStyle>
    <StockChartSeriesCollection>
        <StockChartSeries DataSource="@DataSource" Type="ChartSeriesType.Line" XName="XValue" YName="YValue"></StockChartSeries>
    </StockChartSeriesCollection>
    <StockChartPeriods>
        <StockChartPeriod Text="1Y"></StockChartPeriod>
        <StockChartPeriod Text="All" Selected="true"></StockChartPeriod>
    </StockChartPeriods>
</SfStockChart>

@code {
    public class ChartData
    {
        public DateTime XValue { get; set; }
        public double YValue { get; set; }
    }

    public List<ChartData> DataSource = new List<ChartData>
    {
        new ChartData { XValue = new DateTime(2005, 01, 01), YValue = 21 },
        new ChartData { XValue = new DateTime(2006, 01, 01), YValue = 24 },
        new ChartData { XValue = new DateTime(2007, 01, 01), YValue = 36 },
        new ChartData { XValue = new DateTime(2008, 01, 01), YValue = 38 },
        new ChartData { XValue = new DateTime(2009, 01, 01), YValue = 54 },
        new ChartData { XValue = new DateTime(2010, 01, 01), YValue = 57 },
        new ChartData { XValue = new DateTime(2011, 01, 01), YValue = 70 }
    };
}
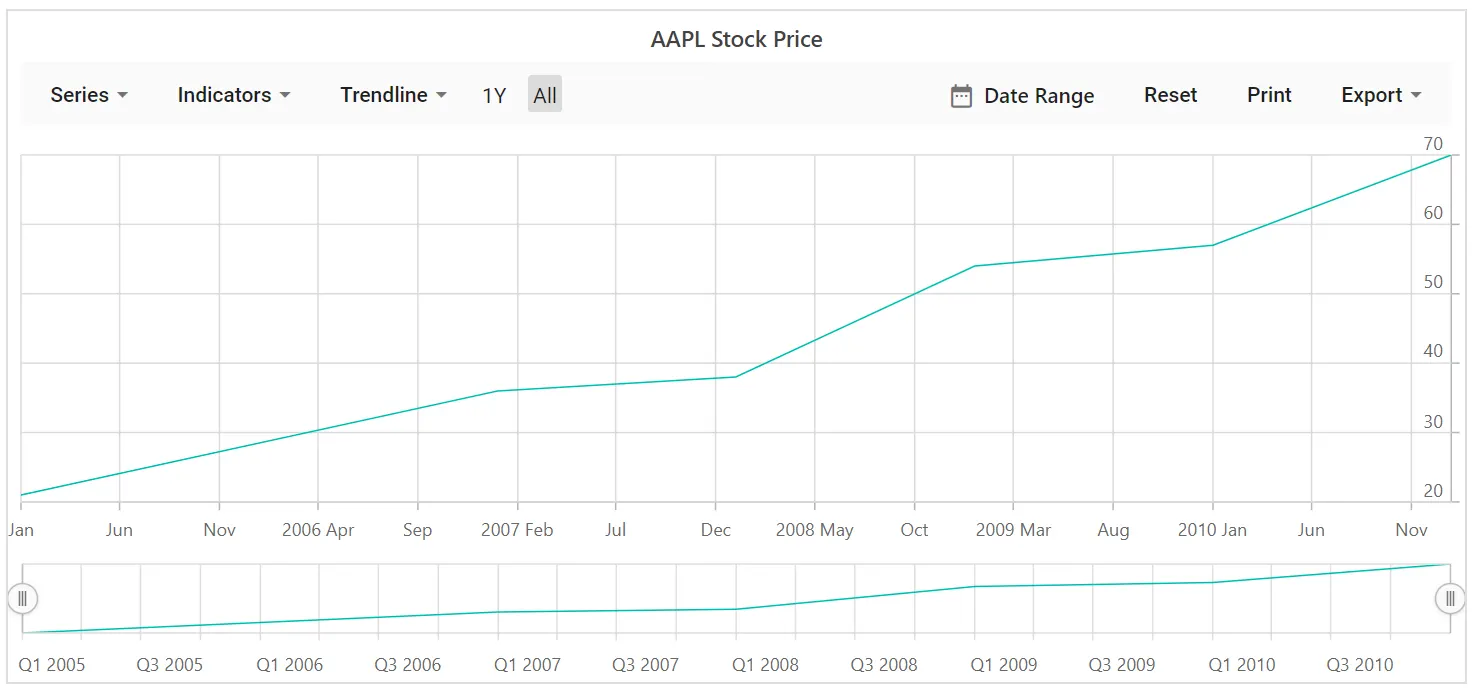
Stock Chart Theme
Changing the theme affects background color, gridlines, tooltip appearance, and overall styling.
Stock Chart includes several built-in themes such as Material, Fabric, Bootstrap, HighContrastLight, MaterialDark, FabricDark, HighContrast, and BootstrapDark.
@using Syncfusion.Blazor.Charts

<SfStockChart Title="AAPL Stock Price" Theme="Theme.Fluent2">
    <StockChartSeriesCollection>
        <StockChartSeries DataSource="@DataSource" Type="ChartSeriesType.Line" XName="XValue" YName="YValue"></StockChartSeries>
    </StockChartSeriesCollection>
    <StockChartPeriods>
        <StockChartPeriod Text="1Y"></StockChartPeriod>
        <StockChartPeriod Text="All" Selected="true"></StockChartPeriod>
    </StockChartPeriods>
</SfStockChart>

@code {
    public class ChartData
    {
        public DateTime XValue { get; set; }
        public double YValue { get; set; }
    }

    public List<ChartData> DataSource = new List<ChartData>
    {
        new ChartData { XValue = new DateTime(2005, 01, 01), YValue = 21 },
        new ChartData { XValue = new DateTime(2006, 01, 01), YValue = 24 },
        new ChartData { XValue = new DateTime(2007, 01, 01), YValue = 36 },
        new ChartData { XValue = new DateTime(2008, 01, 01), YValue = 38 },
        new ChartData { XValue = new DateTime(2009, 01, 01), YValue = 54 },
        new ChartData { XValue = new DateTime(2010, 01, 01), YValue = 57 },
        new ChartData { XValue = new DateTime(2011, 01, 01), YValue = 70 }
    };
}