Axis Types in Blazor Stock Chart Component
29 Jun 20267 minutes to read
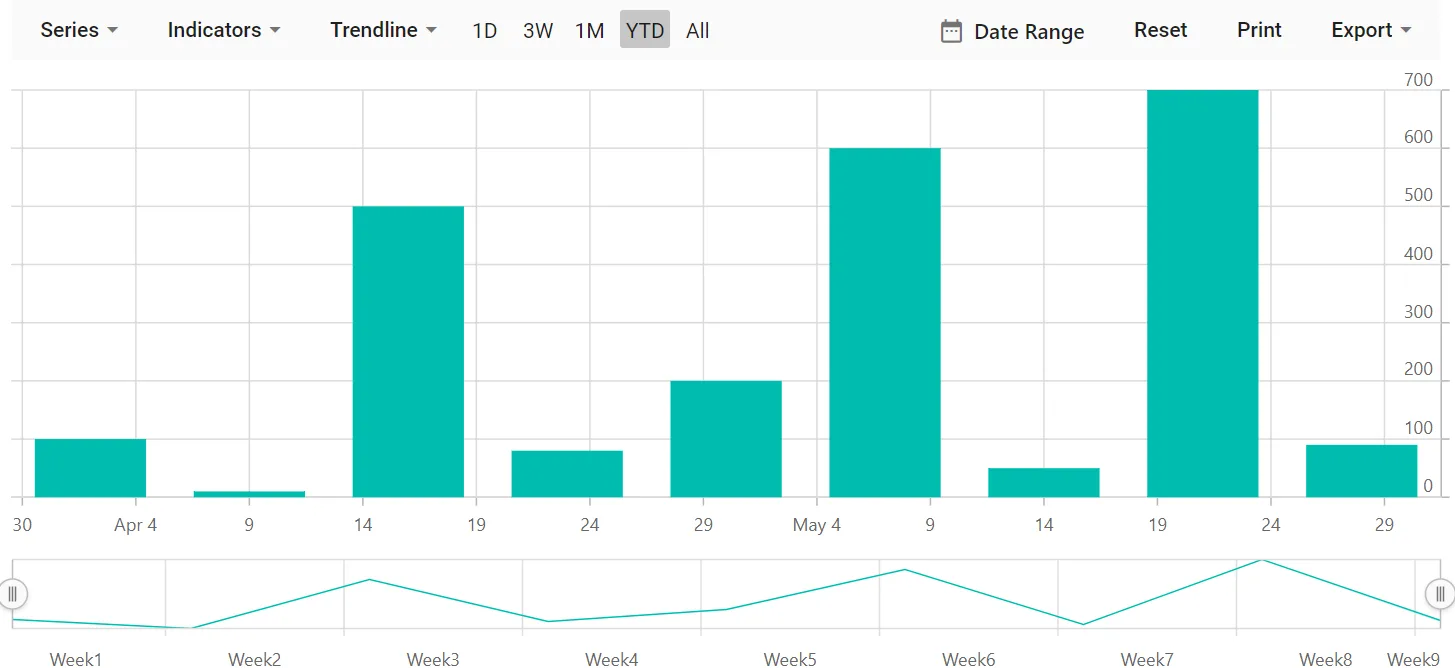
DateTime Axis
The DateTime axis uses a time-based scale and renders date-time values as axis labels in the specified format. Set the ValueType of the axis to DateTime.
@using Syncfusion.Blazor.Charts

<SfStockChart>
    <StockChartPrimaryXAxis ValueType="@Syncfusion.Blazor.Charts.ValueType.DateTime">
    </StockChartPrimaryXAxis>

    <StockChartSeriesCollection>
        <StockChartSeries DataSource="@StockDetails" Type="ChartSeriesType.Column" XName="Date" YName="Y">
        </StockChartSeries>
    </StockChartSeriesCollection>
</SfStockChart>

@code {
    public class ChartData
    {
        public DateTime Date { get; set; }
        public Double Y { get; set; }
    }

    public List<ChartData> StockDetails = new List<ChartData>
    {
        new ChartData { Date = new DateTime(2012, 04, 02), Y = 100 },
        new ChartData { Date = new DateTime(2012, 04, 09), Y = 10 },
        new ChartData { Date = new DateTime(2012, 04, 16), Y = 500 },
        new ChartData { Date = new DateTime(2012, 04, 23), Y = 80 },
        new ChartData { Date = new DateTime(2012, 04, 30), Y = 200 },
        new ChartData { Date = new DateTime(2012, 05, 07), Y = 600 },
        new ChartData { Date = new DateTime(2012, 05, 14), Y = 50 },
        new ChartData { Date = new DateTime(2012, 05, 21), Y = 700 },
        new ChartData { Date = new DateTime(2012, 05, 28), Y = 90}
   };
}
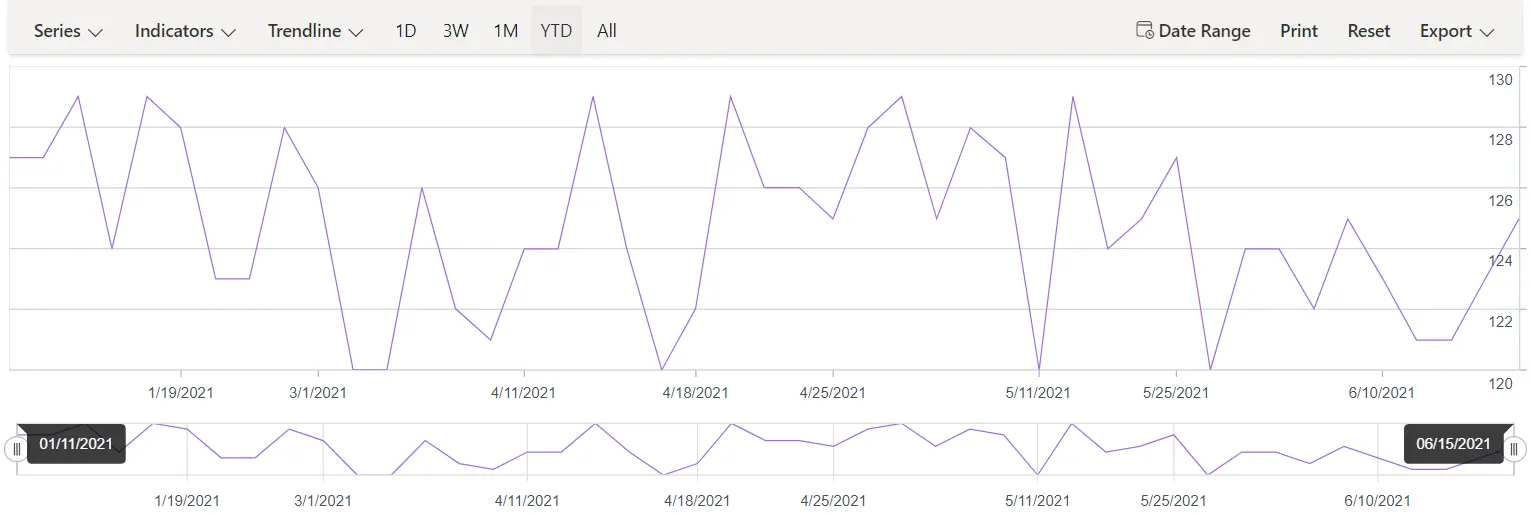
DateTimeCategory Axis
The DateTimeCategory axis displays only business days by skipping non-trading dates. To enable it, set the ValueType to DateTimeCategory.
@using Syncfusion.Blazor.Charts
@using System.Dynamic

<SfStockChart>
    <StockChartEvents SharedTooltipRendering="@TooltipText"></StockChartEvents>
    <StockChartPrimaryXAxis ValueType="@Syncfusion.Blazor.Charts.ValueType.DateTimeCategory">
        <StockChartAxisMajorGridLines Width="0"></StockChartAxisMajorGridLines>
        <StockChartAxisCrosshairTooltip Enable="true"></StockChartAxisCrosshairTooltip>
    </StockChartPrimaryXAxis>
    <StockChartTooltipSettings Enable="true" Header="AAPL Stock Price"></StockChartTooltipSettings>
    <StockChartCrosshairSettings Enable="true"></StockChartCrosshairSettings>
    <StockChartSeriesCollection>
        <StockChartSeries DataSource="@StockInfo" Type="ChartSeriesType.Line" XName="X"  YName="Y"></StockChartSeries>
    </StockChartSeriesCollection>
</SfStockChart>

@code {
    private List<DateTime> Dates = new List<DateTime>
    {
        new DateTime(2021, 01, 11), new DateTime(2021, 01, 12), new DateTime(2021, 01, 13), new DateTime(2021, 01, 14), new DateTime(2021, 01, 15),
        new DateTime(2021, 01, 19), new DateTime(2021, 01, 20), new DateTime(2021, 01, 21), new DateTime(2021, 01, 22), new DateTime(2021, 03, 01),
        new DateTime(2021, 03, 02), new DateTime(2021, 04, 01),new DateTime(2021, 04, 05), new DateTime(2021, 04, 06),new DateTime(2021, 04, 07),
        new DateTime(2021, 04, 11), new DateTime(2021, 04, 13), new DateTime(2021, 04, 15), new DateTime(2021, 04, 16), new DateTime(2021, 04, 17),
        new DateTime(2021, 04, 18), new DateTime(2021, 04, 20), new DateTime(2021, 04, 21), new DateTime(2021, 04, 23), new DateTime(2021, 04, 25),
        new DateTime(2021, 05, 01), new DateTime(2021, 05, 02), new DateTime(2021, 05, 06), new DateTime(2021, 05, 07),new DateTime(2021, 05, 08),
        new DateTime(2021, 05, 11), new DateTime(2021, 05, 15), new DateTime(2021, 05, 18), new DateTime(2021, 05, 20), new DateTime(2021, 05, 25),
        new DateTime(2021, 06, 01), new DateTime(2021, 06, 02), new DateTime(2021, 06, 03), new DateTime(2021, 06, 04),new DateTime(2021, 06, 05),
        new DateTime(2021, 06, 10), new DateTime(2021, 06, 11), new DateTime(2021, 06, 12), new DateTime(2021, 06, 13), new DateTime(2021, 06, 15),
        new DateTime(2021, 06, 16), new DateTime(2021, 06, 17), new DateTime(2021, 06, 18), new DateTime(2021, 06, 19), new DateTime(2021, 06, 20)
    };

    public DateTime[] Value = new DateTime[] { new DateTime(2021, 01, 01), new DateTime(2022, 01, 01) };
    public List<ExpandoObject> StockInfo { get; set; } = new List<ExpandoObject>();
    private Random randomNum = new Random();

    protected override void OnInitialized()
    {
        StockInfo = Enumerable.Range(0, 45).Select((x) =>
        {
            dynamic d = new ExpandoObject();
            d.X = Dates[x];
            d.Open = randomNum.Next(75, 85);
            d.High = randomNum.Next(88, 92);
            d.Low = randomNum.Next(76, 86);
            d.Close = randomNum.Next(85, 90);
            d.Volume = randomNum.Next(660187068, 965935749);
            d.Y = randomNum.Next(120, 130);
            return d;
        }).Cast<ExpandoObject>().ToList<ExpandoObject>();
    }

    public void TooltipText(SharedTooltipRenderEventArgs args)
    {
        if (args.Text[0] != null)
        {
            args.Text[0] = args.Text[0].Replace("00:00:00 AM", " ", StringComparison.InvariantCulture);
        }
    }
}
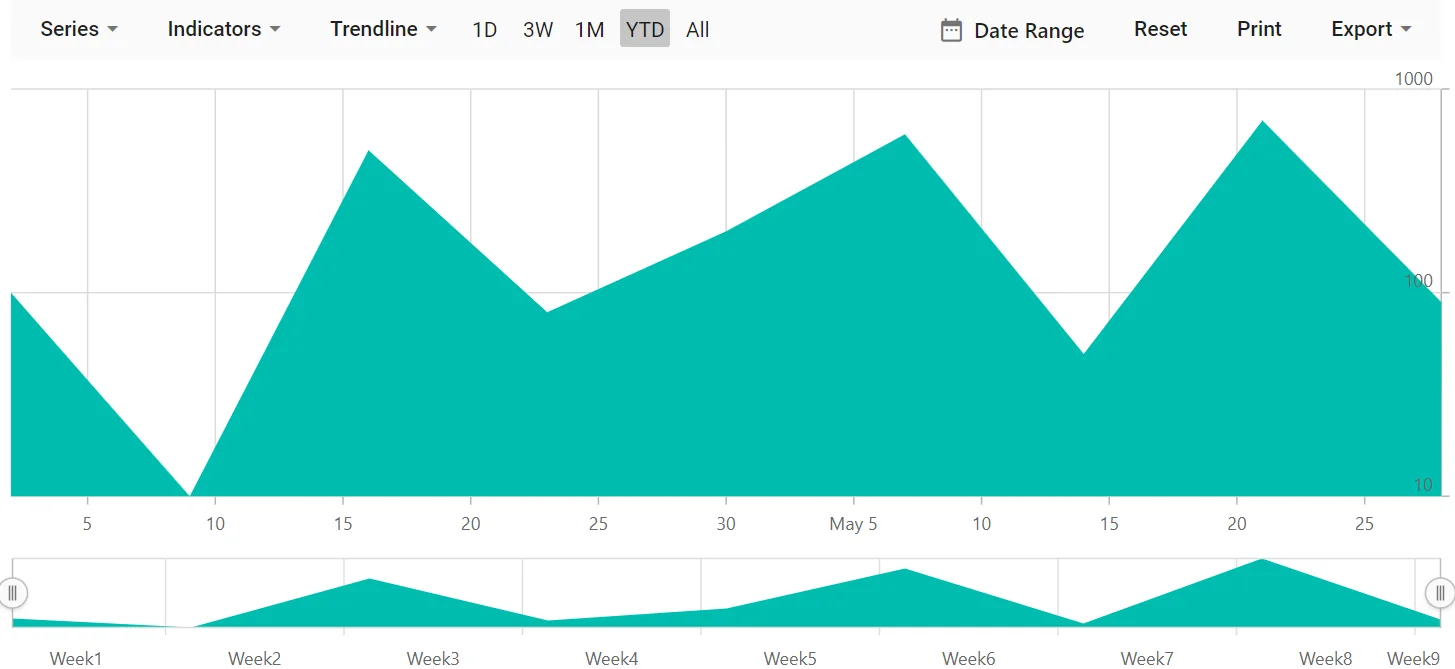
Logarithmic Axis
The Logarithmic axis uses a logarithmic scale and is useful when data spans multiple orders of magnitude (e.g., 10-6 to 106). Set the ValueType of the axis to Logarithmic.
@using Syncfusion.Blazor.Charts

<SfStockChart>
    <StockChartPrimaryXAxis ValueType="@Syncfusion.Blazor.Charts.ValueType.DateTime">
    </StockChartPrimaryXAxis>
    <StockChartPrimaryYAxis ValueType="@Syncfusion.Blazor.Charts.ValueType.Logarithmic">
    </StockChartPrimaryYAxis>
    <StockChartSeriesCollection>
        <StockChartSeries DataSource="@StockDetails" Type="ChartSeriesType.Area" XName="Date" YName="Y">
        </StockChartSeries>
    </StockChartSeriesCollection>
</SfStockChart>

@code {
    public class ChartData
    {
        public DateTime Date { get; set; }
        public Double Y { get; set; }
    }
    public List<ChartData> StockDetails = new List<ChartData>
    {
        new ChartData { Date = new DateTime(2012, 04, 02), Y = 100 },
        new ChartData { Date = new DateTime(2012, 04, 09), Y = 10 },
        new ChartData { Date = new DateTime(2012, 04, 16), Y = 500 },
        new ChartData { Date = new DateTime(2012, 04, 23), Y = 80 },
        new ChartData { Date = new DateTime(2012, 04, 30), Y = 200 },
        new ChartData { Date = new DateTime(2012, 05, 07), Y = 600 },
        new ChartData { Date = new DateTime(2012, 05, 14), Y = 50 },
        new ChartData { Date = new DateTime(2012, 05, 21), Y = 700 },
        new ChartData { Date = new DateTime(2012, 05, 28), Y = 90 }
   };
}