How can I help you?
Adaptive Layout in Blazor Accumulation Chart Component
10 Oct 20254 minutes to read
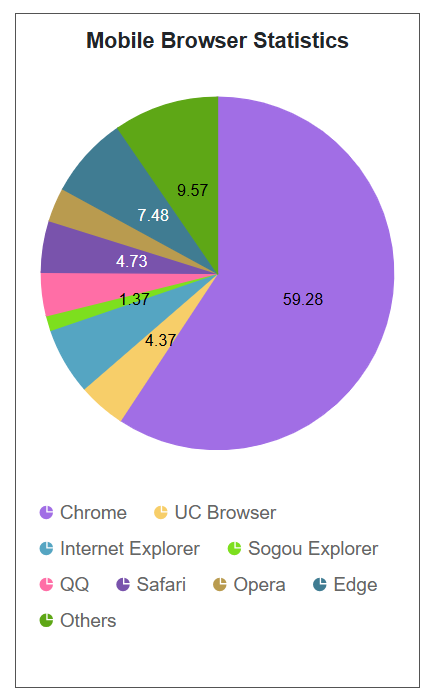
When viewing the accumulation chart on mobile devices, some elements may not display properly due to limited screen space. The Syncfusion® Accumulation Chart Adaptive Layout feature dynamically adjusts chart elements for optimal display based on screen size and orientation. Enable the EnableAdaptiveRendering property to allow the chart to automatically adapt to container size changes, ensuring clear alignment and visibility of elements such as the legend, data labels, chart title, and more.
@using Syncfusion.Blazor.Charts

<SfAccumulationChart Title="Mobile Browser Statistics" SubTitle="Browser and Users" EnableAdaptiveRendering="true" Width="300px" Height="400px">
    <AccumulationChartBorder Color="black" Width="1"></AccumulationChartBorder>
    <AccumulationChartSeriesCollection>
        <AccumulationChartSeries DataSource="@PieChartPoints" Explode="true" XName="Browser" YName="Users" Name="Browser" Type="AccumulationType.Pie">
            <AccumulationDataLabelSettings Visible="true" Position="AccumulationLabelPosition.Inside" Name="DataLabelMappingName"></AccumulationDataLabelSettings>
        </AccumulationChartSeries>
    </AccumulationChartSeriesCollection>
    <AccumulationChartTooltipSettings Enable="true"></AccumulationChartTooltipSettings>
    <AccumulationChartLegendSettings Visible="true" Position="LegendPosition.Right"></AccumulationChartLegendSettings>
</SfAccumulationChart>

@code {
    public class PieData
    {
        public string Browser { get; set; }
        public double Users { get; set; }
        public string DataLabelMappingName { get; set; }
    }

    public List<PieData> PieChartPoints { get; set; } = new List<PieData>
    {
        new PieData { Browser = "Chrome", Users = 59.28, DataLabelMappingName = "Chrome: 59.28%" },
        new PieData { Browser = "UC Browser", Users = 4.37, DataLabelMappingName = "UC Browser: 4.37%" },
        new PieData { Browser = "Internet Explorer", Users = 6.12, DataLabelMappingName = "Internet Explorer: 6 12%" },
        new PieData { Browser = "Sogou Explorer", Users = 1.37, DataLabelMappingName = "Sogou Explorer: 1.37%" },
        new PieData { Browser = "QQ", Users = 3.96, DataLabelMappingName = "QQ: 3.96%" },
        new PieData { Browser = "Safari", Users = 4.73, DataLabelMappingName = "Safari: 4.73%" },
        new PieData { Browser = "Opera", Users = 3.12, DataLabelMappingName = "Opera: 3.12%" },
        new PieData { Browser = "Edge", Users = 7.48, DataLabelMappingName = "Edge: 7.48%" },
        new PieData { Browser = "Others", Users = 9.57, DataLabelMappingName = "Others: 9.57%" }
    };
}
The table below outlines the behavior of chart elements under specific conditions determined by chart height and width:
| Element | Size | Behavior |
|---|---|---|
| Title | Height < 200 / Width < 200 | Accumulation chart title is disabled |
| Sutitle | Height < 300 / Width < 300 | Accumulation chart subtitle is disabled |
| Datalabel | Radius < 300 / Radius < 200 | Data label moves inside / Datalabel is disabled |
| Legend | Height < 300 / Width < 300 | Moves bottom or top legend to the right if width is greater than 200px; otherwise, disabled / Moves right or left legend to bottom if height is greater than 200px; otherwise, disabled |
NOTE
Refer to the Blazor Charts feature tour page for its groundbreaking feature representations and also explore the Blazor Accumulation Chart Example to know about the various features of accumulation charts and how it is used to represent numeric proportional data.