How can I help you?
Center Label in Blazor Pie and Donut Chart Component
10 Nov 20255 minutes to read
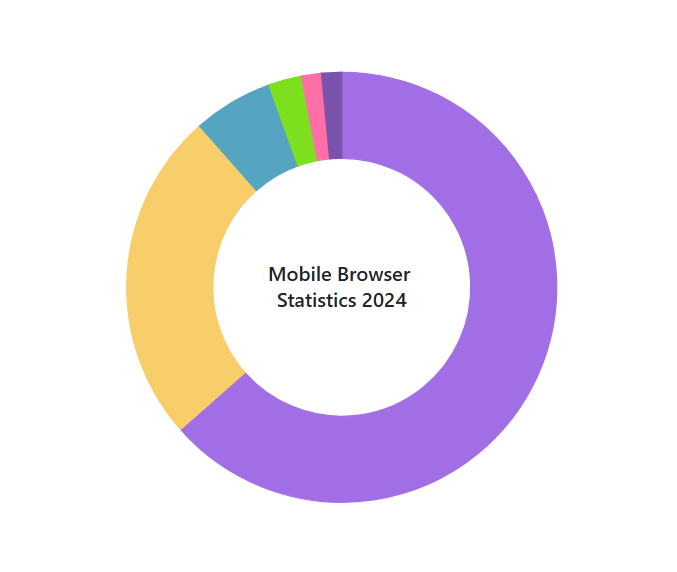
The center label feature allows you to place custom text in the middle of pie and donut charts using the AccumulationChartCenterLabel. This is especially useful for displaying the chart’s title, percentage distribution, or other key metrics pertinent to the visualized data.
You can configure the text that appears in the center using the Text property within the AccumulationChartCenterLabel.
@using Syncfusion.Blazor.Charts

<SfAccumulationChart>
    <AccumulationChartSeriesCollection>
        <AccumulationChartSeries DataSource="@DonutChartPoints" XName="Browser" YName="Users" InnerRadius="60%">
        </AccumulationChartSeries>
    </AccumulationChartSeriesCollection>
    <AccumulationChartCenterLabel Text="Mobile Browser<br>Statistics 2024">
    </AccumulationChartCenterLabel>
    <AccumulationChartLegendSettings Visible="false"></AccumulationChartLegendSettings>
</SfAccumulationChart>

@code {
    public List<DonutData> DonutChartPoints { get; set; } = new List<DonutData>
    {
        new DonutData { Browser = "Chrome", Users = 63.5, DataLabelMappingName = "Chrome: 63.5%"},
        new DonutData { Browser = "Safari", Users = 25.0, DataLabelMappingName = "Safari: 25.0%"},
        new DonutData { Browser = "Samsung Internet", Users = 6.0, DataLabelMappingName = "Samsung Internet: 6.0%"},
        new DonutData { Browser = "UC Browser", Users = 2.5, DataLabelMappingName = "UC Browser: 2.5%"},
        new DonutData { Browser = "Opera", Users = 1.5, DataLabelMappingName = "Opera: 1.5%"},
        new DonutData { Browser = "Others", Users = 1.5, DataLabelMappingName = "Others: 1.5%"}
    };
    public class DonutData
    {
        public string Browser { get; set; }
        public double Users { get; set; }
        public string DataLabelMappingName { get; set; }
    }
}
Hover Text
The center label text can be dynamically updated when hovering over pie or donut chart slices using the HoverTextFormat property. This interactive feature enhances user engagement by offering relevant information about specific segments during the exploration of the visualization.
NOTE
Line breaks can be provided to texts in the
HoverTextFormatproperty using the<br>tag.
@using Syncfusion.Blazor.Charts

<SfAccumulationChart>
    <AccumulationChartSeriesCollection>
        <AccumulationChartSeries DataSource="@DonutChartPoints" XName="Browser" YName="Users" InnerRadius="60%">
        </AccumulationChartSeries>
    </AccumulationChartSeriesCollection>
    <AccumulationChartCenterLabel Text="Mobile Browser<br>Statistics 2024" HoverTextFormat="${point.x} <br> Browser Share <br> ${point.y}%">
    </AccumulationChartCenterLabel>
    <AccumulationChartLegendSettings Visible="false"></AccumulationChartLegendSettings>
</SfAccumulationChart>

@code {
    public List<DonutData> DonutChartPoints { get; set; } = new List<DonutData>
    {
        new DonutData { Browser = "Chrome", Users = 63.5, DataLabelMappingName = "Chrome: 63.5%"},
        new DonutData { Browser = "Safari", Users = 25.0, DataLabelMappingName = "Safari: 25.0%"},
        new DonutData { Browser = "Samsung Internet", Users = 6.0, DataLabelMappingName = "Samsung Internet: 6.0%"},
        new DonutData { Browser = "UC Browser", Users = 2.5, DataLabelMappingName = "UC Browser: 2.5%"},
        new DonutData { Browser = "Opera", Users = 1.5, DataLabelMappingName = "Opera: 1.5%"},
        new DonutData { Browser = "Others", Users = 1.5, DataLabelMappingName = "Others: 1.5%"}
    };
    public class DonutData
    {
        public string Browser { get; set; }
        public double Users { get; set; }
        public string DataLabelMappingName { get; set; }
    }
}
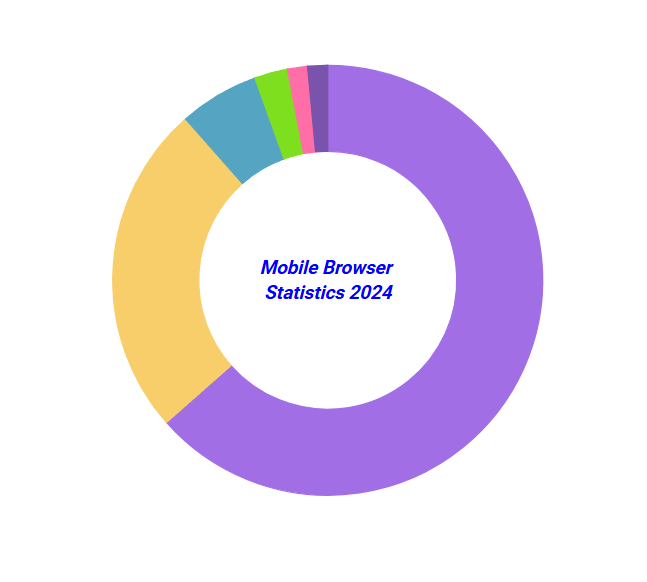
Customization
The appearance of the center label can be customized by using the AccumulationChartCenterLabelFont, which allows you to modify font properties such as size, font-family, font-style, font-weight, and color to enhance the visual presentation of the text displayed in the center of the chart.
The position of the center label can be adjusted using the XOffset and YOffset properties in the AccumulationChartCenterLabel.
@using Syncfusion.Blazor.Charts

<SfAccumulationChart>
    <AccumulationChartSeriesCollection>
        <AccumulationChartSeries DataSource="@DonutChartPoints" XName="Browser" YName="Users" InnerRadius="60%">
        </AccumulationChartSeries>
    </AccumulationChartSeriesCollection>
    <AccumulationChartCenterLabel Text="Mobile Browser<br>Statistics 2024">
        <AccumulationChartCenterLabelFont Size="15px" FontWeight="600" FontFamily="Roboto" fontStyle="Italic" Color="Blue" ></AccumulationChartCenterLabelFont>
    </AccumulationChartCenterLabel>
    <AccumulationChartLegendSettings Visible="false"></AccumulationChartLegendSettings>
</SfAccumulationChart>

@code {
    public List<DonutData> DonutChartPoints { get; set; } = new List<DonutData>
    {
        new DonutData { Browser = "Chrome", Users = 63.5, DataLabelMappingName = "Chrome: 63.5%"},
        new DonutData { Browser = "Safari", Users = 25.0, DataLabelMappingName = "Safari: 25.0%"},
        new DonutData { Browser = "Samsung Internet", Users = 6.0, DataLabelMappingName = "Samsung Internet: 6.0%"},
        new DonutData { Browser = "UC Browser", Users = 2.5, DataLabelMappingName = "UC Browser: 2.5%"},
        new DonutData { Browser = "Opera", Users = 1.5, DataLabelMappingName = "Opera: 1.5%"},
        new DonutData { Browser = "Others", Users = 1.5, DataLabelMappingName = "Others: 1.5%"}
    };
    public class DonutData
    {
        public string Browser { get; set; }
        public double Users { get; set; }
        public string DataLabelMappingName { get; set; }
    }
}
NOTE
Refer to the Blazor Charts feature tour page for its groundbreaking feature representations and also explore the Blazor Accumulation Chart Example to know about the various features of accumulation charts and how it is used to represent numeric proportional data.