Print and Export in Blazor Accumulation Chart Component
23 Jun 202611 minutes to read
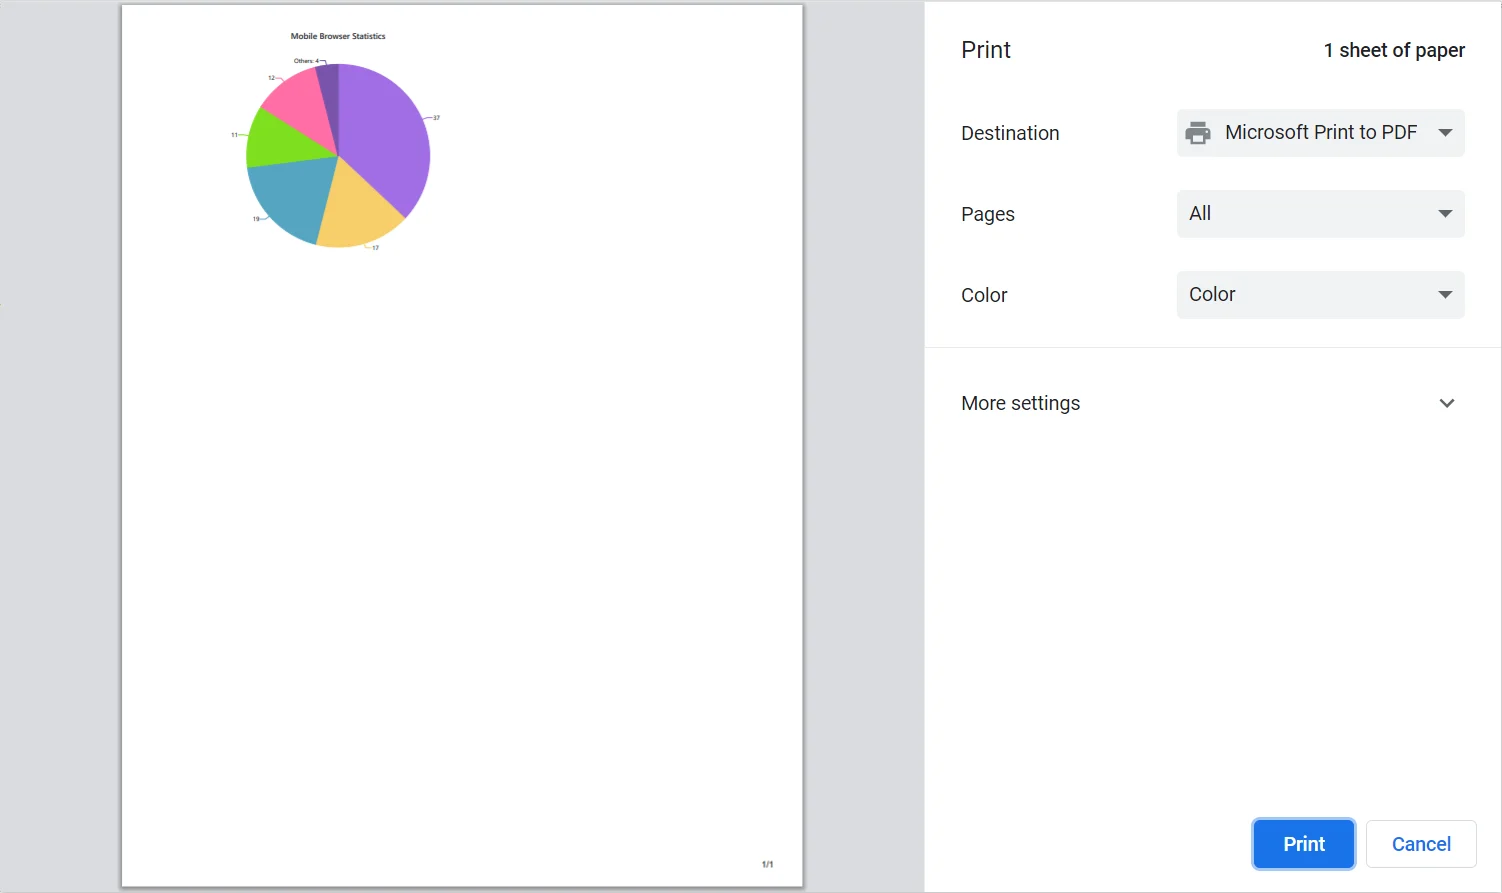
The PrintAsync method can be used to print a rendered chart directly from the browser.
@using Syncfusion.Blazor.Charts
@using Syncfusion.Blazor.Buttons

<SfAccumulationChart @ref="ChartObj" Title="Mobile Browser Statistics" EnableSmartLabels="true">
    <AccumulationChartLegendSettings Visible="false"></AccumulationChartLegendSettings>

    <AccumulationChartSeriesCollection>
        <AccumulationChartSeries DataSource="@StatisticsDetails" XName="Browser" YName="Users" Name="RIO" GroupTo="10">
            <AccumulationDataLabelSettings Visible="true" Name="Text" Position="AccumulationLabelPosition.Outside">
            </AccumulationDataLabelSettings>
        </AccumulationChartSeries>
    </AccumulationChartSeriesCollection>
</SfAccumulationChart>

<SfButton ID="button" Content="Print" @onclick="@Click" IsPrimary="true" CssClass="e-flat"></SfButton>

@code{
    SfAccumulationChart ChartObj;

    private async Task Click()
    {
        await ChartObj.PrintAsync();
    }

    public class Statistics
    {
        public string Browser { get; set; }
        public double Users { get; set; }
    }

    public List<Statistics> StatisticsDetails = new List<Statistics>
	{
        new Statistics { Browser = "Chrome", Users = 37 },
        new Statistics { Browser = "UC Browser", Users = 17 },
        new Statistics { Browser = "iPhone", Users = 19 },
        new Statistics { Browser = "Others", Users = 4  },
        new Statistics { Browser = "Opera", Users = 11 },
        new Statistics { Browser = "Android", Users = 12 },
    };
}
Export
Using the ExportAsync method, the rendered chart can be exported to JPEG, PNG, SVG, PDF, XLSX or CSV format. The ExportType specifies the file format and FileName specifies the name of the exported file. Both of these parameters are required input parameters for this method.
The optional parameters for this method are,
-
Orientation- Specifies the portrait or landscape orientation in the PDF document. -
AllowDownload: Set this parameter to true to enable the browser’s download prompt to download the chart in the specified format, and false to get the chart as aDataUrlstring.
@using Syncfusion.Blazor.Charts
@using Syncfusion.Blazor.Buttons
@using Microsoft.AspNetCore.Components.Web;
@using Syncfusion.PdfExport;
@using Syncfusion.ExcelExport;

<SfAccumulationChart @ref="ChartObj" Title="Mobile Browser Statistics" EnableSmartLabels="true">
    <AccumulationChartLegendSettings Visible="false"></AccumulationChartLegendSettings>

    <AccumulationChartSeriesCollection>
        <AccumulationChartSeries DataSource="@StatisticsDetails" XName="Browser" YName="Users" Name="RIO" GroupTo="10">
            <AccumulationDataLabelSettings Visible="true" Name="Text" Position="AccumulationLabelPosition.Outside">
            </AccumulationDataLabelSettings>
        </AccumulationChartSeries>
    </AccumulationChartSeriesCollection>
</SfAccumulationChart>


<SfButton ID="button" Content="Export" @onclick="@Click" IsPrimary="true" CssClass="e-flat"></SfButton>

@code{
    SfAccumulationChart ChartObj;

    private async Task Click()
    {
        await ChartObj.ExportAsync(ExportType.JPEG, "chart");
    }

    public class Statistics
    {
        public string Browser { get; set; }
        public double Users { get; set; }
    }

    public List<Statistics> StatisticsDetails = new List<Statistics>
    {
        new Statistics { Browser = "Chrome", Users = 37 },
        new Statistics { Browser = "UC Browser", Users = 17 },
        new Statistics { Browser = "iPhone", Users = 19 },
        new Statistics { Browser = "Others", Users = 4 },
        new Statistics { Browser = "Opera", Users = 11 },
        new Statistics { Browser = "Android", Users = 12 },
    };
}Customizing the exported chart using Exporting event
The Exporting event allows users to customize the exported accumulation chart before it is generated. The ChartExportEventArgs class provides the following options for customizing the exported accumulation chart:
-
Cancel: This property cancels the export process when set to true. -
Height: This property specifies the height of the exported chart. When the value is changed, the chart’s height is updated. It is not applicable for XLSX and CSV formats. -
Width: This property specifies the width of the exported chart. Changing the value updates the chart’s width. It is not applicable for XLSX and CSV formats. -
Workbook: Represents the workbook generated during export, applicable only for XLSX and CSV formats.
Customizing the exported Excel documents
The Workbook property in the event argument of Exporting event allows the users to customize the exported Excel sheet by modifying the properties of rows, columns, and cells, such as changing the font color, font size, font name, making the text bold, setting a background color, and center-aligning the text within the cells, before the file is generated.
In the code example below, the accumulation chart is exported to Excel format. The exported Excel document is customized using the Exporting event. If the ExportType parameter in the ExportAsync method is set to something other than XLSX or CSV, the Workbook property will be null, and the chart’s width will be set to 500px.
@using Syncfusion.Blazor.Charts
@using Microsoft.AspNetCore.Components.Web;
@using Syncfusion.PdfExport;
@using Syncfusion.ExcelExport;

<div id="button">
    <button onclick="@ExportChart">
        Export
    </button>
</div>

<SfAccumulationChart @ref="accumulationChart" EnableBorderOnMouseMove="false" Title="Browser Market Share" EnableAnimation="true" Theme="Syncfusion.Blazor.Theme.Tailwind3">
    <AccumulationChartTooltipSettings Header="" Format="<b>${point.x}</b><br>Browser Share: <b>${point.y}%</b>" Enable="true"></AccumulationChartTooltipSettings>
    <AccumulationChartLegendSettings Visible="false"></AccumulationChartLegendSettings>
    <AccumulationChartSeriesCollection>
        <AccumulationChartSeries DataSource="@PieChartPoints" XName="Browser" YName="Users" Radius="@Radius" Name="Browser" StartAngle="@StartAngle"
                                 InnerRadius="0%" ExplodeIndex="0" Explode="true" ExplodeOffset="@ExplodeRadius">
            <AccumulationDataLabelSettings Visible="true" Name="DataLabelMappingName" Position="AccumulationLabelPosition.Outside">
                <AccumulationChartDataLabelFont Size=@Size FontWeight="600"></AccumulationChartDataLabelFont>
                <AccumulationChartConnector Length=@ConnectorLength Type="ConnectorType.Curve"></AccumulationChartConnector>
            </AccumulationDataLabelSettings>
        </AccumulationChartSeries>
    </AccumulationChartSeriesCollection>
    <AccumulationChartEvents Exporting="BeforeExport"></AccumulationChartEvents>
</SfAccumulationChart>

@code {
    public int ExplodeIndex { get; set; } = 1;
    public string ExplodeRadius = "10%";
    public string Radius { get; set; } = "60%";
    public string ConnectorLength { get; set; } = "20px";
    public int StartAngle = 30;
    public string Size { get; set; } = "12px";
    public List<PieData> PieChartPoints { get; set; } = new List<PieData>
   {
        new PieData { Browser = "Chrome", Users = 59.28, DataLabelMappingName = "Chrome: 59.28%"},
        new PieData { Browser = "UC Browser", Users = 4.37, DataLabelMappingName = "UC Browser: 4.37%"},
        new PieData { Browser = "Internet Explorer", Users = 6.12, DataLabelMappingName = "Internet Explorer: 6.12%"},
        new PieData { Browser = "Sogou Explorer", Users = 1.37, DataLabelMappingName = "Sogou Explorer: 1.37%"},
        new PieData { Browser = "QQ", Users = 3.96, DataLabelMappingName = "QQ: 3.96%"},
        new PieData { Browser = "Safari", Users = 4.73, DataLabelMappingName = "Safari: 4.73%"},
        new PieData { Browser = "Opera", Users = 3.12, DataLabelMappingName = "Opera: 3.12%"},
        new PieData { Browser = "Edge", Users = 7.48, DataLabelMappingName = "Edge: 7.48%"},
        new PieData { Browser = "Others", Users = 9.57, DataLabelMappingName = "Others: 9.57%"},
    };


    public class PieData
    {
        public string Browser { get; set; }
        public double Users { get; set; }
        public string DataLabelMappingName { get; set; }
    }
    private SfAccumulationChart accumulationChart;
    public class Statistics
    {
        public string Browser { get; set; }
        public double Users { get; set; }
    }

    public async Task ExportChart(Microsoft.AspNetCore.Components.Web.MouseEventArgs args)
    {
        await accumulationChart.ExportAsync(Syncfusion.Blazor.Charts.ExportType.XLSX, "Statistics");
    }

    public void BeforeExport(ChartExportEventArgs args)
    {
        if (args.Workbook != null)
        {
            Worksheet firstSheet = args.Workbook.Worksheets.First();
            firstSheet.Columns[0].Width = 200;
            firstSheet.Columns[1].Width = 200;
            firstSheet.Rows[0].Cells[0].CellStyle.BackColor = "#FFA07A";

            firstSheet.Rows[1].Cells[1].Value = "Users";

            for (int i = 2; i < firstSheet.Rows.Count; i++)
            {
                for (int j = 0; j < 2; j++)
                {
                    firstSheet.Rows[i].Cells[1].CellStyle.HAlign = HAlignType.Center;
                    firstSheet.Rows[i].Cells[1].CellStyle.VAlign = VAlignType.Center;
                }
            }
        } else {
            args.Width = 500;
        }
    }

    public List<Statistics> StatisticsDetails = new List<Statistics>
    {
        new Statistics { Browser = "Chrome", Users = 37 },
        new Statistics { Browser = "UC Browser", Users = 17 },
        new Statistics { Browser = "iPhone", Users = 19 },
        new Statistics { Browser = "Others", Users = 4  },
        new Statistics { Browser = "Opera", Users = 11 },
        new Statistics { Browser = "Android", Users = 12 },
    };
}NOTE
Refer to the Blazor Charts feature tour page for its groundbreaking feature representations and also explore the Blazor Chart Example to know various chart types and how to represent time-dependent data, showing trends at equal intervals.