Empty Points in Blazor Accumulation Chart Component
20 Jul 20266 minutes to read
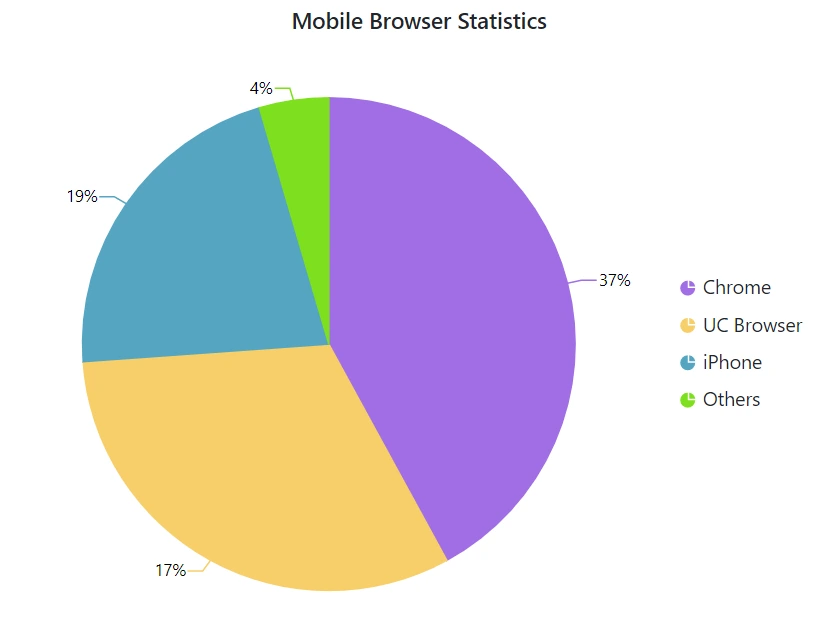
Data points that contain NaN or null value are considered as empty points. The empty data points can be ignored or not plotted in the chart. Those points can be customized using the AccumulationChartEmptyPointSettings in series.
@using Syncfusion.Blazor.Charts

<SfAccumulationChart Title="Mobile Browser Statistics">
    <AccumulationChartSeriesCollection>
        <AccumulationChartSeries DataSource="@StatisticsDetails" XName="Browser" YName="Users"
                                 Name="Profit">
            <AccumulationChartEmptyPointSettings Mode="@Mode"></AccumulationChartEmptyPointSettings>
            <AccumulationDataLabelSettings Visible="true" Name="Text" Position="AccumulationLabelPosition.Outside"></AccumulationDataLabelSettings>
        </AccumulationChartSeries>
    </AccumulationChartSeriesCollection>
</SfAccumulationChart>

@code{
    public EmptyPointMode Mode = EmptyPointMode.Gap;

    public class Statistics
    {
        public string Browser { get; set; }
        public double? Users { get; set; }
        public string Text { get; set; }
        public string Fill { get; set; }
    }

    public List<Statistics> StatisticsDetails = new List<Statistics>
	{
       new Statistics { Browser = "Chrome", Users = 37, Text= "37%", Fill="#498fff"},
       new Statistics { Browser = "UC Browser", Users = 17, Text= "17%", Fill="#ffa060"},
       new Statistics { Browser = "iPhone", Users = 19, Text= "19%", Fill="#ff68b6"},
       new Statistics { Browser = "Others", Users = 4 , Text= "4%", Fill="#81e2a1"},
    };
}
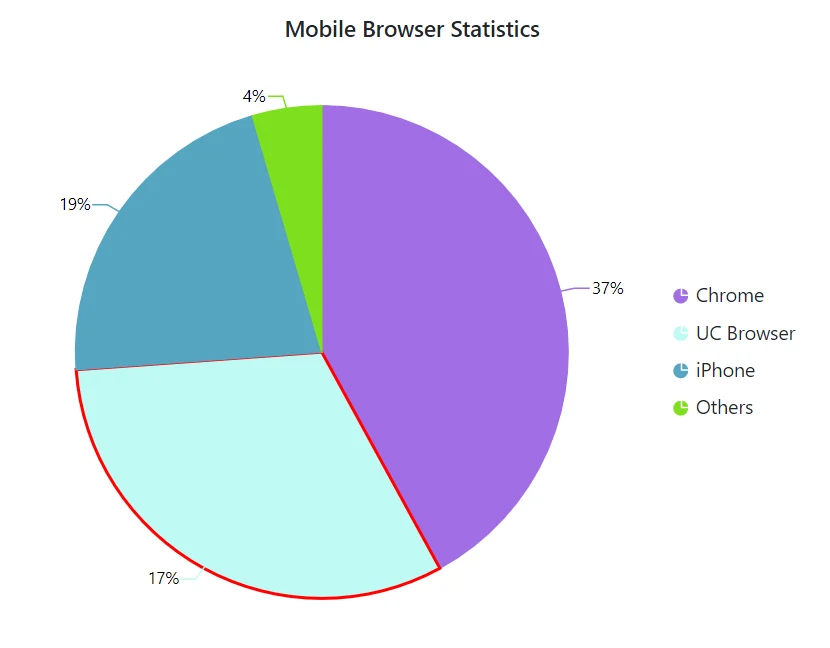
Customization
The Mode property can be used to handle the visibility of the empty points. The default mode of the empty point is Gap. Other supported modes are Average, Drop and Zero. The Fill property can be used to set a specific color for an empty point, and the Border property can be used to set the border for an empty point.
@using Syncfusion.Blazor.Charts

<SfAccumulationChart Title="Mobile Browser Statistics">
    <AccumulationChartSeriesCollection>
        <AccumulationChartSeries DataSource="@StatisticsDetails" XName="Browser" YName="Users"
                                 Name="Profit">
            <AccumulationChartEmptyPointSettings Mode="@Mode" Fill="#c0faf4">
                <AccumulationChartEmptyPointBorder Color="red" Width="2"></AccumulationChartEmptyPointBorder>
            </AccumulationChartEmptyPointSettings>
            <AccumulationDataLabelSettings Visible="true" Name="Text" Position="AccumulationLabelPosition.Outside"></AccumulationDataLabelSettings>
        </AccumulationChartSeries>
    </AccumulationChartSeriesCollection>
</SfAccumulationChart>


@code{
    public EmptyPointMode Mode = EmptyPointMode.Average;

    public class Statistics
    {
        public string Browser { get; set; }
        public double? Users { get; set; }
        public string Text { get; set; }
        public string Fill { get; set; }
    }

    public List<Statistics> StatisticsDetails = new List<Statistics>
	{
       new Statistics { Browser = "Chrome", Users = 37, Text= "37%", Fill="#498fff"},
       new Statistics { Browser = "UC Browser", Users = null, Text= "17%", Fill="#ffa060"},
       new Statistics { Browser = "iPhone", Users = 19, Text= "19%", Fill="#ff68b6"},
       new Statistics { Browser = "Others", Users = 4 , Text= "4%", Fill="#81e2a1"},
    };
}
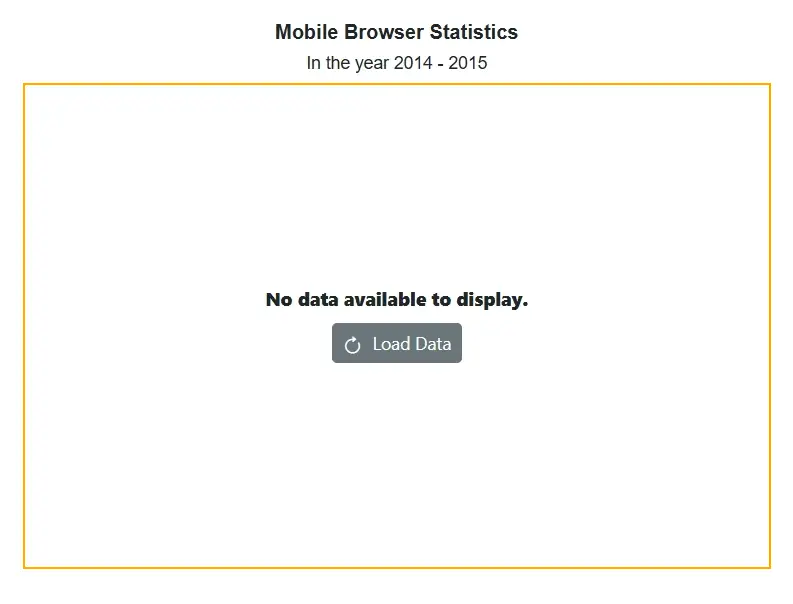
Handling No Data
When no data is available to render in the accumulation chart, the NoDataTemplate property can be used to display a custom layout within the chart area. This layout may include a message indicating the absence of data, a relevant image, or a button to initiate data loading. Styled text, images, or interactive elements can be incorporated to maintain design consistency and improve user guidance. Once data becomes available, the chart automatically updates to display the appropriate visualization.
@using Syncfusion.Blazor.Charts
@using Syncfusion.Blazor.Buttons

<SfAccumulationChart @ref="accChart" Width="80%" Title="Mobile Browser Statistics" SubTitle="In the year 2014 - 2015">
    <NoDataTemplate>
    <div style="border: 2px solid orange; display: row-flex; align-items: center; justify-content: center; align-content: center; white-space: normal; text-align: center; width: inherit; height: inherit; font-weight: bolder; font-size: medium;">
        <div style="font-size:15px; margin-bottom:10px"><strong>No data available to display.</strong></div>
        <SfButton IconCss="e-icons e-refresh" OnClick="LoadData">Load Data</SfButton>
    </div>
</NoDataTemplate>
    <ChildContent>
        <AccumulationChartSeriesCollection>
            <AccumulationChartSeries DataSource="@StatisticsDetails" XName="Browser" YName="Users" Name="Browser">
            </AccumulationChartSeries>
        </AccumulationChartSeriesCollection>
        <AccumulationChartLegendSettings Visible="true"></AccumulationChartLegendSettings>
    </ChildContent>
</SfAccumulationChart>

@code {
    private SfAccumulationChart accChart;
    public class Statistics
    {
        public string Browser { get; set; }
        public double Users { get; set; }
    }
    public List<Statistics> StatisticsDetails = new List<Statistics>();
    private void LoadData()
    {
        StatisticsDetails = new List<Statistics>
        {
            new Statistics { Browser = "Chrome", Users = 37 },
            new Statistics { Browser = "UC Browser", Users = 17 },
            new Statistics { Browser = "iPhone", Users = 19 },
            new Statistics { Browser = "Others", Users = 4  },
            new Statistics { Browser = "Opera", Users = 11 },
            new Statistics { Browser = "Android", Users = 12 },
        };
        if (accChart != null)
        accChart.Refresh();
    }
}
NOTE
Refer to the Blazor Charts feature tour page for its groundbreaking feature representations and also explore the Blazor Chart Example to know about the various chart types and how to represent time-dependent data, showing trends at equal intervals.