Gradient in Blazor Accumulation Chart Component
15 Dec 202516 minutes to read
Gradients add depth and modern styling to charts by smoothly blending multiple colors. The Charts component supports two gradient types:
- Linear gradient
- Radial gradient
Linear gradient
A linear gradient blends colors along a straight path from a defined start point to an end point. In accumulation charts, a linear gradient can be applied either to the whole series or to each point via the OnPointRender event. An AccumulationChartLinearGradient is configured with one or more color stops.
Properties:
X1 - Horizontal start position of the gradient (0 to 1).
Y1 - Vertical start position of the gradient (0 to 1).
X2 - Horizontal end position of the gradient (0 to 1).
Y2 - Vertical end position of the gradient (0 to 1).
Each color stop (AccumulationChartGradientColorStop) supports:
- Offset - Position along the gradient (0 to 100).
- Color - Base color at the stop.
- Opacity - Transparency (0 to 1).
- Lighten - Adjusts lightness (positive lightens, negative darkens).
- Brighten - Adjusts brightness (positive increases, negative decreases).
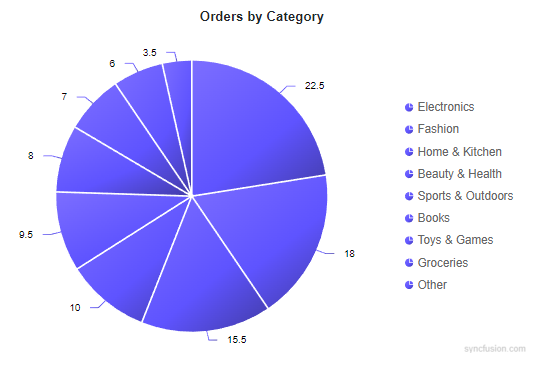
Apply gradient to the entire series
A linear gradient may be applied directly at the series level. The same gradient is applied uniformly to all data points, legend symbols and tooltip markers.
@using Syncfusion.Blazor.Charts

@* Initialize the AccumulationChart to display orders by category using a Pie series *@
<SfAccumulationChart Title="Orders by Category" Width="100%">
    <AccumulationChartLegendSettings Visible="true" />
    <AccumulationChartTooltipSettings Enable="true" />

    <AccumulationChartSeriesCollection>
        <AccumulationChartSeries DataSource="@CategoryData" XName="Category" YName="Share" Type="AccumulationType.Pie" Name="Share by Category">
            <AccumulationChartSeriesBorder Color="#FFFFFF" Width="2"></AccumulationChartSeriesBorder>

            <AccumulationDataLabelSettings Visible="true" Position="AccumulationLabelPosition.Outside" Name="DataLabelMappingName">
                <AccumulationChartConnector Length="10px" />
                <AccumulationChartDataLabelFont Size="12px" />
            </AccumulationDataLabelSettings>

            @* Series Linear Gradient: defines color stops for the entire series *@
            <AccumulationChartLinearGradient X1="0.1" Y1="0.0" X2="0.9" Y2="1.0">
                <AccumulationChartGradientColorStops>
                    <AccumulationChartGradientColorStop Offset="0"   Color="#4F46E5" Opacity="1"    Brighten="0.55" />
                    <AccumulationChartGradientColorStop Offset="60"  Color="#4F46E5" Opacity="0.98" Brighten="0.15" />
                    <AccumulationChartGradientColorStop Offset="100" Color="#4F46E5" Opacity="0.95" Brighten="-0.25" />
                </AccumulationChartGradientColorStops>
            </AccumulationChartLinearGradient>
        </AccumulationChartSeries>
    </AccumulationChartSeriesCollection>
</SfAccumulationChart>

@code {
    public class CategoryPoint {
        public string Category { get; set; }
        public double Share { get; set; }
        public string DataLabel { get; set; }
    }

    private readonly List<CategoryPoint> CategoryData = new ()
    {
        new CategoryPoint { Category = "Electronics", Share = 22.5, DataLabel = "Electronics: 22.5%" },
        new CategoryPoint { Category = "Fashion", Share = 18.0, DataLabel = "Fashion: 18.0%" },
        new CategoryPoint { Category = "Home & Kitchen", Share = 15.5, DataLabel = "Home & Kitchen: 15.5%" },
        new CategoryPoint { Category = "Beauty & Health", Share = 10.0, DataLabel = "Beauty & Health: 10.0%" },
        new CategoryPoint { Category = "Sports & Outdoors", Share = 9.5, DataLabel = "Sports & Outdoors: 9.5%" },
        new CategoryPoint { Category = "Books", Share = 8.0,  DataLabel = "Books: 8.0%" },
        new CategoryPoint { Category = "Toys & Games", Share = 7.0, DataLabel = "Toys & Games: 7.0%" },
        new CategoryPoint { Category = "Groceries", Share = 6.0,  DataLabel = "Groceries: 6.0%" },
        new CategoryPoint { Category = "Other", Share = 3.5,  DataLabel = "Other: 3.5%" }
    };
}
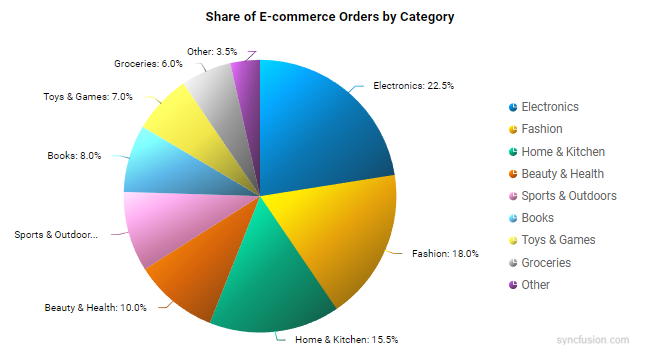
Apply a gradient per point using the point render event
A diagonal linear gradient can be applied per data point using the OnPointRender event for a clear light-to-shadow transition.
@using Syncfusion.Blazor.Charts

@* Initialize the AccumulationChart to display share of e-commerce orders by category using a Pie series *@
<SfAccumulationChart Title="Share of E-commerce Orders by Category" Width="100%">
    @* Point Render: applies a diagonal linear gradient per point *@
    <AccumulationChartEvents OnPointRender="OnPointRender" />
    <AccumulationChartLegendSettings Visible="true" />
    <AccumulationChartTooltipSettings Enable="true" />

    <AccumulationChartSeriesCollection>
        <AccumulationChartSeries DataSource="@CategoryData" XName="Category" YName="Share" Type="AccumulationType.Pie" Name="Share by Category">
            <AccumulationChartSeriesBorder Color="transparent" Width="0"></AccumulationChartSeriesBorder>
            <AccumulationDataLabelSettings Visible="true" Position="AccumulationLabelPosition.Outside" Name="DataLabelMappingName">
                <AccumulationChartConnector Length="10px" />
                <AccumulationChartDataLabelFont Size="12px" />
            </AccumulationDataLabelSettings>
        </AccumulationChartSeries>
    </AccumulationChartSeriesCollection>
</SfAccumulationChart>

@code {
    public class CategoryShare
    {
        public string? Category { get; set; }
        public double Share { get; set; }
        public string? DataLabelMappingName { get; set; }
    }

    private readonly List<CategoryShare> CategoryData = new ()
    {
        new CategoryShare { Category = "Electronics", Share = 22.5, DataLabelMappingName = "Electronics: 22.5%" },
        new CategoryShare { Category = "Fashion", Share = 18.0, DataLabelMappingName = "Fashion: 18.0%" },
        new CategoryShare { Category = "Home & Kitchen", Share = 15.5, DataLabelMappingName = "Home & Kitchen: 15.5%" },
        new CategoryShare { Category = "Beauty & Health", Share = 10.0, DataLabelMappingName = "Beauty & Health: 10.0%" },
        new CategoryShare { Category = "Sports & Outdoors", Share = 9.5,  DataLabelMappingName = "Sports & Outdoors: 9.5%" },
        new CategoryShare { Category = "Books", Share = 8.0,  DataLabelMappingName = "Books: 8.0%" },
        new CategoryShare { Category = "Toys & Games", Share = 7.0,  DataLabelMappingName = "Toys & Games: 7.0%" },
        new CategoryShare { Category = "Groceries", Share = 6.0,  DataLabelMappingName = "Groceries: 6.0%" },
        new CategoryShare { Category = "Other", Share = 3.5,  DataLabelMappingName = "Other: 3.5%" }
    };

    private readonly string[] BaseColors = new[]
    {
        "#0072B2", "#E69F00", "#009E73", "#D55E00", "#CC79A7", "#56B4E9", "#F0E442", "#999999", "#7F3C8D"
    };

    private void OnPointRender(AccumulationPointRenderEventArgs args)
    {
        string baseColor = BaseColors[args.Point.Index % BaseColors.Length];
        args.LinearGradient = new AccumulationChartLinearGradient
        {
            X1 = 0.05, Y1 = 0.0, X2 = 0.95, Y2 = 1.0,
            GradientColorStops = new List<AccumulationChartGradientColorStop>
            {
                new AccumulationChartGradientColorStop { Offset = 0,   Color = baseColor, Brighten =  0.85, Opacity = 1 },
                new AccumulationChartGradientColorStop { Offset = 20,  Color = baseColor, Brighten =  0.45, Opacity = 0.98 },
                new AccumulationChartGradientColorStop { Offset = 50,  Color = baseColor, Brighten =  0.00, Opacity = 0.96 },
                new AccumulationChartGradientColorStop { Offset = 80,  Color = baseColor, Brighten = -0.30, Opacity = 0.94 },
                new AccumulationChartGradientColorStop { Offset = 100, Color = baseColor, Brighten = -0.55, Opacity = 0.92 }
            }
        };
    }
}
Radial gradient
Configure a radial gradient by assigning an AccumulationChartRadialGradient with one or more color stops inside the OnPointRender event. The following properties control the gradient appearance:
Cx - Normalized horizontal center of the gradient (0 to 1).
Cy - Normalized vertical center of the gradient (0 to 1).
Fx - Normalized horizontal focal point from which the gradient appears to originate (0 to 1).
Fy - Normalized vertical focal point (0 to 1).
R  - Normalized radius of the gradient circle (0 to 1).
Each color stop (AccumulationChartGradientColorStop) supports:
- Offset - Position of the stop along the gradient (0 to 100).
- Color - Base color at the stop.
- Opacity - Transparency (0 to 1).
- Lighten - Adjusts lightness (positive lightens, negative darkens).
- Brighten - Adjusts brightness (positive increases, negative decreases).
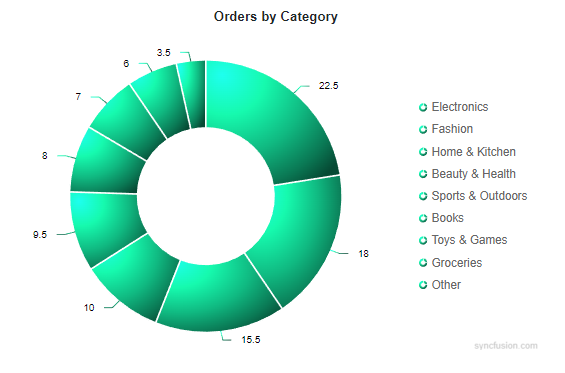
Apply a radial gradient to the entire series
A radial gradient can be applied directly at the series level. The same gradient is applied uniformly to all data points, legend symbols and tooltip markers.
@using Syncfusion.Blazor.Charts

@* Initialize the AccumulationChart to display orders by category using a Pie series *@
<SfAccumulationChart Title="Orders by Category" Width="100%">
    <AccumulationChartLegendSettings Visible="true" />
    <AccumulationChartTooltipSettings Enable="true" />

    <AccumulationChartSeriesCollection>
        <AccumulationChartSeries DataSource="@CategoryData" XName="Category" YName="Share" Type="AccumulationType.Pie" Name="Share by Category">
            <AccumulationChartSeriesBorder Color="#FFFFFF" Width="2"></AccumulationChartSeriesBorder>

            <AccumulationDataLabelSettings Visible="true" Position="AccumulationLabelPosition.Outside" Name="DataLabelMappingName">
                <AccumulationChartConnector Length="10px" />
                <AccumulationChartDataLabelFont Size="12px" />
            </AccumulationDataLabelSettings>

            @* Series Radial Gradient: defines color stops for the entire series *@
            <AccumulationChartRadialGradient Cx="0.22" Cy="0.22" Fx="0.12" Fy="0.12" R="0.96">
                <AccumulationChartGradientColorStops>
                    <AccumulationChartGradientColorStop Offset="0" Color="#10B981" Opacity="1"  Brighten="0.85" />
                    <AccumulationChartGradientColorStop Offset="30" Color="#10B981" Opacity="1"  Brighten="0.35" />
                    <AccumulationChartGradientColorStop Offset="60" Color="#10B981" Opacity="1"  Brighten="0.00" />
                    <AccumulationChartGradientColorStop Offset="85" Color="#10B981" Opacity="1"  Brighten="-0.35" />
                    <AccumulationChartGradientColorStop Offset="100" Color="#10B981" Opacity="1"  Brighten="-0.60" />
                </AccumulationChartGradientColorStops>
            </AccumulationChartRadialGradient>
        </AccumulationChartSeries>
    </AccumulationChartSeriesCollection>
</SfAccumulationChart>

@code {
    public class CategoryPoint {
        public string Category { get; set; }
        public double Share { get; set; }
        public string DataLabel { get; set; }
    }

    private readonly List<CategoryPoint> CategoryData = new ()
    {
        new CategoryPoint { Category = "Electronics", Share = 22.5, DataLabel = "Electronics: 22.5%" },
        new CategoryPoint { Category = "Fashion", Share = 18.0, DataLabel = "Fashion: 18.0%" },
        new CategoryPoint { Category = "Home & Kitchen", Share = 15.5, DataLabel = "Home & Kitchen: 15.5%" },
        new CategoryPoint { Category = "Beauty & Health", Share = 10.0, DataLabel = "Beauty & Health: 10.0%" },
        new CategoryPoint { Category = "Sports & Outdoors", Share = 9.5, DataLabel = "Sports & Outdoors: 9.5%" },
        new CategoryPoint { Category = "Books", Share = 8.0,  DataLabel = "Books: 8.0%" },
        new CategoryPoint { Category = "Toys & Games", Share = 7.0, DataLabel = "Toys & Games: 7.0%" },
        new CategoryPoint { Category = "Groceries", Share = 6.0,  DataLabel = "Groceries: 6.0%" },
        new CategoryPoint { Category = "Other", Share = 3.5,  DataLabel = "Other: 3.5%" }
    };
}
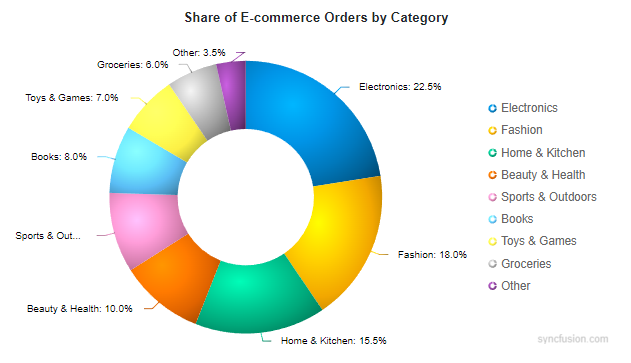
Apply a radial gradient per point using the point render event
The following example uses a distinct color palette and an off-center radial gradient to create a clear light-to-shadow effect on each data point. The gradient is configured in OnPointRender, so each data point receives its own radial gradient derived from its base color.
@using Syncfusion.Blazor.Charts

@* Initialize the AccumulationChart to display share of e-commerce orders by category using a Pie series *@
<SfAccumulationChart Title="Share of E-commerce Orders by Category" Width="100%">
    @* Point Render: applies an off-center radial gradient per point *@
    <AccumulationChartEvents OnPointRender="OnPointRender" />
    <AccumulationChartLegendSettings Visible="true" />
    <AccumulationChartTooltipSettings Enable="true" />

    <AccumulationChartSeriesCollection>
        <AccumulationChartSeries DataSource="@CategoryData" XName="Category" YName="Share" Type="AccumulationType.Pie" Name="Share by Category">
            <AccumulationChartSeriesBorder Color="transparent" Width="0"></AccumulationChartSeriesBorder>
            <AccumulationDataLabelSettings Visible="true" Position="AccumulationLabelPosition.Outside" Name="DataLabelMappingName">
                <AccumulationChartConnector Length="10px" />
                <AccumulationChartDataLabelFont Size="12px" />
            </AccumulationDataLabelSettings>
        </AccumulationChartSeries>
    </AccumulationChartSeriesCollection>
</SfAccumulationChart>

@code {
    public class CategoryShare
    {
        public string? Category { get; set; }
        public double Share { get; set; }
        public string? DataLabelMappingName { get; set; }
    }

    private readonly List<CategoryShare> CategoryData = new ()
    {
        new CategoryShare { Category = "Electronics", Share = 22.5, DataLabelMappingName = "Electronics: 22.5%" },
        new CategoryShare { Category = "Fashion", Share = 18.0, DataLabelMappingName = "Fashion: 18.0%" },
        new CategoryShare { Category = "Home & Kitchen", Share = 15.5, DataLabelMappingName = "Home & Kitchen: 15.5%" },
        new CategoryShare { Category = "Beauty & Health", Share = 10.0, DataLabelMappingName = "Beauty & Health: 10.0%" },
        new CategoryShare { Category = "Sports & Outdoors", Share = 9.5,  DataLabelMappingName = "Sports & Outdoors: 9.5%" },
        new CategoryShare { Category = "Books", Share = 8.0,  DataLabelMappingName = "Books: 8.0%" },
        new CategoryShare { Category = "Toys & Games", Share = 7.0,  DataLabelMappingName = "Toys & Games: 7.0%" },
        new CategoryShare { Category = "Groceries", Share = 6.0,  DataLabelMappingName = "Groceries: 6.0%" },
        new CategoryShare { Category = "Other", Share = 3.5,  DataLabelMappingName = "Other: 3.5%" }
    };

    private readonly string[] BaseColors = new[]
    {
        "#0072B2", "#E69F00", "#009E73", "#D55E00", "#CC79A7", "#56B4E9", "#F0E442", "#999999", "#7F3C8D"
    };

    private void OnPointRender(AccumulationPointRenderEventArgs args)
    {
        string baseColor = BaseColors[args.Point.Index % BaseColors.Length];
        args.RadialGradient = new AccumulationChartRadialGradient
        {
            Cx = 0.35, Cy = 0.35, Fx = 0.35, Fy = 0.35, R = 0.85,
            GradientColorStops = new List<AccumulationChartGradientColorStop>
            {
                new AccumulationChartGradientColorStop { Offset = 0, Color = baseColor, Brighten =  0.60, Opacity = 1 },
                new AccumulationChartGradientColorStop { Offset = 35, Color = baseColor, Brighten =  0.30, Opacity = 1 },
                new AccumulationChartGradientColorStop { Offset = 65, Color = baseColor, Brighten =  0.05, Opacity = 1 },
                new AccumulationChartGradientColorStop { Offset = 85, Color = baseColor, Brighten = -0.15, Opacity = 1 },
                new AccumulationChartGradientColorStop { Offset = 100, Color = baseColor, Brighten = -0.35, Opacity = 1 }
            }
        };
    }
}
NOTE
Refer to the Blazor Charts feature tour page for its groundbreaking feature representations and also explore the Blazor Accumulation Chart Example to know various features of accumulation charts and how it is used to represent numeric proportional data.