Appearance in Blazor Charts Component
16 Jul 202612 minutes to read
Custom color palette
The default color of series or points can be changed by providing a custom color palette to the Palettes property.
@using Syncfusion.Blazor.Charts

<SfChart Title="Olympic Medals" Palettes="@palettes">
    <ChartPrimaryXAxis ValueType="Syncfusion.Blazor.Charts.ValueType.Category">
    </ChartPrimaryXAxis>

    <ChartSeriesCollection>
        <ChartSeries DataSource="@MedalDetails" XName="Country" YName="Gold" Type="ChartSeriesType.Column">
        </ChartSeries>
        <ChartSeries DataSource="@MedalDetails" XName="Country" YName="Silver" Type="ChartSeriesType.Column">
        </ChartSeries>
        <ChartSeries DataSource="@MedalDetails" XName="Country" YName="Bronze" Type="ChartSeriesType.Column">
        </ChartSeries>
    </ChartSeriesCollection>
</SfChart>

@code{
    public class ChartData
    {
        public string Country { get; set; }
        public double Gold { get; set; }
        public double Silver { get; set; }
        public double Bronze { get; set; }
    }

    public List<ChartData> MedalDetails = new List<ChartData>
	{
         new ChartData{ Country= "USA", Gold=50, Silver=70, Bronze=45 },
         new ChartData{ Country="China", Gold=40, Silver= 60, Bronze=55 },
         new ChartData{ Country= "Japan", Gold=70, Silver= 60, Bronze=50 },
         new ChartData{ Country= "Australia", Gold=60, Silver= 56, Bronze=40 },
         new ChartData{ Country= "France", Gold=50, Silver= 45, Bronze=35 },
         new ChartData{ Country= "Germany", Gold=40, Silver=30, Bronze=22 },
         new ChartData{ Country= "Italy", Gold=40, Silver=35, Bronze=37 },
         new ChartData{ Country= "Sweden", Gold=30, Silver=25, Bronze=27 }
    };

    public String[] palettes = new String[] { "#E94649", "#F6B53F", "#6FAAB0" };
}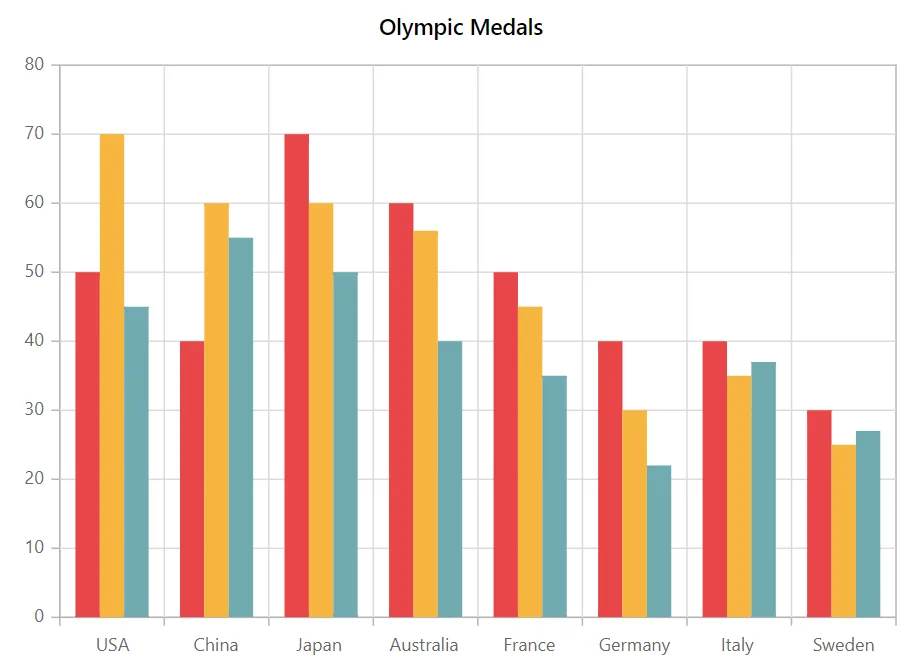
Chart customization
Chart background and border
The chart’s background color can be customized using the Background property and the border color and width can be customized based on the specified value in ChartBorder.
@using Syncfusion.Blazor.Charts

<SfChart Title="Olympic Medals" Background="skyblue">
    <ChartBorder Color="#FF0000" Width="2"></ChartBorder>

    <ChartPrimaryXAxis ValueType="Syncfusion.Blazor.Charts.ValueType.Category" />

    <ChartSeriesCollection>
        <ChartSeries DataSource="@MedalDetails" XName="Country" YName="Gold" Type="ChartSeriesType.Column">
        </ChartSeries>
    </ChartSeriesCollection>
</SfChart>

@code{
    public class ChartData
    {
        public string Country { get; set; }
        public double Gold { get; set; }
    }

    public List<ChartData> MedalDetails = new List<ChartData>
	{
		new ChartData{ Country= "USA", Gold=50  },
		new ChartData{ Country="China", Gold=40 },
		new ChartData{ Country= "Japan", Gold=70 },
		new ChartData{ Country= "Australia", Gold=60},
		new ChartData{ Country= "France", Gold=50 },
		new ChartData{ Country= "Germany", Gold=40 },
		new ChartData{ Country= "Italy", Gold=40 },
		new ChartData{ Country= "Sweden", Gold=30 }
    };
}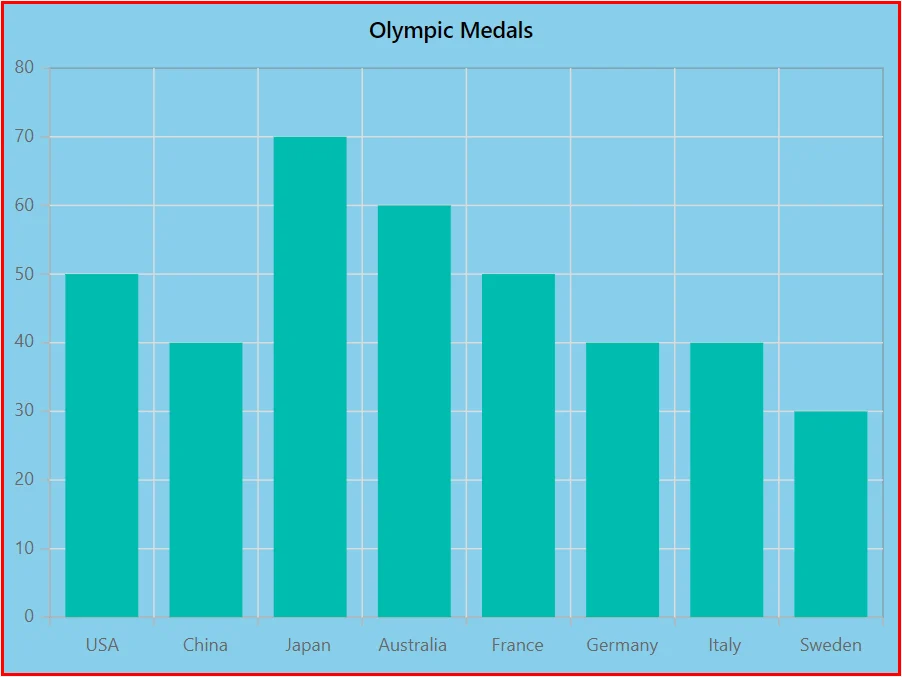
Chart margin
The chart’s margin from its container can be customized using the ChartMargin.
@using Syncfusion.Blazor.Charts

<SfChart Title="Olympic Medals" Background="skyblue">
    <ChartBorder Color="#FF0000" Width="2"></ChartBorder>

    <ChartMargin Left="60" Right="60" Top="60" Bottom="60"></ChartMargin>

    <ChartPrimaryXAxis ValueType="Syncfusion.Blazor.Charts.ValueType.Category">
    </ChartPrimaryXAxis>

    <ChartSeriesCollection>
        <ChartSeries DataSource="@MedalDetails" XName="Country" YName="Gold" Type="ChartSeriesType.Column">
        </ChartSeries>
    </ChartSeriesCollection>
</SfChart>

@code{
    public class ChartData
    {
        public string Country { get; set; }
        public double Gold { get; set; }
    }

    public List<ChartData> MedalDetails = new List<ChartData>
	{
		new ChartData{ Country= "USA", Gold=50  },
		new ChartData{ Country="China", Gold=40 },
		new ChartData{ Country= "Japan", Gold=70 },
		new ChartData{ Country= "Australia", Gold=60},
		new ChartData{ Country= "France", Gold=50 },
		new ChartData{ Country= "Germany", Gold=40 },
		new ChartData{ Country= "Italy", Gold=40 },
		new ChartData{ Country= "Sweden", Gold=30 }
    };
}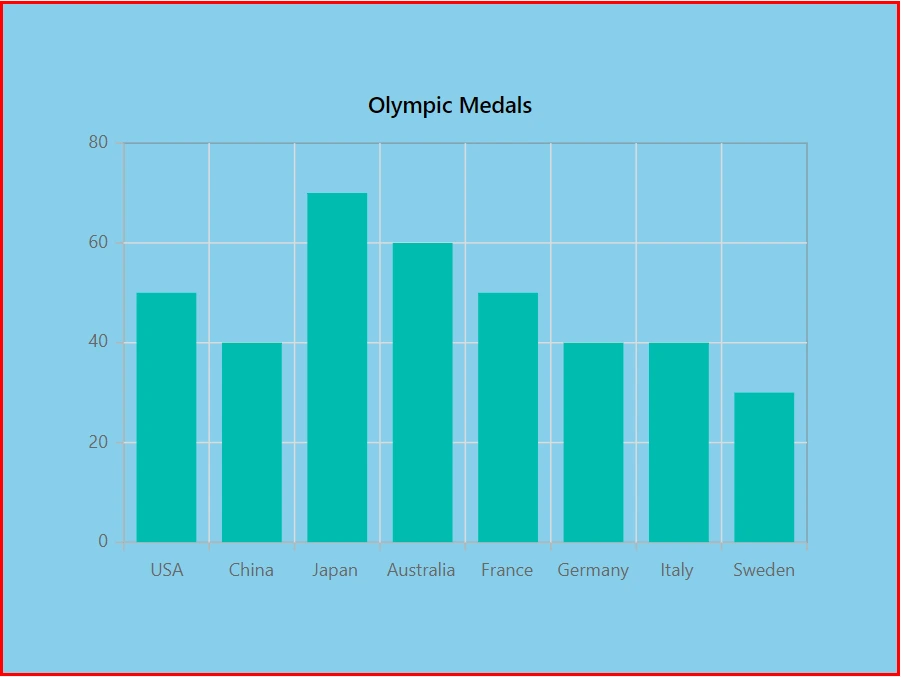
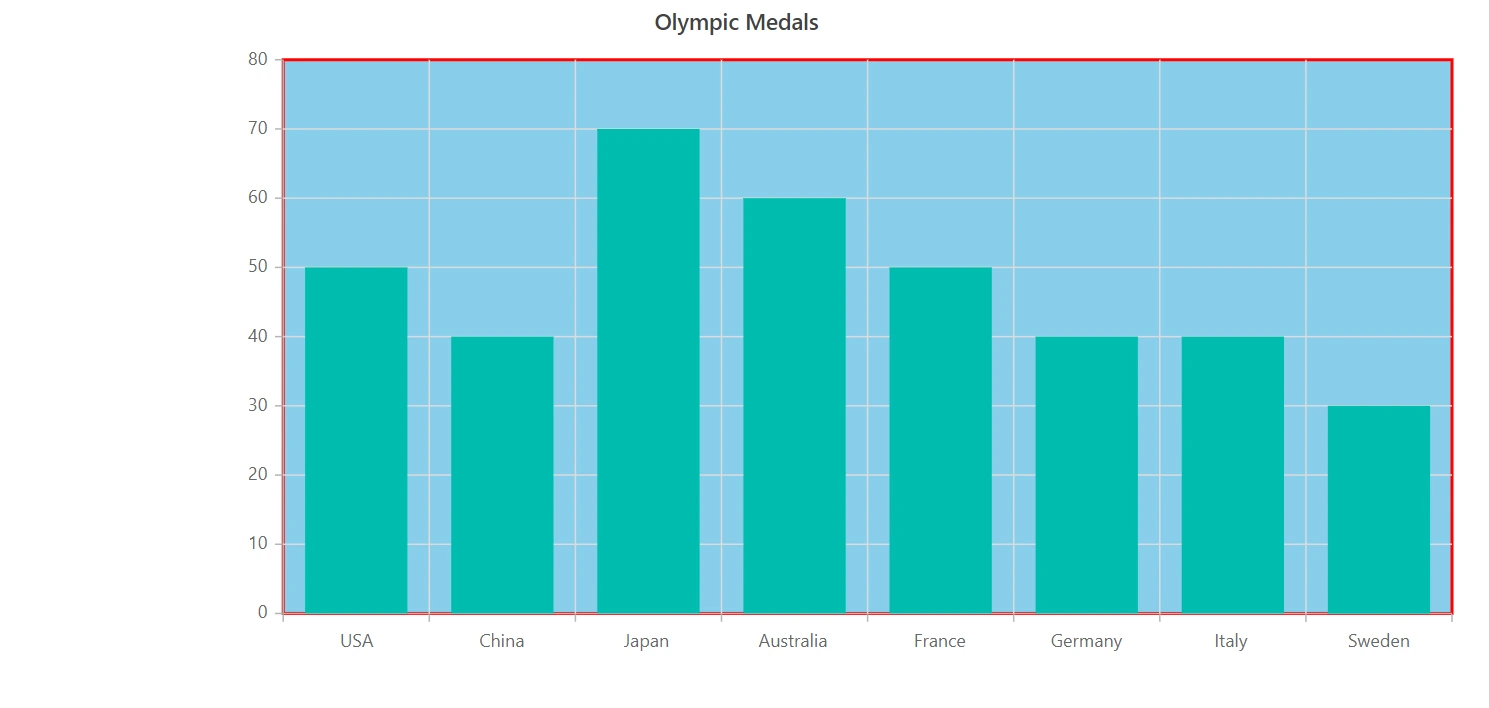
Chart area customization
Using Background and ChartAreaBorder properties, you can change the background color and border of the chart area. Width for the chart area can be customized using Width property.
@using Syncfusion.Blazor.Charts

<SfChart Title="Olympic Medals" >
    <ChartArea Background="skyblue" Width="80%">
        <ChartAreaBorder Color="#FF0000"  Width="2" />
    </ChartArea>

    <ChartPrimaryXAxis ValueType="Syncfusion.Blazor.Charts.ValueType.Category" />

    <ChartSeriesCollection>
        <ChartSeries DataSource="@MedalDetails" XName="Country" YName="Gold" Type="ChartSeriesType.Column" />
    </ChartSeriesCollection>
</SfChart>

@code{
    public class ChartData
    {
        public string Country { get; set; }
        public double Gold { get; set; }
    }

    public List<ChartData> MedalDetails = new List<ChartData>
	{
		new ChartData{ Country= "USA", Gold=50  },
		new ChartData{ Country="China", Gold=40 },
		new ChartData{ Country= "Japan", Gold=70 },
		new ChartData{ Country= "Australia", Gold=60},
		new ChartData{ Country= "France", Gold=50 },
		new ChartData{ Country= "Germany", Gold=40 },
		new ChartData{ Country= "Italy", Gold=40 },
		new ChartData{ Country= "Sweden", Gold=30 }
    };
}
Animation
The Animation property allows to customize animation for a certain series. The Enable property can be used to enable or disable the series animation. The duration of the animation is specified by Duration property, and Delay property allows to start the animation at a specific moment.
@using Syncfusion.Blazor.Charts

<SfChart Title="Olympic Medals">
    <ChartPrimaryXAxis ValueType="Syncfusion.Blazor.Charts.ValueType.Category"/>

    <ChartSeriesCollection>
        <ChartSeries DataSource="@MedalDetails" Name="Gold" XName="Country" Width="2" Opacity="1" YName="Gold" Type="ChartSeriesType.Column">
            <ChartSeriesAnimation Enable="true" Duration="2000" Delay="200"></ChartSeriesAnimation>
            <ChartSeriesBorder Width="3" Color="red"></ChartSeriesBorder>
        </ChartSeries>
    </ChartSeriesCollection>
</SfChart>

@code{
    public class ChartData
    {
        public string Country { get; set; }
        public double Gold { get; set; }
        public double Silver { get; set; }
        public double Bronze { get; set; }
    }

    public List<ChartData> MedalDetails = new List<ChartData>
	{
        new ChartData{ Country= "USA", Gold=50, Silver=70, Bronze=45 },
        new ChartData{ Country="China", Gold=40, Silver= 60, Bronze=55 },
        new ChartData{ Country= "Japan", Gold=70, Silver= 60, Bronze=50 },
        new ChartData{ Country= "Australia", Gold=60, Silver= 56, Bronze=40 },
        new ChartData{ Country= "France", Gold=50, Silver= 45, Bronze=35 },
        new ChartData{ Country= "Germany", Gold=40, Silver=30, Bronze=22 },
        new ChartData{ Country= "Italy", Gold=40, Silver=35, Bronze=37 },
        new ChartData{ Country= "Sweden", Gold=30, Silver=25, Bronze=27 }
    };
}
Chart title
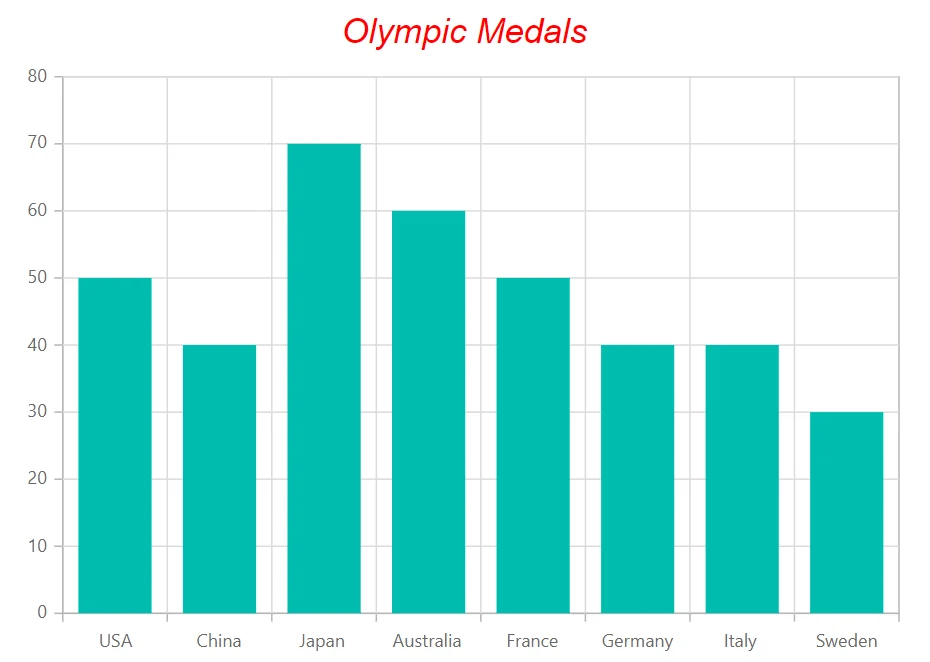
A chart title can be specified using the Title property to convey information about the displayed data.
@using Syncfusion.Blazor.Charts

<SfChart Title="Olympic Medals">
    <ChartTitleStyle Size="23px" Color="red" FontFamily="Arial" FontWeight="regular" FontStyle="italic"></ChartTitleStyle>

    <ChartPrimaryXAxis ValueType="Syncfusion.Blazor.Charts.ValueType.Category">
    </ChartPrimaryXAxis>

    <ChartSeriesCollection>
        <ChartSeries DataSource="@MedalDetails" XName="Country" YName="Gold" Type="ChartSeriesType.Column">
        </ChartSeries>
    </ChartSeriesCollection>
</SfChart>

@code{
    public class ChartData
    {
        public string Country { get; set; }
        public double Gold {get; set; }
    }

    public List<ChartData> MedalDetails = new List<ChartData>
	{
		new ChartData{ Country= "USA", Gold=50  },
		new ChartData{ Country="China", Gold=40 },
		new ChartData{ Country= "Japan", Gold=70 },
		new ChartData{ Country= "Australia", Gold=60},
		new ChartData{ Country= "France", Gold=50 },
		new ChartData{ Country= "Germany", Gold=40 },
		new ChartData{ Country= "Italy", Gold=40 },
		new ChartData{ Country= "Sweden", Gold=30 }
    };
}
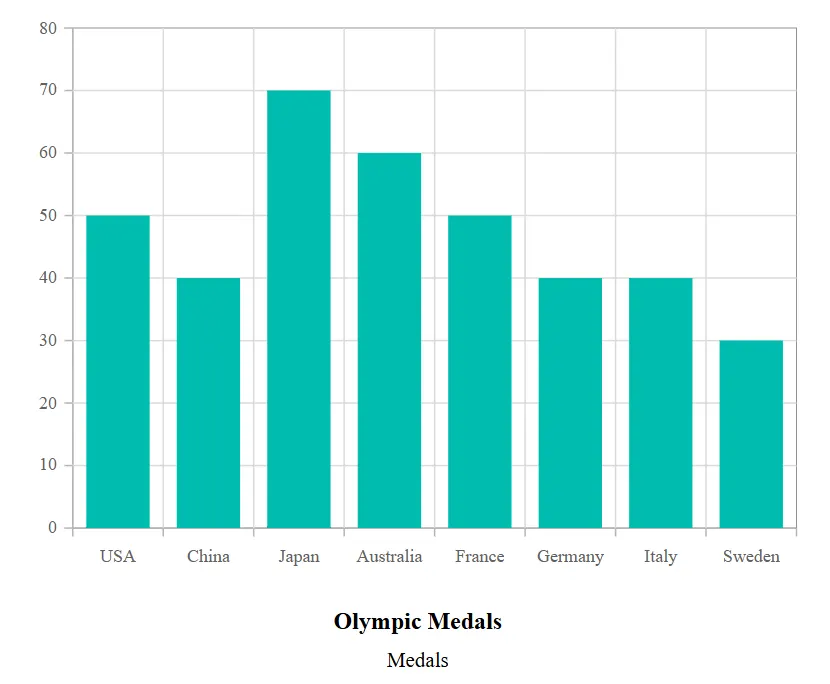
Title position
The Position property customizes the placement of the chart title. It supports the following options: Right, Left, Bottom, Top, and Custom, providing flexible title alignment based on layout requirements. By default, the chart title appears at the top of the chart.
NOTE
The subtitle, which appears below the title, will also be positioned along with the title when the
Positionproperty is set.
@using Syncfusion.Blazor.Charts

<SfChart Title="Olympic Medals" SubTitle="Medals">
    <ChartTitleStyle Position="ChartTitlePosition.Bottom"></ChartTitleStyle>

    <ChartPrimaryXAxis ValueType="Syncfusion.Blazor.Charts.ValueType.Category">
    </ChartPrimaryXAxis>

    <ChartSeriesCollection>
        <ChartSeries DataSource="@MedalDetails" XName="Country" YName="Gold" Type="Syncfusion.Blazor.Charts.ChartSeriesType.Column">
        </ChartSeries>
    </ChartSeriesCollection>
</SfChart>

@code{
    public class ChartData
    {
        public string Country { get; set; }
        public double Gold { get; set; }
    }

    public List<ChartData> MedalDetails = new List<ChartData>
	{
		new ChartData{ Country= "USA", Gold=50  },
		new ChartData{ Country="China", Gold=40 },
		new ChartData{ Country= "Japan", Gold=70 },
		new ChartData{ Country= "Australia", Gold=60},
		new ChartData{ Country= "France", Gold=50 },
		new ChartData{ Country= "Germany", Gold=40 },
		new ChartData{ Country= "Italy", Gold=40 },
		new ChartData{ Country= "Sweden", Gold=30 }
    };
}
When the Position is set to Custom, the title can be positioned anywhere on the chart using the X and Y properties in ChartTitleStyle. This provides precise control over the title’s location, enabling customization to fit specific design or layout needs. The X and Y values specify the horizontal and vertical coordinates, respectively.
@using Syncfusion.Blazor.Charts

<SfChart Title="Olympic Medals" SubTitle="Medals">

    <ChartTitleStyle Position="ChartTitlePosition.Custom" X="335" Y="60"></ChartTitleStyle>

    <ChartPrimaryXAxis ValueType="Syncfusion.Blazor.Charts.ValueType.Category">
        <ChartAxisMajorGridLines Width="0"></ChartAxisMajorGridLines>
    </ChartPrimaryXAxis>

    <ChartSeriesCollection>
        <ChartSeries DataSource="@MedalDetails" XName="Country" YName="Gold" Type="Syncfusion.Blazor.Charts.ChartSeriesType.Column">
        </ChartSeries>
    </ChartSeriesCollection>
</SfChart>

@code{
    public class ChartData
    {
        public string Country { get; set; }
        public double Gold { get; set; }
    }

    public List<ChartData> MedalDetails = new List<ChartData>
	{
		new ChartData{ Country= "USA", Gold=50  },
		new ChartData{ Country="China", Gold=40 },
		new ChartData{ Country= "Japan", Gold=70 },
		new ChartData{ Country= "Australia", Gold=60},
		new ChartData{ Country= "France", Gold=50 },
		new ChartData{ Country= "Germany", Gold=40 },
		new ChartData{ Country= "Italy", Gold=40 },
		new ChartData{ Country= "Sweden", Gold=30 }
    };
}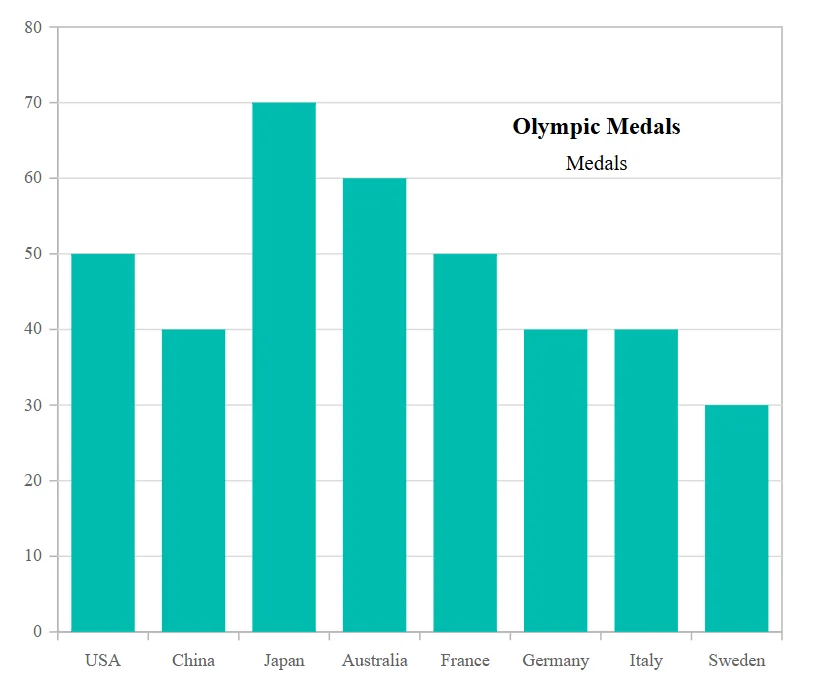
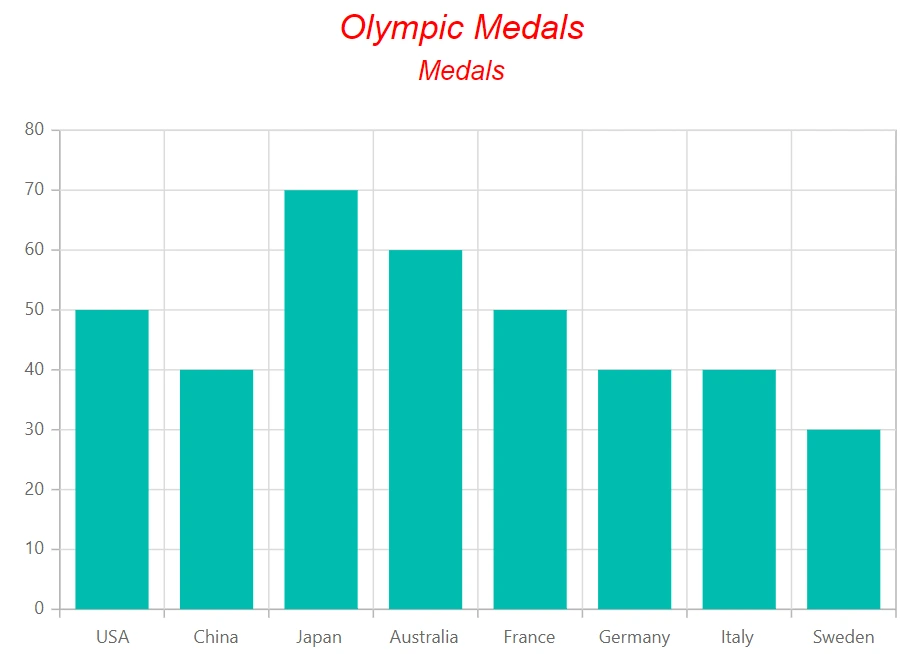
Chart subtitle
The SubTitle property can be used to add a subtitle to the chart in-order to provide additional information about the data displayed.
@using Syncfusion.Blazor.Charts

<SfChart Title="Olympic Medals" SubTitle="Medals">
    <ChartSubTitleStyle FontFamily="Arial" FontStyle="italic" FontWeight="regular" Size="18px" Color="red"></ChartSubTitleStyle>

    <ChartTitleStyle FontFamily="Arial" FontStyle="italic" FontWeight="regular" Size="23px" Color="red"></ChartTitleStyle>

    <ChartPrimaryXAxis ValueType="Syncfusion.Blazor.Charts.ValueType.Category">
    </ChartPrimaryXAxis>

    <ChartSeriesCollection>
        <ChartSeries DataSource="@MedalDetails" XName="Country" YName="Gold" Type="ChartSeriesType.Column">
        </ChartSeries>
    </ChartSeriesCollection>
</SfChart>

@code{
    public class ChartData
    {
        public string Country { get; set; }
        public double Gold { get; set; }
    }

    public List<ChartData> MedalDetails = new List<ChartData>
	{
		new ChartData{ Country= "USA", Gold=50  },
		new ChartData{ Country="China", Gold=40 },
		new ChartData{ Country= "Japan", Gold=70 },
		new ChartData{ Country= "Australia", Gold=60},
		new ChartData{ Country= "France", Gold=50 },
		new ChartData{ Country= "Germany", Gold=40 },
		new ChartData{ Country= "Italy", Gold=40 },
		new ChartData{ Country= "Sweden", Gold=30 }
    };
}
NOTE
The chart components do not use any CSS style for customization; chart elements like axis labels, datalabel, background, series palette, legend text, and tooltip text can be customized by using the ChartAxisLabelStyle, ChartDataLabelFont, BackGround, Palettes, ChartLegendTextStyle, and ChartTooltipTextStyle, respectively.