Print and Export in Blazor Charts Component
28 Jul 202624 minutes to read
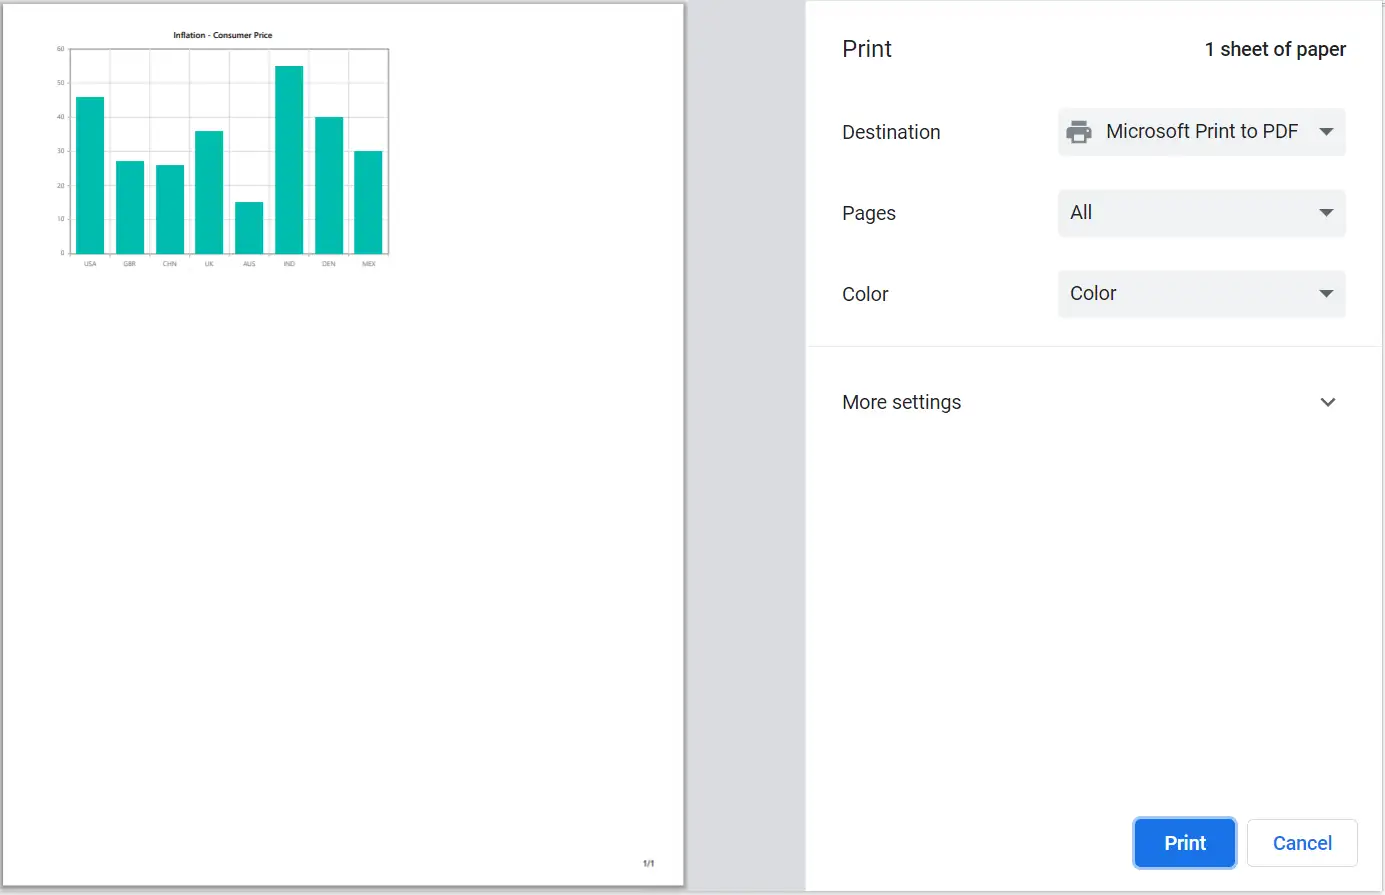
The PrintAsync method can be used to print a rendered chart directly from the browser.
@using Syncfusion.Blazor.Charts
@using Syncfusion.Blazor.Buttons

<SfChart @ref="ChartObj" Title="Inflation - Consumer Price">
    <ChartPrimaryXAxis ValueType="Syncfusion.Blazor.Charts.ValueType.Category">
    </ChartPrimaryXAxis>

    <ChartSeriesCollection>
        <ChartSeries DataSource="@ConsumerDetails" XName="X" YName="YValue" Type="ChartSeriesType.Column">
        </ChartSeries>
    </ChartSeriesCollection>
</SfChart>

<SfButton Id="button" Content="Print" @onclick="Print" IsPrimary="true" CssClass="e-flat"></SfButton>

@code{

    SfChart ChartObj;

    private async Task Print(MouseEventArgs args)
    {
        await ChartObj.PrintAsync();
    }

    public class ChartData
    {
        public string X { get; set; }
        public double YValue { get; set; }
    }

    public List<ChartData> ConsumerDetails = new List<ChartData>
	{
        new ChartData { X= "USA", YValue= 46 },
        new ChartData { X= "GBR", YValue= 27 },
        new ChartData { X= "CHN", YValue= 26 },
        new ChartData { X= "UK", YValue= 36 },
        new ChartData { X= "AUS", YValue= 15 },
        new ChartData { X= "IND", YValue= 55 },
        new ChartData { X= "DEN", YValue= 40 },
        new ChartData { X= "MEX", YValue= 30 }
    };
}
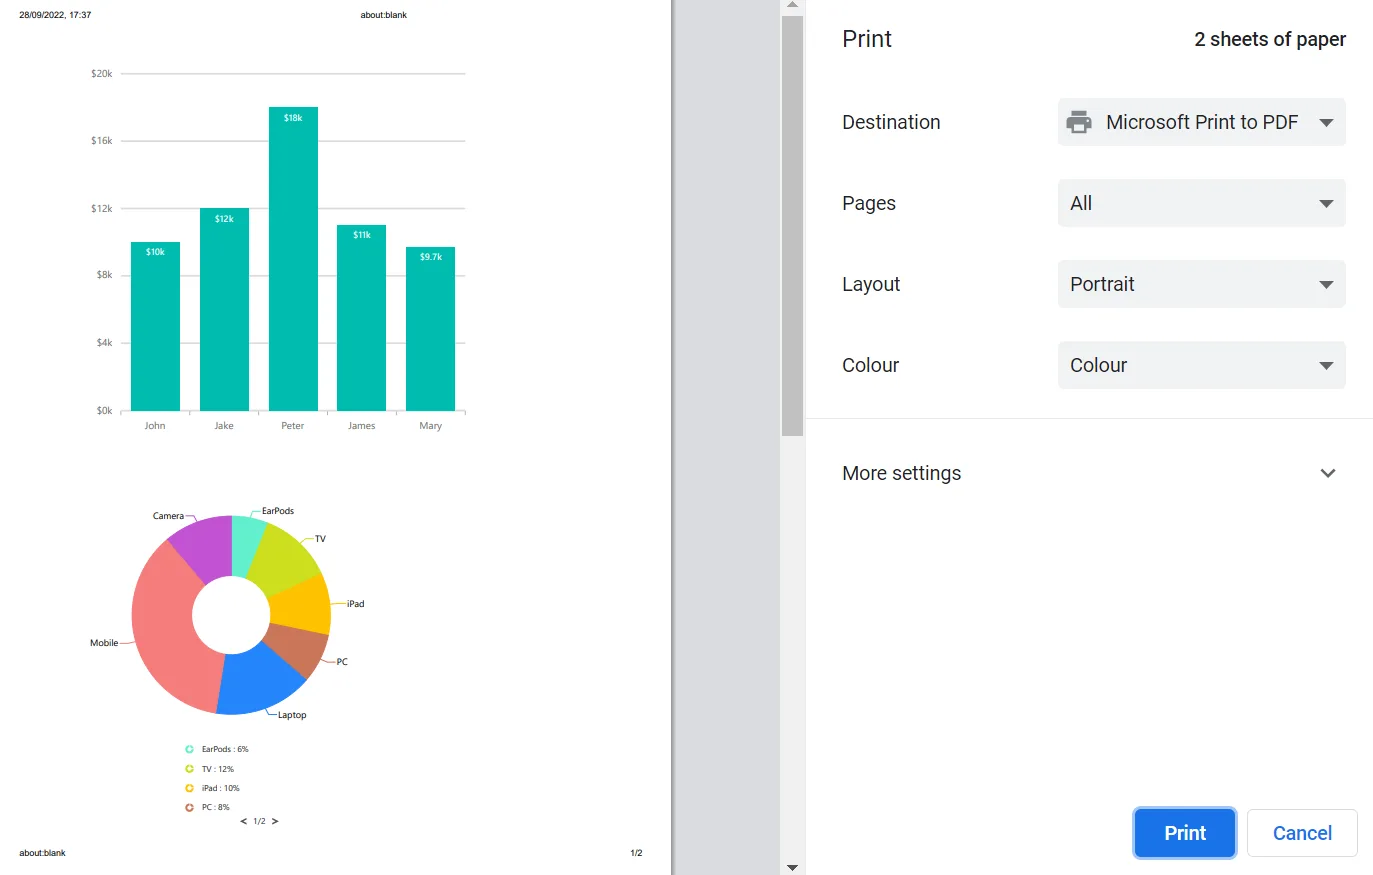
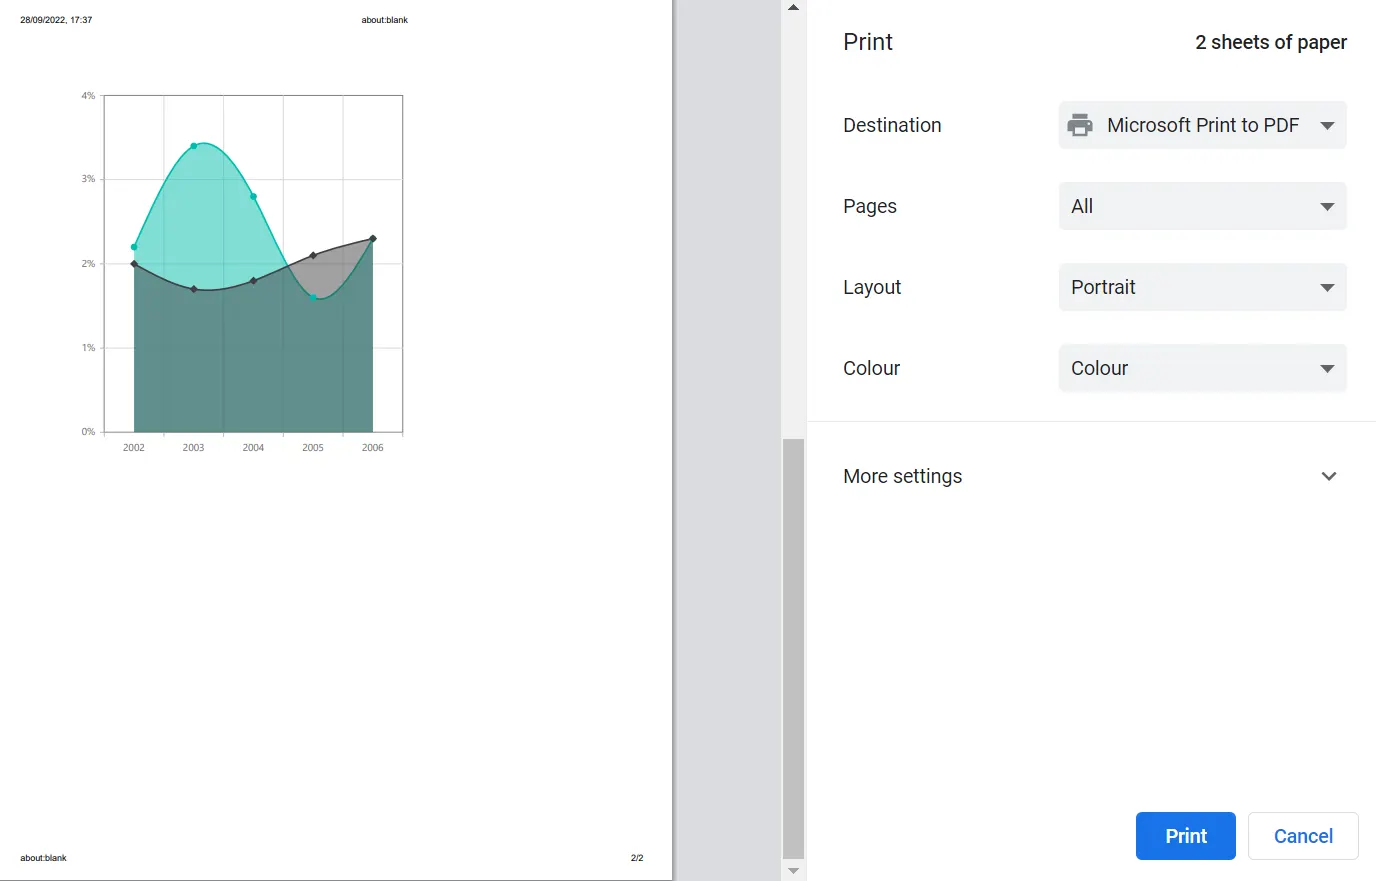
Print - Multiple Charts
Again, the PrintAsync method can be used to print all of the charts on a page by passing the element reference of the parent for all of the charts.
@using Syncfusion.Blazor
@using Syncfusion.Blazor.Charts
@using Syncfusion.Blazor.Buttons

<div class="row">
<div class="col-lg-9 property-section">
    <div class="property-panel-section">
        <div class="property-panel-content">
            <table style="width: 100%">
                <tbody>
                    <tr style="height: 50px; text-align: left">
                        <td>
                           <b>Print the chart - <SfButton ID="button" IsPrimary="true" IsToggle="true" OnClick="PrintChart">Print</SfButton> </b>
                        </td>
                    </tr>
                </tbody>
            </table>
        </div>
    </div>
</div>
</div>

<div class="justify-content-center">
  <div id = "print_support" class="container" style="justify-content:center" @ref="Element">
    <div class="row">
         <div align="center" class="col-sm-1"  style="height:500px; width:600px" >
           <div class="p-5">
              <SfChart @ref="chartInstance">
                        <ChartArea><ChartAreaBorder Width="0"></ChartAreaBorder></ChartArea>
                        <ChartPrimaryXAxis ValueType="Syncfusion.Blazor.Charts.ValueType.Category" Interval="1">
                            <ChartAxisMajorGridLines Width="0"></ChartAxisMajorGridLines>
                        </ChartPrimaryXAxis>
                        <ChartPrimaryYAxis Minimum="0" Maximum="20" Interval="4" LabelFormat="${value}k">
                            <ChartAxisMajorGridLines Width="2"></ChartAxisMajorGridLines>
                            <ChartAxisMajorTickLines Width="0"></ChartAxisMajorTickLines>
                            <ChartAxisLineStyle Width="0"></ChartAxisLineStyle>
                        </ChartPrimaryYAxis>
                        <ChartLegendSettings Visible="false"></ChartLegendSettings>
                        <ChartSeriesCollection>
                            <ChartSeries DataSource="@ChartPoints" XName="Manager" YName="SalesInfo" Type="ChartSeriesType.Column">
                                <ChartMarker>
                                    <ChartDataLabel Visible="true" Name="DataLabelMappingName" Position="Syncfusion.Blazor.Charts.LabelPosition.Top">
                                        <ChartDataLabelFont FontWeight="600" Color="#ffffff"></ChartDataLabelFont>
                                    </ChartDataLabel>
                                </ChartMarker>
                            </ChartSeries>
                        </ChartSeriesCollection>
                  </SfChart>
            </div>
         </div>
         <div align="center" class="col-sm-2" style="height:500px; width:500px">
             <div class="p-5">
                <SfAccumulationChart EnableAnimation="true">
                    <AccumulationChartBorder Color="transparent"></AccumulationChartBorder>
                    <AccumulationChartTooltipSettings Enable="true" Format="${point.x}"></AccumulationChartTooltipSettings>
                    <AccumulationChartSeriesCollection>
                        <AccumulationChartSeries DataSource="@PieChartDataCollection" XName="Product" YName="Percentage" Radius="80%" InnerRadius="40%" Palettes="@palettes">
                            <AccumulationDataLabelSettings Visible="true" Name="TextMapping" Position="AccumulationLabelPosition.Outside">
                                <AccumulationChartConnector Length="8px"></AccumulationChartConnector>
                            </AccumulationDataLabelSettings>
                        </AccumulationChartSeries>
                    </AccumulationChartSeriesCollection>
                    <AccumulationChartLegendSettings Width="130px" ShapePadding="10" Padding="10">
                        <AccumulationChartLegendFont Size="10px"></AccumulationChartLegendFont>
                    </AccumulationChartLegendSettings>
                </SfAccumulationChart>

             </div>
         </div>
    </div>
    <div align="center" class="col-sm-2"  style="height:450px; width:500px">
    <div class="p-5">
        <SfChart>
            <ChartPrimaryXAxis ValueType="Syncfusion.Blazor.Charts.ValueType.DateTimeCategory" LabelFormat="yyyy" IntervalType="IntervalType.Years" EdgeLabelPlacement="EdgeLabelPlacement.Shift">
            </ChartPrimaryXAxis>
            <ChartPrimaryYAxis LabelFormat="{value}%" Minimum="0" Maximum="4" Interval="1">
            </ChartPrimaryYAxis>
            <ChartTooltipSettings Enable="true"></ChartTooltipSettings>
            <ChartLegendSettings Visible="false"></ChartLegendSettings>
            <ChartSeriesCollection>
                <ChartSeries DataSource="@AreaChartPoints" Name="US" XName="Period" Width="2"
                                Opacity="0.5" YName="US_InflationRate" Type="ChartSeriesType.SplineArea">
                    <ChartSeriesBorder Width="2"></ChartSeriesBorder>
                    <ChartMarker IsFilled="true" Visible="true" Width="6" Height="6" Shape="ChartShape.Circle"></ChartMarker>
                </ChartSeries>
                <ChartSeries DataSource="@AreaChartPoints" Name="France" XName="Period" Width="2"
                                Opacity="0.5" YName="FR_InflationRate" Type="ChartSeriesType.SplineArea">
                    <ChartSeriesBorder Width="2"></ChartSeriesBorder>
                    <ChartMarker IsFilled="true" Visible="true" Height="7" Width="7" Shape="ChartShape.Diamond"></ChartMarker>
                </ChartSeries>
            </ChartSeriesCollection>
        </SfChart>
    </div>
    </div>
  </div>
</div>

@code{
    private SfChart chartInstance;
    private ElementReference Element;

     private string[] palettes = new string[] { "#61EFCD", "#CDDE1F", "#FEC200", "#CA765A", "#2485FA", "#F57D7D", "#C152D2",
    "#8854D9", "#3D4EB8", "#00BCD7","#4472c4", "#ed7d31", "#ffc000", "#70ad47", "#5b9bd5", "#c1c1c1", "#6f6fe2", "#e269ae", "#9e480e", "#997300" };

    public async Task PrintChart(MouseEventArgs args)
    {
        await chartInstance.PrintAsync(Element);
    }

    public class ExportData
    {
        public string Manager { get; set; }
        public double SalesInfo { get; set; }
        public string DataLabelMappingName{ get; set; }
    }

    public List<ExportData> ChartPoints { get; set; } = new List<ExportData>
    {
        new ExportData { Manager = "John", SalesInfo = 10, DataLabelMappingName="$10k"},
        new ExportData { Manager = "Jake", SalesInfo = 12, DataLabelMappingName="$12k"},
        new ExportData { Manager = "Peter", SalesInfo = 18, DataLabelMappingName="$18k"},
        new ExportData { Manager = "James", SalesInfo = 11, DataLabelMappingName="$11k"},
        new ExportData { Manager = "Mary", SalesInfo = 9.7, DataLabelMappingName="$9.7k"}
    };

     public class ChartData
     {
        public string Product { get; set; }
        public double Percentage { get; set; }
        public string TextMapping { get; set; }
    }

    public List<ChartData> PieChartDataCollection { get; set; } = new List<ChartData>
    {
        new ChartData { Product = "EarPods : 6%", Percentage = 6, TextMapping = "EarPods"},
        new ChartData { Product = "TV : 12%", Percentage = 12, TextMapping = "TV"},
        new ChartData { Product = "iPad : 10%", Percentage = 10, TextMapping = "iPad"},
        new ChartData { Product = "PC : 8%", Percentage = 8, TextMapping = "PC"},
        new ChartData { Product = "Laptop : 16%",  Percentage = 16, TextMapping = "Laptop"},
        new ChartData { Product = "Mobile : 36%", Percentage = 36, TextMapping = "Mobile"},
        new ChartData { Product = "Camera : 11%", Percentage = 11, TextMapping = "Camera"}
     };

    public class SplineAreaChartData
    {
        public DateTime Period { get; set; }
        public double US_InflationRate { get; set; }
        public double FR_InflationRate { get; set; }
        public double GER_InflationRate { get; set; }
    }

    public List<SplineAreaChartData> AreaChartPoints { get; set; } = new List<SplineAreaChartData>
    {
        new SplineAreaChartData { Period = new DateTime(2002, 01, 01), US_InflationRate = 2.2, FR_InflationRate = 2, GER_InflationRate = 0.8  },
        new SplineAreaChartData { Period = new DateTime(2003, 01, 01), US_InflationRate = 3.4, FR_InflationRate = 1.7, GER_InflationRate = 1.3 },
        new SplineAreaChartData { Period = new DateTime(2004, 01, 01), US_InflationRate = 2.8, FR_InflationRate = 1.8, GER_InflationRate = 1.1 },
        new SplineAreaChartData { Period = new DateTime(2005, 01, 01), US_InflationRate = 1.6, FR_InflationRate = 2.1, GER_InflationRate = 1.6 },
        new SplineAreaChartData { Period = new DateTime(2006, 01, 01), US_InflationRate = 2.3, FR_InflationRate = 2.3, GER_InflationRate = 2 },
    };

}
Export
Using the ExportAsync method, the rendered chart can be exported to JPEG, PNG, SVG, PDF, XLSX or CSV format. The ExportType specifies the file format and FileName specifies the name of the exported file. Both of these parameters are required input parameters for this method.
The optional parameters for this method are,
-
Orientation: Specifies the portrait or landscape orientation in the PDF document. -
AllowDownload: Set this parameter to true to enable the browser’s download prompt to download the chart in the specified format, and false to get the chart as aDataUrlstring. -
IsBase64: Set this parameter to true to indicate that you want the exporting content in the form of abase64string.
@using Syncfusion.Blazor.Charts
@using Syncfusion.Blazor.Buttons

<SfChart @ref="ChartObj" Title="Inflation - Consumer Price">
    <ChartPrimaryXAxis ValueType="Syncfusion.Blazor.Charts.ValueType.Category">
    </ChartPrimaryXAxis>

    <ChartSeriesCollection>
        <ChartSeries DataSource="@ConsumerDetails" XName="X" YName="YValue" Type="ChartSeriesType.Column">
        </ChartSeries>
    </ChartSeriesCollection>
</SfChart>

<SfButton Id="button" Content="Export" @onclick="Export" IsPrimary="true" CssClass="e-flat"></SfButton>

@code{

    SfChart ChartObj;

    private async Task Export(MouseEventArgs args)
    {
        await ChartObj.ExportAsync(ExportType.PNG, "pngImage");
    }

    public class ChartData
    {
        public string X { get; set; }
        public double YValue { get; set; }
    }

    public List<ChartData> ConsumerDetails = new List<ChartData>
    {
        new ChartData { X= "USA", YValue= 46 },
        new ChartData { X= "GBR", YValue= 27 },
        new ChartData { X= "CHN", YValue= 26 },
        new ChartData { X= "UK", YValue= 36 },
        new ChartData { X= "AUS", YValue= 15 },
        new ChartData { X= "IND", YValue= 55 },
        new ChartData { X= "DEN", YValue= 40 },
        new ChartData { X= "MEX", YValue= 30 }
    };
}
Export chart as base64 string
If you set IsBase64 parameter to true while calling the ExportAsync method, the chart will be converted into a base64 string, and you will be able to get the base64 string in the OnExportComplete event argument.
@using Syncfusion.Blazor.Charts;
@using Microsoft.AspNetCore.Components.Web;
@using Syncfusion.PdfExport;

<div id="button">
    <button onclick="@ExportChart">
        Export
    </button>
</div>

<div id="chart">
    <SfChart @ref="@chartInstance">
        <ChartArea><ChartAreaBorder Width="0"></ChartAreaBorder></ChartArea>
        <ChartPrimaryXAxis ValueType="Syncfusion.Blazor.Charts.ValueType.Category" Interval="1" LabelIntersectAction="@Label" LabelRotation="-45">
            <ChartAxisMajorGridLines Width="0"></ChartAxisMajorGridLines>
            <ChartAxisMajorTickLines Width="0"></ChartAxisMajorTickLines>
        </ChartPrimaryXAxis>
        <ChartPrimaryYAxis Minimum="0" Maximum="40" Interval="10" Title="Measurements (in Gigawatt)" LabelFormat="@Format">
            <ChartAxisMajorGridLines Width="0"></ChartAxisMajorGridLines>
            <ChartAxisLineStyle Width="0"></ChartAxisLineStyle>
            <ChartAxisMajorGridLines Width="2"></ChartAxisMajorGridLines>
            <ChartAxisMajorTickLines Width="0"></ChartAxisMajorTickLines>
        </ChartPrimaryYAxis>
        <ChartSeriesCollection>
            <ChartSeries DataSource="@ChartPoints" XName="Country" YName="GigaWatts" Type="ChartSeriesType.Column">
                <ChartMarker>
                    <ChartDataLabel Visible="true" Position="Syncfusion.Blazor.Charts.LabelPosition.Top">
                        <ChartDataLabelFont FontWeight="600" Size="9px" Color="#ffffff"></ChartDataLabelFont>
                    </ChartDataLabel>
                </ChartMarker>
            </ChartSeries>
        </ChartSeriesCollection>
        <ChartEvents OnExportComplete="ExportComplete"></ChartEvents>
    </SfChart>
</div>


@code{
    private SfChart chartInstance;
    public string FileName { get; set; } = "Charts";
    public string Format { get; set; } = "{value} GW";
    public LabelIntersectAction Label { get; set; } = LabelIntersectAction.Trim;

    public List<ExportData> ChartPoints { get; set; } = new List<ExportData>
    {
        new ExportData { Country="India", GigaWatts = 35.5 },
        new ExportData { Country="China", GigaWatts = 18.3 },
        new ExportData { Country="Italy", GigaWatts = 17.6 },
        new ExportData { Country="Japan", GigaWatts = 13.6 },
        new ExportData { Country="United state", GigaWatts = 12 },
        new ExportData { Country="Spain", GigaWatts = 5.6 },
        new ExportData { Country="France", GigaWatts = 4.6 },
        new ExportData { Country="Australia", GigaWatts = 3.3 },
        new ExportData { Country="Belgium", GigaWatts = 3 },
        new ExportData { Country="United Kingdom", GigaWatts = 2.9 },
    };

    public async Task ExportChart(MouseEventArgs args)
    {
        await chartInstance.ExportAsync(ExportType.PDF, FileName, PdfPageOrientation.Landscape, false, true);
    }

    public class ExportData
    {
        public string Country { get; set; }
        public double GigaWatts { get; set; }
    }

    public void ExportComplete(ExportEventArgs exportEventArgs)
    {
        string base64 = exportEventArgs.Base64;
    }
}
Customizing the exported chart using Exporting event
The Exporting event allows users to customize the exported chart before it is generated. The ChartExportEventArgs class provides the following options for customizing the exported chart:
-
Cancel: This property cancels the export process when set to true. -
Height: This property specifies the height of the exported chart. When the value is changed, the chart’s height is updated. It is not applicable for XLSX and CSV formats. -
Width: This property specifies the width of the exported chart. Changing the value updates the chart’s width. It is not applicable for XLSX and CSV formats. -
Workbook: Represents the workbook generated during export, applicable only for XLSX and CSV formats.
Customizing the exported Excel documents
The Workbook property in the event argument of Exporting event allows the users to customize the exported Excel sheet by modifying the properties of rows, columns, and cells, such as changing the font color, font size, font name, making the text bold, setting a background color, and center-aligning the text within the cells, before the file is generated.
In the code example below, the chart is exported to Excel format. The exported Excel document is customized using the Exporting event. If the ExportType parameter in the ExportAsync method is set to something other than XLSX or CSV, the Workbook property will be null, and the chart’s width will be set to 500px.
@using Syncfusion.Blazor.Charts;
@using Microsoft.AspNetCore.Components.Web;
@using Syncfusion.PdfExport;
@using Syncfusion.ExcelExport;

<div id="button">
    <button onclick="@ExportChart">
        Export
    </button>
</div>
<div id="chart">
    <SfChart @ref="@chartInstance" Title="Top 10 Countries Using Solar Power" Theme=" Syncfusion.Blazor.Theme.Tailwind3">
        <ChartArea><ChartAreaBorder Width="0"></ChartAreaBorder></ChartArea>
        <ChartPrimaryXAxis Title="XaxisTitle" ValueType="Syncfusion.Blazor.Charts.ValueType.Category" Interval="1" LabelIntersectAction="@Label" LabelRotation="-45">
            <ChartAxisMajorGridLines Width="0"></ChartAxisMajorGridLines>
            <ChartAxisMajorTickLines Width="0"></ChartAxisMajorTickLines>
        </ChartPrimaryXAxis>
        <ChartPrimaryYAxis Minimum="0" Maximum="40" Interval="10" Title="Measurements (in Gigawatt)" LabelFormat="@Format">
            <ChartAxisMajorGridLines Width="0"></ChartAxisMajorGridLines>
            <ChartAxisLineStyle Width="0"></ChartAxisLineStyle>
            <ChartAxisMajorGridLines Width="2"></ChartAxisMajorGridLines>
            <ChartAxisMajorTickLines Width="0"></ChartAxisMajorTickLines>
        </ChartPrimaryYAxis>
        <ChartSeriesCollection>
            <ChartSeries DataSource="@ChartPoints" XName="Country" YName="GigaWatts" Type="ChartSeriesType.Column">
                <ChartMarker>
                    <ChartDataLabel Visible="true" Position="Syncfusion.Blazor.Charts.LabelPosition.Top">
                        <ChartDataLabelFont FontWeight="600" Size="9px" Color="#ffffff"></ChartDataLabelFont>
                    </ChartDataLabel>
                </ChartMarker>
            </ChartSeries>
        </ChartSeriesCollection>
        <ChartEvents Exporting="BeforeExport"></ChartEvents>
    </SfChart>
</div>
@code {
    private SfChart chartInstance;
    public string FileName { get; set; } = "Charts";
    public string Format { get; set; } = "{value} GW";
    public Syncfusion.Blazor.Charts.LabelIntersectAction Label { get; set; } = Syncfusion.Blazor.Charts.LabelIntersectAction.Trim;
    public List<ExportData> ChartPoints { get; set; } = new List<ExportData>
    {
        new ExportData { Country="India", GigaWatts = 35.5 },
        new ExportData { Country="China", GigaWatts = 18.3 },
        new ExportData { Country="Italy", GigaWatts = 17.6 },
        new ExportData { Country="Japan", GigaWatts = 13.6 },
        new ExportData { Country="United state", GigaWatts = 12 },
        new ExportData { Country="Spain", GigaWatts = 5.6 },
        new ExportData { Country="France", GigaWatts = 4.6 },
        new ExportData { Country="Australia", GigaWatts = 3.3 },
        new ExportData { Country="Belgium", GigaWatts = 3 },
        new ExportData { Country="United Kingdom", GigaWatts = 2.9 },
    };
    public async Task ExportChart(Microsoft.AspNetCore.Components.Web.MouseEventArgs args)
    {
        await chartInstance.ExportAsync(Syncfusion.Blazor.Charts.ExportType.XLSX, FileName);
    }
    public void BeforeExport(ChartExportEventArgs args)
    {
        if (args.Workbook != null)
        {
            Worksheet firstSheet = args.Workbook.Worksheets.First();
            firstSheet.Columns[0].Width = 500;
            firstSheet.Columns[1].Width = 500;
            firstSheet.Rows[1].Cells[0].Value = "Country";
            firstSheet.Rows[1].Cells[1].Value = "GigaWatts";
            firstSheet.Rows[0].Cells[0].CellStyle.BackColor = "#FFA07A";
            for (int i = 0; i < 2; i++)
            {
                firstSheet.Rows[1].Cells[i].CellStyle.Bold = true;
                firstSheet.Rows[1].Cells[i].CellStyle.BackColor = "#FFFF00";
            }
            for (int i = 2; i < firstSheet.Rows.Count; i++)
            {
                for (int j = 0; j < 2; j++)
                {
                    firstSheet.Rows[i].Height = 50;
                    firstSheet.Rows[i].Cells[1].CellStyle.HAlign = HAlignType.Center;
                    firstSheet.Rows[i].Cells[1].CellStyle.VAlign = VAlignType.Center;
                }
            }
        } else {
            args.Width = 500;
        }
    }
    public class ExportData
    {
        public string Country { get; set; }
        public double GigaWatts { get; set; }
    }
}NOTE
Refer to the Blazor Charts feature tour page for its groundbreaking feature representations and also explore the Blazor Chart Example to know various chart types and how to represent time-dependent data, showing trends at equal intervals.