Mixed Chart in Blazor Charts Component
6 Aug 20245 minutes to read
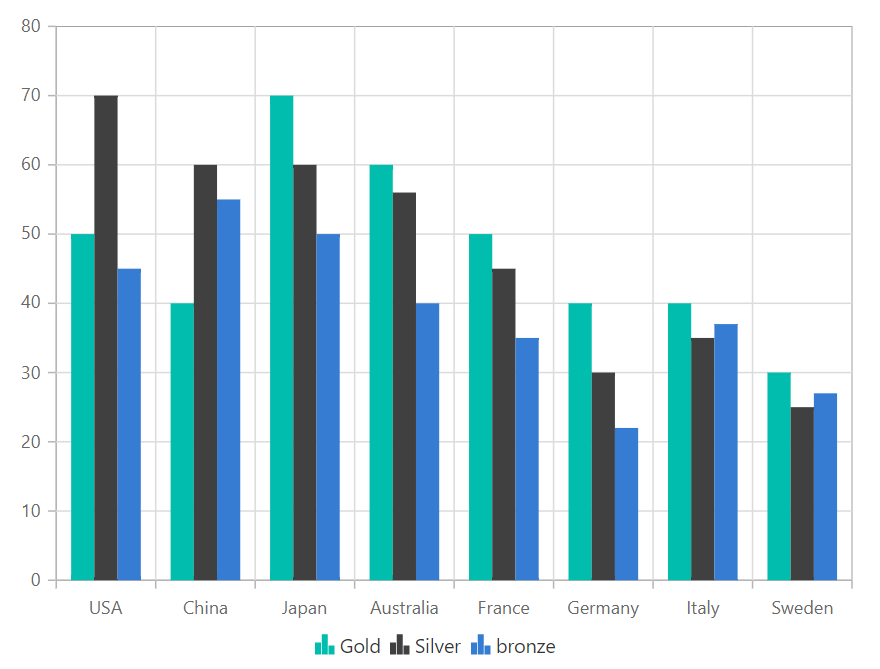
Multiple chart series
The ChartSeries property allows to add multiple series to the chart. The series are rendered in the order they were added to the series array.
@using Syncfusion.Blazor.Charts

<SfChart>
    <ChartPrimaryXAxis ValueType="Syncfusion.Blazor.Charts.ValueType.Category"></ChartPrimaryXAxis>

    <ChartSeriesCollection>
        <ChartSeries DataSource="@MedalDetails" Name="Gold" XName="Country" Width="2" Opacity="1" YName="Gold" Type="ChartSeriesType.Column">
        </ChartSeries>
        <ChartSeries DataSource="@MedalDetails" Name="Silver" XName="Country" Width="2" Opacity="1" YName="Silver" Type="ChartSeriesType.Column">
        </ChartSeries>
        <ChartSeries DataSource="@MedalDetails" Name="bronze" XName="Country" Width="2" Opacity="1" YName="Bronze" Type="ChartSeriesType.Column">
        </ChartSeries>
    </ChartSeriesCollection>
</SfChart>

@code{
    public class ChartData
    {
        public string Country { get; set; }
        public double Gold { get; set; }
        public double Silver { get; set; }
        public double Bronze { get; set; }
    }

    public List<ChartData> MedalDetails = new List<ChartData>
	{
        new ChartData{ Country= "USA", Gold=50, Silver=70, Bronze=45 },
        new ChartData{ Country="China", Gold=40, Silver= 60, Bronze=55 },
        new ChartData{ Country= "Japan", Gold=70, Silver= 60, Bronze=50 },
        new ChartData{ Country= "Australia", Gold=60, Silver= 56, Bronze=40 },
        new ChartData{ Country= "France", Gold=50, Silver= 45, Bronze=35 },
        new ChartData{ Country= "Germany", Gold=40, Silver=30, Bronze=22 },
        new ChartData{ Country= "Italy", Gold=40, Silver=35, Bronze=37 },
        new ChartData{ Country= "Sweden", Gold=30, Silver=25, Bronze=27 }
    };
}
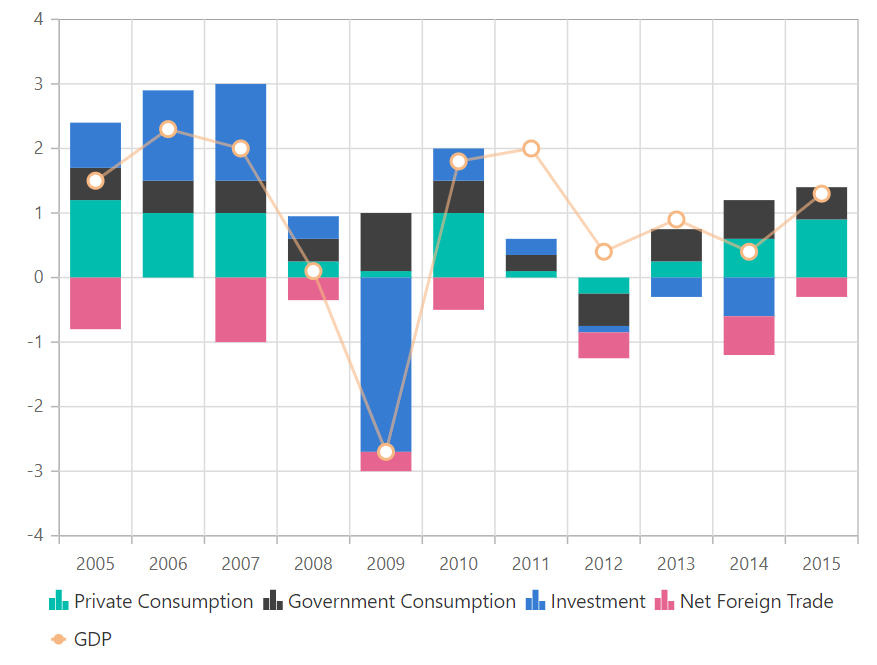
Combination chart series
A chart can be created by combining several chart types such as line, column, and so on.
NOTE
Bar series cannot be combined with any other series as the axis orientation is different from other series.
@using Syncfusion.Blazor.Charts

<SfChart>
    <ChartPrimaryXAxis ValueType="Syncfusion.Blazor.Charts.ValueType.Category"></ChartPrimaryXAxis>

    <ChartSeriesCollection>
        <ChartSeries DataSource="@SalesReports" Name="Private Consumption" XName="X" YName="Y" Type="ChartSeriesType.StackingColumn">
        </ChartSeries>
        <ChartSeries DataSource="@SalesReports" Name="Government Consumption" XName="X" YName="Y1" Type="ChartSeriesType.StackingColumn">
        </ChartSeries>
        <ChartSeries DataSource="@SalesReports" Name="Investment" XName="X" YName="Y2" Type="ChartSeriesType.StackingColumn">
        </ChartSeries>
        <ChartSeries DataSource="@SalesReports" Name="Net Foreign Trade" XName="X" YName="Y3" Type="ChartSeriesType.StackingColumn">
        </ChartSeries>
        <ChartSeries DataSource="@SalesReports" Name="GDP" XName="X" YName="Y4" Width="2" Opacity="0.6" Type="ChartSeriesType.Line">
            <ChartMarker Visible="true" Height="10" Width="10"></ChartMarker>
        </ChartSeries>
    </ChartSeriesCollection>
</SfChart>

@code{
    public class ChartData
    {
        public string X { get; set; }
        public double Y { get; set; }
        public double Y1 { get; set; }
        public double Y2 { get; set; }
        public double Y3 { get; set; }
        public double Y4 { get; set; }
    }

    public List<ChartData> SalesReports = new List<ChartData>
	{
        new ChartData { X= "2005", Y= 1.2, Y1= 0.5, Y2= 0.7, Y3= -0.8, Y4= 1.5 },
        new ChartData { X= "2006", Y= 1, Y1= 0.5, Y2= 1.4, Y3= 0, Y4= 2.3 },
        new ChartData { X= "2007", Y= 1, Y1= 0.5, Y2= 1.5, Y3= -1, Y4= 2 },
        new ChartData { X= "2008", Y= 0.25, Y1= 0.35, Y2= 0.35, Y3= -.35, Y4= 0.1 },
        new ChartData { X= "2009", Y= 0.1, Y1= 0.9, Y2= -2.7, Y3= -0.3, Y4= -2.7 },
        new ChartData { X= "2010", Y= 1, Y1= 0.5, Y2= 0.5, Y3= -0.5, Y4= 1.8 },
        new ChartData { X= "2011", Y= 0.1, Y1= 0.25, Y2= 0.25, Y3= 0, Y4= 2 },
        new ChartData { X= "2012", Y= -0.25, Y1= -0.5, Y2= -0.1, Y3= -0.4, Y4= 0.4 },
        new ChartData { X= "2013", Y= 0.25, Y1= 0.5, Y2= -0.3, Y3= 0, Y4= 0.9 },
        new ChartData { X= "2014", Y= 0.6, Y1= 0.6, Y2= -0.6, Y3= -0.6, Y4= 0.4 },
        new ChartData { X= "2015", Y= 0.9, Y1= 0.5, Y2= 0, Y3= -0.3, Y4= 1.3 }
    };
}
NOTE
Refer to our Blazor Charts feature tour page for its groundbreaking feature representations and also explore our Blazor Chart Example to know various chart types and how to represent time-dependent data, showing trends at equal intervals.