Error Bar in Blazor Charts Component
28 Jul 202612 minutes to read
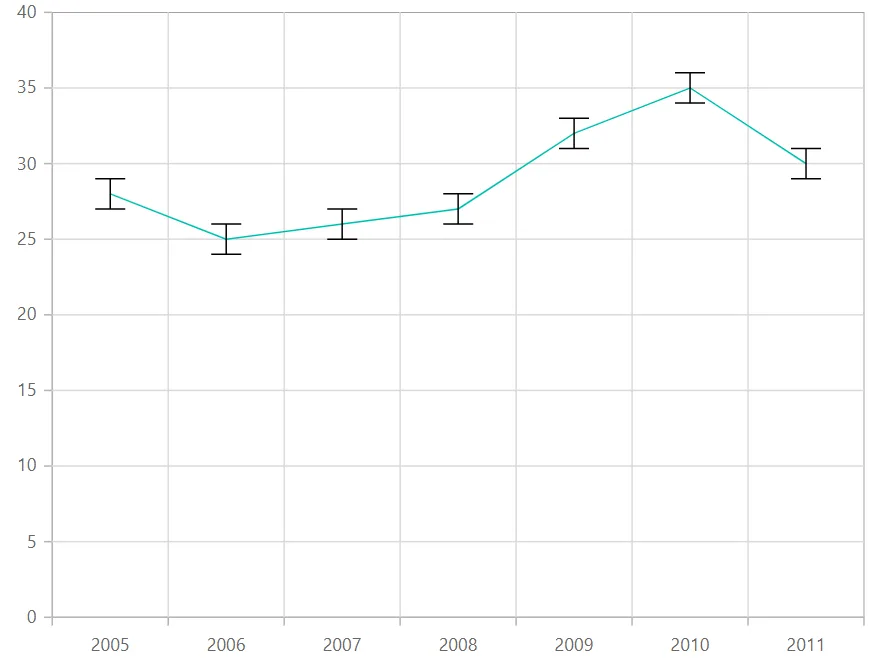
Error bar
Error bars are graphical representations of the variability of data that are used on graphs to indicate the error or uncertainty in a reported measurement. To render the error bar for the series, set Visible property to true in ChartErrorBarSettings.
@using Syncfusion.Blazor.Charts

<SfChart>
    <ChartPrimaryXAxis ValueType="Syncfusion.Blazor.Charts.ValueType.Category">
    </ChartPrimaryXAxis>

    <ChartSeriesCollection>
        <ChartSeries DataSource="@SalesReports" XName="X" YName="Y" Type="ChartSeriesType.Line">
            <ChartErrorBarSettings Visible="true">
            </ChartErrorBarSettings>
        </ChartSeries>
    </ChartSeriesCollection>
</SfChart>

@code{
    public class ChartData
    {
        public double X { get; set; }
        public double Y {get; set; }
    }

    public List<ChartData> SalesReports = new List<ChartData>
	{
        new ChartData{ X= 2005, Y= 28 },
        new ChartData{ X= 2006, Y= 25 },
        new ChartData{ X= 2007, Y= 26 },
        new ChartData{ X= 2008, Y= 27 },
        new ChartData{ X= 2009, Y= 32 },
        new ChartData{ X= 2010, Y= 35 },
        new ChartData{ X= 2011, Y= 30 }
    };
}
Error bar type
To change the error bar rendering type, set Type property in ChartErrorBarSettings and to change the error bar line length, use VerticalError property in ChartErrorBarSettings.
@using Syncfusion.Blazor.Charts

<SfChart>
    <ChartPrimaryXAxis ValueType="Syncfusion.Blazor.Charts.ValueType.Category">
    </ChartPrimaryXAxis>

    <ChartSeriesCollection>
        <ChartSeries DataSource="@SalesReports" XName="X" YName="Y" Type="ChartSeriesType.Line">
            <ChartErrorBarSettings Visible="true" Type="ErrorBarType.Percentage" VerticalError="4">
            </ChartErrorBarSettings>
        </ChartSeries>
    </ChartSeriesCollection>
</SfChart>

@code{
    public class ChartData
    {
        public double X { get; set; }
        public double Y { get; set; }
    }

    public List<ChartData> SalesReports = new List<ChartData>
	{
        new ChartData{ X= 2005, Y= 28 },
        new ChartData{ X= 2006, Y= 25 },
        new ChartData{ X= 2007, Y= 26 },
        new ChartData{ X= 2008, Y= 27 },
        new ChartData{ X= 2009, Y= 32 },
        new ChartData{ X= 2010, Y= 35 },
        new ChartData{ X= 2011, Y= 30 }
    };
}Customizing error bar type
To customize the error bar type, specify the Type property to Custom and then change the HorizontalNegativeError and HorizontalPositiveError properties in ChartErrorBarSettings.
@using Syncfusion.Blazor.Charts

<SfChart>
    <ChartPrimaryXAxis ValueType="Syncfusion.Blazor.Charts.ValueType.Category">
    </ChartPrimaryXAxis>

    <ChartSeriesCollection>
        <ChartSeries DataSource="@SalesReports" XName="X" YName="Y" Type="ChartSeriesType.Line">
            <ChartErrorBarSettings Visible="true" Type="ErrorBarType.Custom" Mode="ErrorBarMode.Both"
                                   VerticalPositiveError="2" HorizontalPositiveError="1" VerticalNegativeError="2" HorizontalNegativeError="1">
            </ChartErrorBarSettings>
        </ChartSeries>
    </ChartSeriesCollection>
</SfChart>

@code{
    public class ChartData
    {
        public double X { get; set; }
        public double Y { get; set; }
    }

    public List<ChartData> SalesReports = new List<ChartData>
	{
        new ChartData{ X= 2005, Y= 28 },
        new ChartData{ X= 2006, Y= 25 },
        new ChartData{ X= 2007, Y= 26 },
        new ChartData{ X= 2008, Y= 27 },
        new ChartData{ X= 2009, Y= 32 },
        new ChartData{ X= 2010, Y= 35 },
        new ChartData{ X= 2011, Y= 30 }
    };
}Error bar mode
Error bar mode is used to define whether the error bar line should be drawn horizontally, vertically, or on both sides. To change the error bar mode, use Mode property in ChartErrorBarSettings.
@using Syncfusion.Blazor.Charts

<SfChart>
    <ChartPrimaryXAxis ValueType="Syncfusion.Blazor.Charts.ValueType.Category">
    </ChartPrimaryXAxis>

    <ChartSeriesCollection>
        <ChartSeries DataSource="@SalesReports" XName="X" YName="Y" Type="ChartSeriesType.Line">
            <ChartErrorBarSettings Visible="true" Mode="ErrorBarMode.Horizontal">
            </ChartErrorBarSettings>
        </ChartSeries>
    </ChartSeriesCollection>
</SfChart>

@code{
    public class ChartData
    {
        public double X { get; set; }
        public double Y { get; set; }
    }

    public List<ChartData> SalesReports = new List<ChartData>
	{
        new ChartData{ X= 2005, Y= 28 },
        new ChartData{ X= 2006, Y= 25 },
        new ChartData{ X= 2007, Y= 26 },
        new ChartData{ X= 2008, Y= 27 },
        new ChartData{ X= 2009, Y= 32 },
        new ChartData{ X= 2010, Y= 35 },
        new ChartData{ X= 2011, Y= 30 }
    };
}Error bar direction
To change the error bar direction to plus, minus, or both sides, use Direction property in ChartErrorBarSettings.
@using Syncfusion.Blazor.Charts

<SfChart>
    <ChartPrimaryXAxis ValueType="Syncfusion.Blazor.Charts.ValueType.Category">
    </ChartPrimaryXAxis>

    <ChartSeriesCollection>
        <ChartSeries DataSource="@SalesReports" XName="X" YName="Y" Type="ChartSeriesType.Line">
            <ChartErrorBarSettings Visible="true" Mode="ErrorBarMode.Both" Direction="ErrorBarDirection.Minus">
            </ChartErrorBarSettings>
        </ChartSeries>
    </ChartSeriesCollection>
</SfChart>

@code{
    public class ChartData
    {
        public double X { get; set; }
        public double Y { get; set; }
    }

    public List<ChartData> SalesReports = new List<ChartData>
	{
        new ChartData{ X= 2005, Y= 28 },
        new ChartData{ X= 2006, Y= 25 },
        new ChartData{ X= 2007, Y= 26 },
        new ChartData{ X= 2008, Y= 27 },
        new ChartData{ X= 2009, Y= 32 },
        new ChartData{ X= 2010, Y= 35 },
        new ChartData{ X= 2011, Y= 30 }
    };
}Customizing error bar cap
To customize the error bar cap Length, Width and Color properties in ChartErrorBarCapSettings.
@using Syncfusion.Blazor.Charts

<SfChart>
    <ChartPrimaryXAxis ValueType="Syncfusion.Blazor.Charts.ValueType.Category">
    </ChartPrimaryXAxis>

    <ChartSeriesCollection>
        <ChartSeries DataSource="@SalesReports" XName="X" YName="Y" Type="ChartSeriesType.Line">
            <ChartErrorBarSettings Visible="true">
                <ChartErrorBarCapSettings Length="10" Width="10" Color="#0000ff"></ChartErrorBarCapSettings>
            </ChartErrorBarSettings>
        </ChartSeries>
    </ChartSeriesCollection>
</SfChart>

@code{
    public class ChartData
    {
        public double X { get; set; }
        public double Y { get; set; }
    }

    public List<ChartData> SalesReports = new List<ChartData>
	{
        new ChartData{ X= 2005, Y= 28 },
        new ChartData{ X= 2006, Y= 25 },
        new ChartData{ X= 2007, Y= 26 },
        new ChartData{ X= 2008, Y= 27 },
        new ChartData{ X= 2009, Y= 32 },
        new ChartData{ X= 2010, Y= 35 },
        new ChartData{ X= 2011, Y= 30 }
    };
}Events
Series render
The OnSeriesRender event allows you to customize series properties, such as Data, Fill, and Series, before they are rendered on the chart.
@using Syncfusion.Blazor.Charts

<SfChart>
    <ChartEvents OnSeriesRender="SeriesRender"></ChartEvents>

    <ChartPrimaryXAxis ValueType="Syncfusion.Blazor.Charts.ValueType.Category">
    </ChartPrimaryXAxis>

    <ChartSeriesCollection>
        <ChartSeries DataSource="@SalesReports" XName="X" YName="Y" Type="Syncfusion.Blazor.Charts.ChartSeriesType.Line">
            <ChartErrorBarSettings Visible="true">
            </ChartErrorBarSettings>
        </ChartSeries>
    </ChartSeriesCollection>
</SfChart>

@code {
    public class ChartData
    {
        public double X { get; set; }
        public double Y { get; set; }
    }

    public void SeriesRender(SeriesRenderEventArgs args)
    {
        args.Fill = "#FF4081";
    }

    public List<ChartData> SalesReports = new List<ChartData>
    {
        new ChartData{ X= 2005, Y= 28 },
        new ChartData{ X= 2006, Y= 25 },
        new ChartData{ X= 2007, Y= 26 },
        new ChartData{ X= 2008, Y= 27 },
        new ChartData{ X= 2009, Y= 32 },
        new ChartData{ X= 2010, Y= 35 },
        new ChartData{ X= 2011, Y= 30 }
    };
}Point render
The OnPointRender event allows you to customize each data point before it is rendered on the chart.
@using Syncfusion.Blazor.Charts

<SfChart>
    <ChartEvents OnPointRender="PointRender"></ChartEvents>

    <ChartPrimaryXAxis ValueType="Syncfusion.Blazor.Charts.ValueType.Category">
    </ChartPrimaryXAxis>

    <ChartSeriesCollection>
        <ChartSeries DataSource="@SalesReports" XName="X" YName="Y" Type="Syncfusion.Blazor.Charts.ChartSeriesType.Line">
            <ChartErrorBarSettings Visible="true">
            </ChartErrorBarSettings>
            <ChartMarker Visible="true" Height="10" Width="10"></ChartMarker>
        </ChartSeries>
    </ChartSeriesCollection>
</SfChart>

@code {
    public class ChartData
    {
        public double X { get; set; }
        public double Y { get; set; }
    }

    public void PointRender(PointRenderEventArgs args)
    {
        args.Fill = args.Point.X.ToString() == "2008" ? "#E91E63" : "#3F51B5";
    }

    public List<ChartData> SalesReports = new List<ChartData>
    {
        new ChartData{ X= 2005, Y= 28 },
        new ChartData{ X= 2006, Y= 25 },
        new ChartData{ X= 2007, Y= 26 },
        new ChartData{ X= 2008, Y= 27 },
        new ChartData{ X= 2009, Y= 32 },
        new ChartData{ X= 2010, Y= 35 },
        new ChartData{ X= 2011, Y= 30 }
    };
}NOTE
Refer to the Blazor Charts feature tour page for its groundbreaking feature representations and also explore the Blazor Chart Example to know various chart types and how to represent time-dependent data, showing trends at equal intervals.