Radar in Blazor Charts Component
16 Jul 202616 minutes to read
Radar
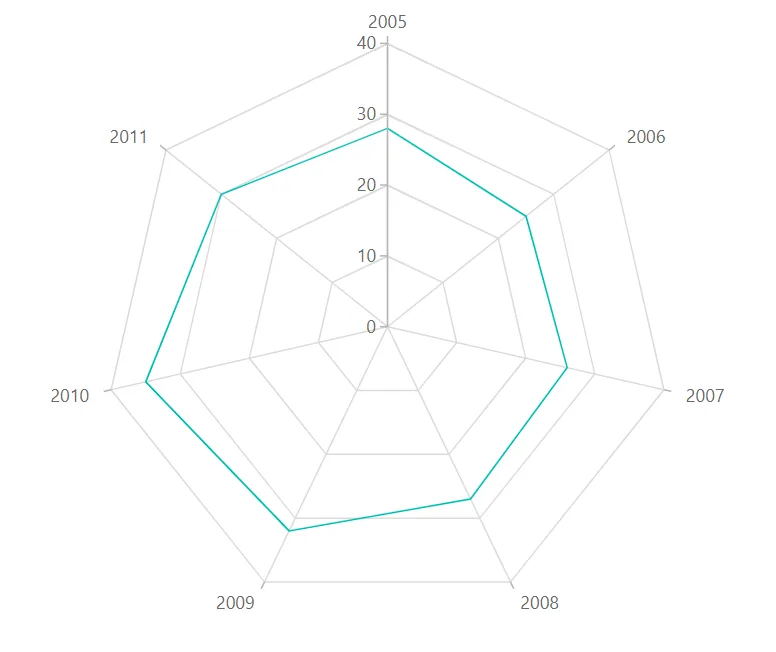
Radar series visualizes data in terms of values and angles. It provides option for visual comparison between several quantitative or qualitative aspects of a situation.
A detailed demonstration of the process for creating a Radar chart using Blazor Charts is presented in the video below.
To render a radar chart, set the series Type to Radar. To render a Line series in Radar Chart, specify the DrawType property to Line. IsClosed property specifies whether to join start and end point of a line series used in Radar Chart to form a closed path. The default value of IsClosed property is true.
@using Syncfusion.Blazor.Charts

<SfChart>
    <ChartPrimaryXAxis ValueType="Syncfusion.Blazor.Charts.ValueType.Category">
    </ChartPrimaryXAxis>

    <ChartSeriesCollection>
        <ChartSeries DataSource="@SalesReports" XName="X" YName="Y"
                     Type="ChartSeriesType.Radar" DrawType="ChartDrawType.Line">
        </ChartSeries>
    </ChartSeriesCollection>
</SfChart>

@code{
    public class ChartData
    {
        public double X { get; set; }
        public double Y { get; set; }
    }

    public List<ChartData> SalesReports = new List<ChartData>
	{
        new ChartData{ X= 2005, Y= 28 },
        new ChartData{ X= 2006, Y= 25 },
        new ChartData{ X= 2007, Y= 26 },
        new ChartData{ X= 2008, Y= 27 },
        new ChartData{ X= 2009, Y= 32 },
        new ChartData{ X= 2010, Y= 35 },
        new ChartData{ X= 2011, Y= 30 }
    };
}
NOTE
Refer to the Blazor Radar Chart feature tour page to know about its other groundbreaking feature representations. Explore the Blazor Radar Chart Example to know how to render and configure the Radar type chart.
Draw type
Similar to the polar chart, use the DrawType property to change the series plotting type in a Radar chart to line, column, area, range column, spline, scatter, stacking area, spline area, or stacking column. The default value of DrawType is Line.
@using Syncfusion.Blazor.Charts

<SfChart>
    <ChartPrimaryXAxis ValueType="Syncfusion.Blazor.Charts.ValueType.Category">
    </ChartPrimaryXAxis>

    <ChartSeriesCollection>
        <ChartSeries DataSource="@SalesReports" XName="X" YName="Y"
                     Type="ChartSeriesType.Radar" DrawType="ChartDrawType.Line">
        </ChartSeries>
    </ChartSeriesCollection>
</SfChart>

@code{
    public class ChartData
    {
        public double X { get; set; }
        public double Y { get; set; }
    }

    public List<ChartData> SalesReports = new List<ChartData>
	{
        new ChartData{ X= 2005, Y= 28 },
        new ChartData{ X= 2006, Y= 25 },
        new ChartData{ X= 2007, Y= 26 },
        new ChartData{ X= 2008, Y= 27 },
        new ChartData{ X= 2009, Y= 32 },
        new ChartData{ X= 2010, Y= 35 },
        new ChartData{ X= 2011, Y= 30 }
    };
}Binding data with series
You can bind data to the chart using the DataSource property within the series configuration. The DataSource value can be set using either SfDataManager property values or a list of business objects. More information on data binding can be found here. To display the data correctly, map the fields from the data to the chart series’ XName and YName properties.
@using Syncfusion.Blazor.Charts

<SfChart>
    <ChartPrimaryXAxis ValueType="Syncfusion.Blazor.Charts.ValueType.Category">
    </ChartPrimaryXAxis>

    <ChartSeriesCollection>
        <ChartSeries DataSource="@SalesReports" XName="X" YName="Y"
                     Type="ChartSeriesType.Radar">
        </ChartSeries>
    </ChartSeriesCollection>
</SfChart>

@code{
    public class ChartData
    {
        public double X { get; set; }
        public double Y { get; set; }
    }

    public List<ChartData> SalesReports = new List<ChartData>
	{
        new ChartData{ X= 2005, Y= 28 },
        new ChartData{ X= 2006, Y= 25 },
        new ChartData{ X= 2007, Y= 26 },
        new ChartData{ X= 2008, Y= 27 },
        new ChartData{ X= 2009, Y= 32 },
        new ChartData{ X= 2010, Y= 35 },
        new ChartData{ X= 2011, Y= 30 }
    };
}Series customization
Start angle
To customize the start angle of the Radar Chart, use StartAngle property. By default, StartAngle value is 0.
@using Syncfusion.Blazor.Charts

<SfChart>
    <ChartPrimaryXAxis StartAngle="270" ValueType="Syncfusion.Blazor.Charts.ValueType.Category">
    </ChartPrimaryXAxis>

    <ChartSeriesCollection>
        <ChartSeries DataSource="@SalesReports" XName="X" YName="Y"
                     Type="ChartSeriesType.Radar" DrawType="ChartDrawType.Line">
        </ChartSeries>
    </ChartSeriesCollection>
</SfChart>

@code{
    public class ChartData
    {
        public double X { get; set; }
        public double Y { get; set; }
    }

    public List<ChartData> SalesReports = new List<ChartData>
	{
        new ChartData{ X= 2005, Y= 28 },
        new ChartData{ X= 2006, Y= 25 },
        new ChartData{ X= 2007, Y= 26 },
        new ChartData{ X= 2008, Y= 27 },
        new ChartData{ X= 2009, Y= 32 },
        new ChartData{ X= 2010, Y= 35 },
        new ChartData{ X= 2011, Y= 30 }
    };
}Coefficient in axis
To customize the radius of the Radar Chart, use Coefficient property. By default, Coefficient value is 100.
@using Syncfusion.Blazor.Charts

<SfChart>
    <ChartPrimaryXAxis Coefficient="40" ValueType="Syncfusion.Blazor.Charts.ValueType.Category">
    </ChartPrimaryXAxis>

    <ChartSeriesCollection>
        <ChartSeries DataSource="@SalesReports" XName="X" YName="Y"
                     Type="ChartSeriesType.Radar" DrawType="ChartDrawType.Line">
        </ChartSeries>
    </ChartSeriesCollection>
</SfChart>

@code{
    public class ChartData
    {
        public double X { get; set; }
        public double Y { get; set; }
    }

    public List<ChartData> SalesReports = new List<ChartData>
    {
        new ChartData{ X= 2005, Y= 28 },
        new ChartData{ X= 2006, Y= 25 },
        new ChartData{ X= 2007, Y= 26 },
        new ChartData{ X= 2008, Y= 27 },
        new ChartData{ X= 2009, Y= 32 },
        new ChartData{ X= 2010, Y= 35 },
        new ChartData{ X= 2011, Y= 30 }
    };
}NOTE
Refer to the Blazor Charts feature tour page for its groundbreaking feature representations and also explore the Blazor Chart Example to know various chart types and how to represent time-dependent data, showing trends at equal intervals.
Empty points
Data points with null, double.NaN or undefined values are considered empty. Empty data points are ignored and not plotted on the chart.
Mode
Use the Mode property to define how empty or missing data points are handled in the series. The default mode for empty points is Gap.
@using Syncfusion.Blazor.Charts

<SfChart>
    <ChartSeriesCollection>
        <ChartSeries DataSource="@SalesReports" XName="X" Width="2" YName="Y"
                     Type="Syncfusion.Blazor.Charts.ChartSeriesType.Radar">
            <ChartEmptyPointSettings Mode="EmptyPointMode.Gap"></ChartEmptyPointSettings>
            <ChartMarker Visible="true" Height="10" Width="10"></ChartMarker>
        </ChartSeries>
    </ChartSeriesCollection>
</SfChart>

@code {
    public class ChartData
    {
        public double X { get; set; }
        public double Y { get; set; }
    }

    public List<ChartData> SalesReports = new List<ChartData>
    {
        new ChartData{ X= 2005, Y= 28 },
        new ChartData{ X= 2006, Y= 25 },
        new ChartData{ X= 2007, Y= 26 },
        new ChartData{ X= 2008, Y= double.NaN },
        new ChartData{ X= 2009, Y= 32 },
        new ChartData{ X= 2010, Y= 35 },
        new ChartData{ X= 2011, Y= 30 }
    };
}Fill
Use the Fill property to customize the fill color of empty points in the series.
@using Syncfusion.Blazor.Charts

<SfChart>
    <ChartSeriesCollection>
        <ChartSeries DataSource="@SalesReports" XName="X" Width="2" YName="Y"
                     Type="Syncfusion.Blazor.Charts.ChartSeriesType.Radar">
            <ChartEmptyPointSettings Mode="EmptyPointMode.Average" Fill="#FFDE59" ></ChartEmptyPointSettings>
            <ChartMarker Visible="true" Height="10" Width="10"></ChartMarker>
        </ChartSeries>
    </ChartSeriesCollection>
</SfChart>

@code {
    public class ChartData
    {
        public double X { get; set; }
        public double Y { get; set; }
    }

    public List<ChartData> SalesReports = new List<ChartData>
    {
        new ChartData{ X= 2005, Y= 28 },
        new ChartData{ X= 2006, Y= 25 },
        new ChartData{ X= 2007, Y= 26 },
        new ChartData{ X= 2008, Y= double.NaN },
        new ChartData{ X= 2009, Y= 32 },
        new ChartData{ X= 2010, Y= 35 },
        new ChartData{ X= 2011, Y= 30 }
    };
}Border
Use the Border property to customize the Width and Color of the border for empty points.
@using Syncfusion.Blazor.Charts

<SfChart>
    <ChartSeriesCollection>
        <ChartSeries DataSource="@SalesReports" XName="X" Width="2" YName="Y"
                     Type="Syncfusion.Blazor.Charts.ChartSeriesType.Radar">
            <ChartEmptyPointSettings Mode="EmptyPointMode.Average" Fill="#FFDE59" >
                <ChartEmptyPointBorder Color="red" Width="2"></ChartEmptyPointBorder>
            </ChartEmptyPointSettings>
            <ChartMarker Visible="true" Height="10" Width="10"></ChartMarker>
        </ChartSeries>
    </ChartSeriesCollection>
</SfChart>

@code {
    public class ChartData
    {
        public double X { get; set; }
        public double Y { get; set; }
    }

    public List<ChartData> SalesReports = new List<ChartData>
    {
        new ChartData{ X= 2005, Y= 28 },
        new ChartData{ X= 2006, Y= 25 },
        new ChartData{ X= 2007, Y= 26 },
        new ChartData{ X= 2008, Y= double.NaN },
        new ChartData{ X= 2009, Y= 32 },
        new ChartData{ X= 2010, Y= 35 },
        new ChartData{ X= 2011, Y= 30 }
    };
}Events
Series render
The OnSeriesRender event allows you to customize series properties, such as Data, Fill, and Series, before they are rendered on the chart.
@using Syncfusion.Blazor.Charts

<SfChart>
    <ChartSeriesCollection>
        <ChartEvents OnSeriesRender="SeriesRender"></ChartEvents>
        <ChartSeries DataSource="@SalesReports" XName="X" Width="2" YName="Y"
                     Type="Syncfusion.Blazor.Charts.ChartSeriesType.Radar" />
    </ChartSeriesCollection>
</SfChart>

@code {
    public class ChartData
    {
        public double X { get; set; }
        public double Y { get; set; }
    }

    public void SeriesRender(SeriesRenderEventArgs args)
    {
        args.Fill = "#FF4081";
    }

    public List<ChartData> SalesReports = new List<ChartData>
    {
        new ChartData{ X= 2005, Y= 28 },
        new ChartData{ X= 2006, Y= 25 },
        new ChartData{ X= 2007, Y= 26 },
        new ChartData{ X= 2008, Y= 27 },
        new ChartData{ X= 2009, Y= 32 },
        new ChartData{ X= 2010, Y= 35 },
        new ChartData{ X= 2011, Y= 30 }
    };
}Point render
The OnPointRender event allows you to customize each data point before it is rendered on the chart.
@using Syncfusion.Blazor.Charts

<SfChart>
    <ChartSeriesCollection>
        <ChartEvents OnPointRender="PointRender"></ChartEvents>
        <ChartSeries DataSource="@SalesReports" XName="X" Width="2" YName="Y"
                     Type="Syncfusion.Blazor.Charts.ChartSeriesType.Radar">
            <ChartMarker Visible="true" Width="10" Height="10"></ChartMarker>
        </ChartSeries>
    </ChartSeriesCollection>
</SfChart>

@code {
    public class ChartData
    {
        public double X { get; set; }
        public double Y { get; set; }
    }

    public void PointRender(PointRenderEventArgs args)
    {
        args.Fill = args.Point.X.ToString() == "2008" ? "#E91E63" : "#3F51B5";
    }

    public List<ChartData> SalesReports = new List<ChartData>
    {
        new ChartData{ X= 2005, Y= 28 },
        new ChartData{ X= 2006, Y= 25 },
        new ChartData{ X= 2007, Y= 26 },
        new ChartData{ X= 2008, Y= 27 },
        new ChartData{ X= 2009, Y= 32 },
        new ChartData{ X= 2010, Y= 35 },
        new ChartData{ X= 2011, Y= 30 }
    };
}NOTE
Refer to the Blazor Charts feature tour page for its groundbreaking feature representations and also explore the Blazor Chart Example to know various chart types and how to represent time-dependent data, showing trends at equal intervals.