Data Editing in Blazor Charts Component
28 Jul 20263 minutes to read
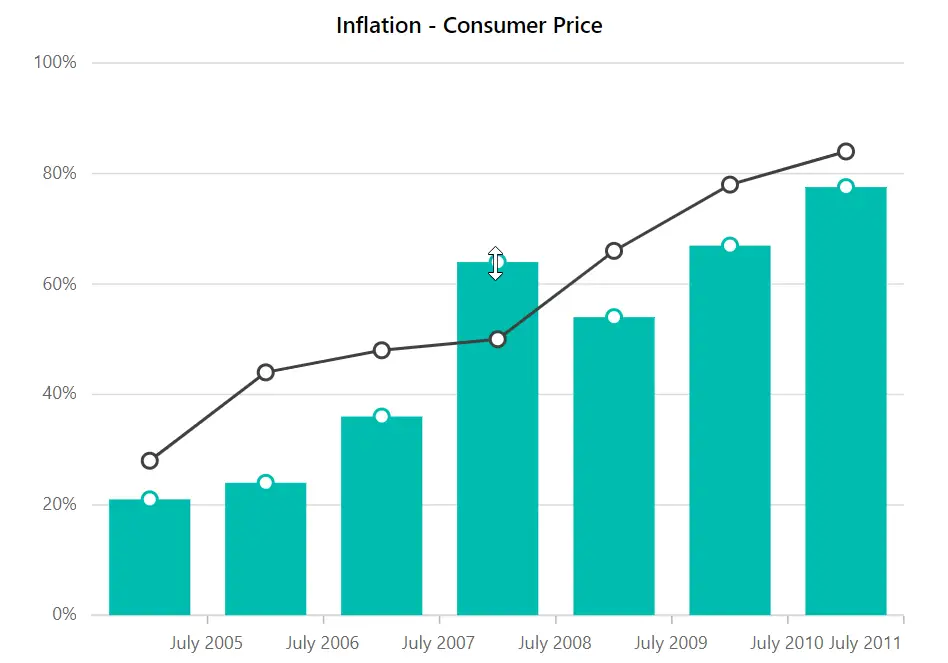
Data editing allows rendered data points to be dragged and dropped at run time. The position or value of a point can be adjusted based on its y‑value. To enable data editing, set the Enable property in the ChartDataEditSettings to true. Use the Fill property to specify the edited point color, and the MinY and MaxY properties to determine data editing’s minimum and maximum range.
@using Syncfusion.Blazor.Charts

<SfChart Title="Inflation - Consumer Price">
    <ChartArea><ChartAreaBorder Width="0"></ChartAreaBorder></ChartArea>

    <ChartPrimaryXAxis ValueType="Syncfusion.Blazor.Charts.ValueType.DateTime" LabelFormat="y"
                       IntervalType="IntervalType.Years" EdgeLabelPlacement="EdgeLabelPlacement.Shift">
        <ChartAxisMajorGridLines Width="0"></ChartAxisMajorGridLines>
    </ChartPrimaryXAxis>

    <ChartPrimaryYAxis LabelFormat="{value}%" RangePadding="ChartRangePadding.None" Minimum="0" Maximum="100"
                       Interval="20">
        <ChartAxisLineStyle Width="0"></ChartAxisLineStyle>
        <ChartAxisMajorTickLines Width="0"></ChartAxisMajorTickLines>
    </ChartPrimaryYAxis>

    <ChartTooltipSettings Enable="true"></ChartTooltipSettings>

    <ChartSeriesCollection>
        <ChartSeries DataSource="@ConsumerDetails" XName="XValue" Width="2"
                     Opacity="1" YName="YValue" Type="ChartSeriesType.Column">
            <ChartMarker Visible="true" Width="10" Height="10">
            </ChartMarker>
            <ChartDataEditSettings Enable="true"></ChartDataEditSettings>
        </ChartSeries>
        <ChartSeries DataSource="@ConsumerDetails" XName="XValue" Width="2"
                     Opacity="1" YName="YValue1" Type="ChartSeriesType.Line">
            <ChartMarker Visible="true" Width="10" Height="10">
            </ChartMarker>
            <ChartDataEditSettings Enable="true"></ChartDataEditSettings>
        </ChartSeries>
    </ChartSeriesCollection>
</SfChart>

@code{
    public class ChartData
    {
        public DateTime XValue { get; set; }
        public double YValue { get; set; }
        public double YValue1 { get; set; }
    }

    public List<ChartData> ConsumerDetails = new List<ChartData>
	{
        new ChartData { XValue = new DateTime(2005, 01, 01), YValue = 21, YValue1 = 28 },
        new ChartData { XValue = new DateTime(2006, 01, 01), YValue = 24, YValue1 = 44 },
        new ChartData { XValue = new DateTime(2007, 01, 01), YValue = 36, YValue1 = 48 },
        new ChartData { XValue = new DateTime(2008, 01, 01), YValue = 38, YValue1 = 50 },
        new ChartData { XValue = new DateTime(2009, 01, 01), YValue = 54, YValue1 = 66 },
        new ChartData { XValue = new DateTime(2010, 01, 01), YValue = 57, YValue1 = 78 },
        new ChartData { XValue = new DateTime(2011, 01, 01), YValue = 70, YValue1 = 84 },
    };
}
NOTE
Refer to the Blazor Charts feature tour page for its groundbreaking feature representations and also explore the Blazor Chart Example to know various chart types and how to represent time-dependent data, showing trends at equal intervals.